Parasites in the cleaning interactions between Labroides dimidiatus and fish
224
0
0
Full text
(2) PARASITES IN THE CLEANING INTERACTIONS BETWEEN LABROIDES DIMIDIATUS AND FISH. by. Alexandra Sara Grutter. A thesis submitted for the degree of Doctor of Philosophy in the Department of Marine Biology at James Cook University of North Queensland, in November 1994..
(3) The cleaner wrasse Labroides dimidiatus inspecting the gill opening of a Plectrorhinchus chaetodontoides. Another L dimidiatus is below P. chaetodontoides. (Photo: Mark A. Johnson). Unidentified Gnathia sp. larva with developed stomach (T1=1.47inm).
(4) Statement of Access. I, the undersigned, the author of this thesis, understand that James Cook University of North Queensland will make it available for use within the University Library and, by microfilm or other photographic means, allow access to users in other approved libraries. All users consulting this thesis will have to sign the following statement:. In consulting this thesis I agree not to copy or closely paraphrase it in whole or in part without written consent of the author; and to make public written acknowledgment for any assistance that I have obtained from it.. Beyond this, I do not wish to place any restriction on access to this thesis.. Alexandra Grutter c. ii. ////9y.
(5) Statement of Sources Declaration. I declare that this thesis is my own work and has not been submitted in any form for another degree or diploma at any university or other institution of tertiary education. Information derived from the published or unpublished work of others has been acknowledged in the text and a list of references is given.. Alexandra Grutter. iii.
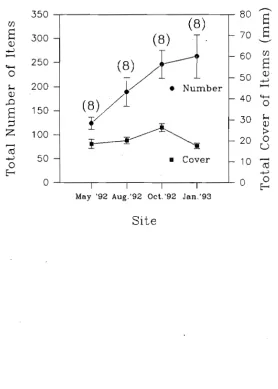
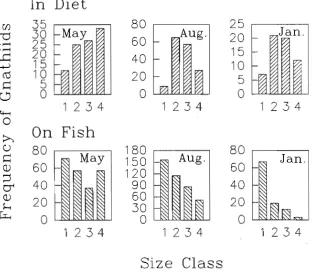
(6) Abstract Parasites are removed from host fish by cleaner fish but their significance in cleaning interactions is still not well understood. This study investigated the significance of parasites in cleaning interactions between the cleaner wrasse. Labroides dimidiatus and its host fish at Lizard Island and Heron Island, Great Barrier Reef, Australia. Detailed information on the external parasite assemblages of several fish species, L. dimidiatus diet analyses and parasite removal rates, host cleaning rates (how often individual host fish are cleaned by L.. dimidiatus), and an experiment involving the removal of all cleaner fish from reefs were used. Host fish had species-specific parasite assemblages which were consitent among localities and time. These parasite assemblages were diverse and included copepods, isopods, monogeneans, digeneans, turbellaria, and unidentified platyhelminths. Host species identity explained most of the variation in the composition of these parasites, while host size was of secondary importance. Patterns of parasite abundance among fish species were similar between widely separated locations although the northern location (Lizard Island) had more species of parasites.. Labroides dimidiatus fed largely on crustaceans, similar to the feeding behaviour of most tropical labrids. However, they selectively fed on parasitic crustaceans rather than benthic crustaceans. Gnathiid isopod larvae were the most abundant crustaceans in the diet. At Lizard Island they selectively fed on larger gnathiids while at Heron Island their diet included fewer gnathiids but more mucus and benthic copepods. The number, size, and biomass of gnathiids at Lizard Island varied temporally with a greater proportion of small gnathiids and less biomass during the austral summer. Variability in the diet suggests both spatial and temporal flexibility in the foraging habits of L. dimidiatus. Host cleaning rates were estimated for 11 fish species by following individuals and recording the number of times and duration that they were inspected by Labroides dimidiatus. Individuals of Siganus doliatus were cleaned the most and spent an estimated 32 minutes per day being cleaned. iv.
(7) Host cleaning rates were positively correlated with the parasite load and surface area of the host. However, surface area explained slightly more of the variation in cleaning rates. This may be because cleaner fish use size of fish as an indicator of food availability. In the fish species Hemigymnus melapterus, larger fish had more parasites and were cleaned more often and for a longer duration. The finding that larger fish with more parasites are cleaned more suggests that size and parasites play an important part in the cleaning behaviour of host fish. The rate at which parasites (mainly gnathiids) were removed from host fish by Labroides dimidiatus was investigated. To examine the effect of parasite removal on parasites, the number of parasites removed per individual. Hemigymnus melapterus per day was estimated and compared to the infection rate and abundnace of gnathiids on H. melapterus. Observations of cleaner fish feeding rates, estimates of host cleaning rates, stomach content analyses, and an experimental manipulation of gnathiid abundances on fish were used. Labroides. dimidiatus inspected an estimated 2297 (±SE 83) fish per day and ate large numbers of parasites (mainly gnathiid isopods) each day (1218 ±SE 118). The estimated predation rate by L. dimidiatus was 4.8 (±SE 0.4) parasites per minute of inspection or 0.5 (±SE 0.05) parasites per fish inspected. However, the infection rate of gnathiids onto fish was high with reduced gnathiid loads (about 50%) on fish returning to levels similar to control fish within 1-6 days. These infection rates suggest that a significant proportion of gnathiids removed by cleaner fish are quickly replaced. However, the estimated number of gnathiids removed per H. melapterus per day by L. dimidiatus was 61 (±SE 5) which was over 5 times the standing crop of gnathiids on H. melapterus (11 ±SE. 3). Such a high predation rate relative to the number of gnathiids on fish. and their infection rates onto fish, implies that cleaner fish may have an effect on the abundance of gnathiids on fish. However to what extent gnathiid abundances are suppresed is unclear. An experimental evaluation of the effect of Labroides dimidiatus on the fish Pomacentrus moluccensis was done by removing all L. dimidiatus from several reefs for 6 months. The subsequent effect on parasites (total number, number per taxonomic category of parasite, and size of parasite) and host fish abundance was estimated and compared to control reefs with L. dimidiatus..
(8) This was the first time this experiment has been conducted in an area where L.. dimidiatus has high densities of parasites in its diet. The absence of L. dimidiatus had no effect on total parasite abundance per fish, number per category of parasite per fish, and size of the most abundant copepod per fish. The abundance of P. moluccensis also did not differ among reefs with and without L. dimidiatus. Thus P. moluccensis did not leave reefs to seek cleaning elsewhere nor suffer increased mortality in the absence of L. dimidiatus. The absence of an effect of L. dimidiatus on the parasites of P. moluccensis is compatible with L. dimidiatus foraging behaviour as L. dimidiatus selectively fed on larger gnathiids not present on P. moluccensis. Why fish, such as P.. moluccensis, which do not benefit from cleaning, seek cleaning may be due to factors other than ectoparasite removal, such as tactile stimuli provided by cleaners. This study suggests that cleaner fish foraging patterns determine the effect cleaner fish have on parasites. Thus, although cleaning behaviour may be driven by tactile stimuli provided by cleaners, the effect of cleaners on hosts may vary according to the foraging patterns of cleaner fish and the parasite loads of hosts.. vi.
(9) Acknowledgements I am indebted to my supervisor Howard Choat for his guidance, support, and enthusiasm throughout this research. His belief in my abilities and encouragement at all times, particularly when I decided to chase after parasites, was invaluable. This work was inspired by his work on labrid fishes. This project could never have been done without the support and enthusiasm of those who spent long hours helping me in the field and laboratory. Thank you Mark, Larnie, Lynda, Steve, Adrian, Evizel, John, Chris, Jenny, Dave, Pascal, Fabian, Emma, and Libby for all the help. Many thanks also to the staff of Lizard Island Research Station, Marianne and Lance Pearce, Anne Hoggett, and Lyle Vail, whose friendship, assistance, and BBQs made my field trips so enjoyable and to the Heron Island Research Station staff for their assistance. James Cook University staff and others provided much assistance. Technical staff of the School of Biological Sciences were especially helpful. Thank you Leigh Winsor, Lynda Axe, Gordon Bailey, Ann Sharp, Jan Woodley, Savita Francis, and Zolly Florian. The Sir George Fisher Centre generously allowed me the use of their facilities and Sandy Smith, Randi Larsen, and Dave Sutton kindly provided assistance. Thanks Natalie Moltschaniwskyj, Andrew Lewis, Glen De'ath, Hugh Sweatman, and Ross Alford for all the statistical help and Mark Farrow for Figure 3.1. I am grateful to all those who spent so much time and effort on reading parts of this thesis: Howard Choat, David Blair, Natalie Moltschaniwskyj, Geoff Jones, Mark McCormick, Vicki Nelson, Dirk Zeller, Julian Caley, Maria Milicich, Hugh Sweatman, Ross Alford, Andrew Lewis, Terry Hughes, Richard Rowe, Vicki Hall, and Kathy Kavanaugh. Your comments were invaluable. This project also benefitted greatly from discussions with Dave Bellwood, Geoff Jones, Ross Alford, Hugh Sweatman, Gary Russ, and Peter Doherty. I am indebted to all those who kindly gave me parasitological advice and identified specimens: David Blair, Gary Poore, Brian Cohen, Geoff Boxshall, vii.
(10) Zbigniew Kabata, Lester Cannon, Tom Cribb, and Ian Whittington. This research was funded by the Australian Museum in the form of an Australian Museum Postgraduate Grant and a Lizard Island Doctoral Fellowship, a J.C.U. Merit Research Grant, a P.&O. Australia Limited/Heron Island Research Station Reef Research Fellowship, and internal James Cook University funds. Other financial support was provided by an Overseas Postgraduate Research Scholarship and a James Cook University Research Award for Overseas Students. Many friends provided friendship and support which enabled me to make it through this PhD relatively sane. I thank Bridgid, Andrew, Mark, Kathy, Robyn, Alison, Natalie, Vicki, Hugh, Laura, Jo, David, Karen, Craig, Maria, and many others too numerous to mention. Many thanks to my family for their support throughout my studies, especially my parents, who have always inspired me, and Sylvia, Allen, and Lee. But most of all I would like to thank Mark Johnson for his love, patience, and encouragement and for always being there for me. Mark this thesis is dedicated to you.. viii.
(11) Table of Contents. GENERAL INTRODUCTION. 1. 1.1 Overview. 1. 1,2 Ectoparasites of Fish. 2. 1.3 The Diet of Cleaner Fish. 3. 1.4 Parasites and Host Cleaning. 3. 1.5 Thesis Outline. 5. A COMPARISON OF METHODS FOR SAMPLING ECTOPARASITES FROM CORAL-REEF FISHES. 8. 2.1 Summary. 8. 2.2 Introduction. 8 10. 2.3 Methods and Materials 2.3.1 Sampling Design. 10. 2.3.2 Methodological Comparisons. 10. 2.3.3 Collection and Handling of Fish. 11. 2.3.4 Parasite Recovery from Fish. 11. 2.3.5 Quantifying Parasites. 12. 2.3.6 Fish Transport Comparisons (1&2). 13. 2.3.7 Parasite Recovery Comparisons (3-5). 14. 2.3.8 The Effectiveness of Chloretone (Comparison 6). 14. 2.3.9 Statistical Analyses. 15 16. 2.4 Results. 16. 2.4.1 Fish Transport 2.4.2 Rinse vs. Chloretone. 16. 2.4.3 Filter Size. 17. 2.4.4 Removed vs. Remaining. 18. 2.4.5 Chloretone Efficiency. 18 19. 2.5 Discussion ix.
(12) SPATIAL AND TEMPORAL VARIATIONS OF THE ECTOPARASITES OF SEVEN REEF FISH SPECIES FROM LIZARD ISLAND AND HERON ISLAND. 30. 3.1 Summary. 30. 3.2 Introduction. 30. 3.3 Methods and Materials. 32. 3.3.1 Sampling Design 3.3.2 Sites. 32 33. 3.3.3 Locations. 33. 3.3.4 Time. 33. 3.3.5 Fish Size. 34. 3.3.6 Statistical Analyses. 34. 3.3.7 Capture of Fish and Parasite Quantification. 35. 3.4 Results 3.4.1 Species and Sites 3.4.2 Locations. 37 37 39. 3.4.3 Time. 40. 3.4.4 Fish Size. 41. 3.5 Discussion. THE DIET OF LABROIDES DIMIDIATUS. 41 52. 4.1 Summary. 52. 4.2 Introduction. 52. 4.3 Methods and Materials 4.3.1 Spatial and Temporal Variation in the Diet 4.3.2 Fish Collection. 54 54 55. 4.3.3 Diet Analyses. 55. 4.3.4 Gnathiid Sizes. 56. 4.3.5 Gnathiid Biomass. 56. 4.3.6 Extent of Digestion of Gnathiids. 57. 4.3.7 Statistical Analyses. 57.
(13) 4.4 Results. 57. 4.4.1 Comparison of Diet Among Times. 58. 4.4.2 Comparison of Diet Between Locations. 59. 4.4.3 Comparison of Diet Among Times. 59. 4.4.4 Gnathiid Sizes. 60. 4.4.5 Gnathiid Biomass. 60. 4.4.6 Extent of Digestion of Gnathiids. 61 61. 4.4 Discussion.. THE RELATIONSHIP BETWEEN CLEANING RATES AND ECTOPARASITE LOADS IN CORAL REEF FISHES. 76. 5.1 Summary. 76. 5.2 Introduction. 76. 5.3 Methods and Materials. 78. 5.3.1 Host Cleaning Behaviour. 79. 5.3.2 Inspection Rates Among Species. 79. 5.3.3 Inspection Rates Within Hemigymnus melapterus. 81. 5.3.4 Parasite Load Estimates. 81. 5.3.5 Surface Area Estimates. 82 83. 5.4 Results. 85. 5.5 Discussion. PARASITE REMOVAL RATES BY LABROIDES DIMIDIATUS. 92 92. 6.1 Summary 6.2 Introduction. 92. 6.3 Methods and Materials. 95. 6.3.1 Feeding Rates. 95. 6.3.2 Parasite Ingestion Rate. 96. 6.3.3 Gut Clearance Rate. 96. 6.4.4 The Number of Parasites Removed per Individual Fish per Day xi. 97.
(14) 6.3.5 Parasite Infection Rate. 97. 6.3.6 Tagging. 97. 6.3.7 Statistical Analyses. 98 100. 6.4 Results 6.4.1 Feeding Rates. 100. 6.4.2 Parasite Ingestion Rate. 101. 6.4.3 Gut Clearance Rate. 101. 6.4.4 The Number of Parasites Removed per Individual Fish per Day 6.4.5 Parasite Infection Rate. 102 102 103. 6.5 Discussion. AN EXPERIMENTAL EVALUATION OF THE EFFECT OF LABROIDES DIMIDIATUS ON THE FISH POMACENTRUS. 114. MOLUCCENSIS. 7.1 Summary. 114. 7.2 Introduction. 114. 7.3 Methods and Materials. 117. 7.3.1 Description of Sites. 117. 7.3.2 Removal of Labroides dimidiatus. 118. 7.3.3 Collection of Parasites. 118. 7.3.4 Fish Abundance Estimates. 118 119. 7.3.5 Statistical Analyses. 119. 7.4 Results. 120. 7.5 Discussion. 128. GENERAL DISCUSSION. 8.1 Overview. 128. 8.2 The Ectoparasites. 128. 8.3 The Diet of Labroides dimidiatus xii. 128.
(15) 8.4 Parasites in Interactions Between Cleaners and Hosts. 130. 8.5 Future Directions. 134. LITERATURE CITED APPENDIX I Publications Resulting From This Thesis. 135 142.
(16) CHAPTER I GENERAL INTRODUCTION. 1.1 OVERVIEW Cleaning behaviour is an interaction between cleaners and hosts in which parasites and other material are removed from hosts by the cleaner. The behaviour is widespread in aquatic environments. Cleaners are generally fish or crustaceans while hosts are mainly fish. Cleaner fish have been recorded in freshwater systems (Spall 1970, Abel 1971, Wyman and Ward 1962) and in marine temperate (McCutcheon and McCutcheon 1964, Ayling and Grace 1971, Hobson 1971, Potts 1973a) and tropical systems (Feder 1966, Potts 1973b). Fish of the genus Labroides, of which there are five species, are the most common cleaner fish in tropical waters (Randall 1958, Randall et al. 1990). Although it is generally assumed that parasites are the targets for cleaning associations, the evidence is conflicting and the extent to which their abundance motivates cleaning is still not understood. This study examines the parasite assemblages on tropical reef fishes and whether cleaning by Labroides dinzidiatus influences this assemblage. A study of the importance of 'cleaning' to the diet of cleaners, the fish being cleaned, and its parasite assemblage requires an approach involving information on parasite assemblages of host fish and the rates and processes involved in their removal. By comparing cleaner fish diet analyses to host parasite assemblages, information on cleaner fish feeding selectivity is obtained. Analyses of the diet of cleaner fish also provide information on the contribution of parasites to the total diet. Examining the relationship between host cleaning behaviour and parasites provides insight into the significance of parasites in host cleaning behaviour. The cleaner fish feeding rates combined with diet analyses provide an estimate of the rate at which parasites are. 1.
(17) CHAPTER I. GENERAL INTRODUCTION removed from fish by cleaner fish. When these parasite removal rates are combined with parasite infection rates an estimate of the impact of cleaner fish on parasites is obtained. Finally, the effect of cleaner fish on parasites can also be evaluated by removing all cleaner fish from reefs and examining the subsequent effeCt on the parasites of fish. This study therefore used a combination of analyses of parasites on fish, cleaner fish diet analyses, host cleaning rates, cleaner fish feeding behaviour rates, a parasite manipulation experiment, and a cleaner fish removal experiment to investigate the significance of parasites in cleaning interactions.. 1.2 ECTOPARASITES OF FISH Parasitological information in cleaning studies is sparse. Behavioural studies on the effect of parasites on the feeding behaviour of the cleaner fish have shown that cleaner fish prefer fish with ectoparasites (Gorlick et al. 1984). The effect of parasites loads on host cleaning behaviour is conflicting (Losey 1971, 1979). While ectoparasite densities amplified the response of one host fish species towards cleaner fish and had no effect on the other species, tactile stimuli provided by cleaners had a very strong effect on host responses towards cleaners. Chikasue (1990) showed that host responses towards cleaners were stronger when parasite loads were higher. Cleaner fish removal experiments have also used parasite information ranging from "approximations of numbers of parasites" (Youngbluth 1968) to progressively more detailed counts of parasites (Losey 1972, Gorlick et al. 1987). Due to the paucity of studies of the cleaning procedure that have quantified parasites, the importance of parasite numbers and taxonomic composition remains unclear. One of the reasons that parasitological information has rarely been collected in studies of cleaning interactions is because of the problems associated with sampling ectoparasites and identifying parasites. In addition, confined (laboratory) conditions of host fish often exasperate parasite 2.
(18) CHAPTER I. GENERAL INTRODUCTION infections, producing a marked increase in parasite loads. Sampling procedures which are quick and reliable as well as studies involving natural parasite loads are needed for the study of parasites in cleaning interactions.. 1.3 THE DIET OF CLEANER FISH Cleaner fish are well documented to eat ectoparasites (Randall 1958, Strasburg 1959, Cressey and Lachner 1970, Bohlke and McCosker 1973, Potts 1973b). However, the contribution of parasites to the total diet of cleaner fish is still unclear. Although the diet of the genus Labroides has been examined (Randall 1958), there are only two detailed quantitative studies, one on L.. phthirophagus (Youngbluth 1968), and one L. dimidiatus (Chikasue 1990). These, however, are not of sufficient detail to determine whether parasites are the most important items in the diet of these cleaner fish. There is also little information on how the diet varies temporally and spatially and how this relates to parasite loads of host fishes. Work in Hawaii has suggested that mucus may be an important part of the diet of cleaner fish and that cleaner fish may feed on mucus when parasite loads are low (Gorlick 1980). The implication of these findings is that cleaner fish may, at times, be parasitic on their hosts (Gorlick 1980). The quantity and caloric value of mucus on hosts also influences what hosts cleaner fish prefer (Gorlick 1984). However, despite the importance of mucus in the diet of cleaner fish, the proportion of mucus in the diet of cleaner fish is unknown, as no diet analyses have quantified mucus. Diet analyses which quantify mucus, in addition to parasites and other materials, are needed to resolve this problem.. 1.4 PARASITES AND HOST CLEANING Cleaning interactions involve a series of behaviours which can be 3.
(19) CHAPTER I. GENERAL INTRODUCTION influenced by the cleaner or host fish (Losey 1971). Host fish either approach cleaner fish or are approached by cleaners, hosts then respond to cleaners usually by "posing" with their fins extended and mouth open. Cleaners then "inspect" hosts by slowly swimming around the fish, often contacting it with its body, and using the body surfaces of fish as a substrate to feed from (Losey 1971). Information on how parasites influence the outcomes of these interactions is needed to understand the procedures involved in cleaning behaviour. To address the question of the significance of parasites in cleaning interactions, the relationship between how often host fish are cleaned by. Labroides dimidiatus and how many parasites hosts have has been examined. It has been suggested that larger fish are cleaned more often than smaller fish (Poulin 1993). However Poulin's study was based on the feeding rates of cleaners, rather than on how much host fish were cleaned, and no evidence on parasite numbers was supplied. The effect of parasite load on the responses of hosts towards cleaners is conflicting. Losey (1979) found that a host fish species showed more response to cleaners when it had parasites than when it had no parasites, however for another host fish species its response toward cleaners was the same regardless of parasite load. A study that correlates how often individual fish are cleaned (host cleaning rates) to their parasite loads will provide information on the importance of parasites in cleaning interactions. Although removal of ectoparasites is largely assumed to be the ultimate cause of the behaviour, there is little evidence to support this. Several quantitative tests have been made to determine the effect of the absence of cleaner fish on the parasites and abundance of hosts (Youngbluth 1968, Losey 1972, Gorlick et al. 1987). Only Gorlick et al. (1987) found an effect in the form of larger parasites on fish without cleaners. However, whether hosts benefited from having a reduced biomass of parasites could not be determined. These experiments were done in Hawaii and at Enewetak Atoll where the 4.
(20) CHAPTER I. GENERAL INTRODUCTION abundance of parasites in the diet of cleaner fish is relatively low (Youngbluth 1968, Losey pers. comm.). Losey (1987) suggested a removal experiment is needed in a different ecological setting where the removal of parasites may be more important to host fish. Such an experimental approach may provide insight into whether the ultimate cause of cleaning for hosts is ectoparasite removal or whether other factors, such as tactile stimuli provided by cleaners (Losey and Margules 1974, Losey 1977, 1979) are the cause of cleaning in hosts.. 1.5 THESIS OUTLINE This study examined the dynamics of the interactions among cleaner fish, host fish, and parasites using a quantitative approach. The cleaner wrasse. Labroides dimidiatus was used in this study as its social behaviour and life history is well documented (Robertson 1974) and it is widely distributed (Randall 1958). Information on the parasite loads of fish serves as the foundation from which to interpret the significance of parasites in cleaning interactions. Because there is some evidence that the ecological role of cleaning varies geographically (Losey 1974), this study was conducted at two locations separated by 1000 km (Lizard Island and Heron Island, Great Barrier Reef, Australia). This thesis is organised so that each data chapter is a complete work united by a common question. A summary is given at the start of each data chapter. The thesis consists of 8 chapters, 6 of these chapters (2-6) represent submitted papers, four of which are in press (Appendix I).. Chapter 2. A comparison of methods for sampling ectoparasites from coral reef fishes This chapter addresses problems in sampling external parasites and develops a general method to reduce biases..
(21) CHAPTER I. GENERAL INTRODUCTION. Chapter 3. Spatial and temporal variations of the ectoparasites of seven reef fish species from Lizard Island and Heron Island The number and species composition of external parasites of seven fish species was examined at Lizard Island and Heron Island. This parasite information is used in interpreting interactions between cleaner fish and host fish.. Chapter 4. The diet of Labroides dimidiatus Spatial variation in the diet of Labroides dimidiatus was examined among sites at two locations (Lizard Island and Heron Island) and between the two locations. Temporal variation in the diet was investigated at several month intervals. To determine whether cleaner fish selectively feed on larger parasites, the size of the most abundant parasite in the diet of L. dimidiatus was compared to the size of that parasite on the host fish species Hemigymnus. melapterus.. Chapter 5. The relationship between cleaning rates and ectoparasite loads in coral reef fishes The rate at which individual fish were cleaned by Labroides dimidiatus was quantified for 11 species. The duration and frequency of these cleaning events were compared to the mean parasite load and mean surface area of each species. To examine whether these cleaning rates varied within a fish species, the cleaning rates of a range of sizes of the host fish species Hemigymnus. melapterus were estimated.. Chapter 6. Parasite removal rates by Labroides dimidiatus In order to determine whether Labroides dimidiatus influence parasite abundance, the number of parasites removed (mainly gnathiids) by cleaner fish per unit time of cleaning was estimated and compared to gnathiid infection 6.
(22) CHAPTER I. GENERAL INTRODUCTION rates.. Chapter 7. An experimental evaluation of the effect of Labroides dimidiatus on the fish Pomacentrus moluccensis The effect of Labroides dimidiatus on the fish Pomacentrus moluccensis was examined by excluding all cleaner fish from several reefs for 6 months. The subsequent effect on the total number and species composition of external parasites, the size of the most abundant copepod, and the abundance. Pomacentrus moluccensis among reefs with and without cleaners was examined.. 7.
(23) CHAPTER II A COMPARISON OF METHODS FOR SAMPLING ECTOPARASITES FROM CORAL REEF FISHES. 2.1 SUMMARY Methods for sampling ectoparasite assemblages were compared using 7 species of coral reef fishes (Acanthochromis polyacanthus, Thalassoma lunare, Ctenochaetus. striatus, Chlorurus sordidus, Scolopsis bilineatus, Hemigymnus melapterus, and Siganus doliatus). Estimates of total numbers and composition of ectoparasites were dependent on post-collection handling techniques, and the method of ectoparasite removal. The following steps were used to obtain accurate estimates of parasite loads. Fish were enclosed within plastic bags underwater at the point of capture. Filtration of water from the plastic bags revealed a large number of parasites (mainly gnathiid isopods) which had detached from the host on capture. A subsequent seawater rinse removed a large number of ectoparasites but further treatment with the anaesthetic chloretone released additional individuals. A small number of parasites remained on fish after all treatments and were removed by visual inspection. A chloretone bath was more effective than a saltwater bath at removing parasites. The species composition of parasites recovered by a chloretone bath plus a visual survey was different to that recovered with a seawater bath and visual survey which suggests traditional scanning techniques may not detect all parasites.. 2.2 INTRODUCTION Accurate estimates of assemblages of parasites on fish are crucial to understanding the role of parasites in cleaning interactions. Parasites of fishes are also increasingly being used as tools for analysing host biogeography (Byrnes and Rohde 1992), host evolutionary relationships (Brooks and McLennon 1993), for fish stock discrimination (MacKenzie 1983, Lester and to validate host demography studies (Lester et. et al. 1988, Lester 1990),. al. 1985). However, recent. work has cast doubt on the reliability of traditional fish parasite surveys 8.
(24) CHAPTER II. SAMPLING ECTOPARASITES (Williams et al. 1991). There is also much variation in the protocols for sampling parasites which presents a problem for comparative studies as differences due to sampling methods can confound real biological differences in parasite loads. Parasite sampling programs generally follow three steps which vary widely: host collection (Rhode and Roubal 1980, Yeo and Spieler 1980, Nagasawa 1985, Silan and Maillard 1989, Koskivaara et al. 1991, Whittington and Kearn 1993), post-collection handling (Collins 1984 , Silan and Maillard 1989, Byrnes and Rohde 1992) and parasite removal and quantification (Byrnes and Rohde 1992, Cowell et al. 1993, Whittington and Kearn 1993). With such a large number of different methods, the potential for methodological bias is high. A few recent studies suggest that traditional methods used to quantify parasites may underestimate internal and external parasite loads with parasite losses occurring during the collection of host (Nagasawa 1985, Williams et al. 1991), in post-collection handling (Willer 1976, Hine 1980a, 1980b), and in the detection of parasites (Gaida and Frost 1991). That losses of internal parasites due to handling can occur (Miller 1976, Hine 1980a, 1980b, Williams et al. 1991) implies that external parasites are even more likely to be influenced by handling as they are more exposed than internal parasites. However, to my knowledge, only two studies have examined the effect of methods on ectoparasite losses, one which compares gillnets with longlines (Nagasawa 1985) and the other which compares visual censuses of parasites with and without a chemical agent which makes parasites opaque (Gaida and Frost 1991). Furthermore, only one parasite species was involved in each of these studies. Despite increasing evidence for sampling biases in the parasite quantification process the issue is seldom addressed in parasitological studies. A program which identifies the sources of biases in parasite sampling is the first step in developing a protocol for the collection of parasites from host fishes. The second step is to examine other sources of sampling error such as spatial and temporal variation which may confound results (Chapter III). This study examines sampling biases during post-collection handling and parasite 9.
(25) Table 2.1. An outline of the methods used to examine the influence of methodology on the numbers and species composition of ectoparasites. Comparisons are numbered 1-6. Method. Transport container vs fish bag vs fish (alive) (dead) (2) (1). Species. H. melapterus. H.melapterus T. lunare. Fish collection Plastic bag size Fish transport Post transport Pre-rinse Chloretone Rinse Filter size (um) Scanned fish. net 20 L bag live, container dead, 2 L bag no yes yes 200 no. net 2L dead, 2 L bag. 'See methods and materials.. Parasite recovery bag-i-rinse vs chloretone (3) chloretone vs 200,um vs 57gm filter(4) seawater removed vs remaining (5) (6) 7 species' S. bilineatus net 2L dead, 2 L bag. net 2L dead, 2 L bag. yes yes yes 200 then 57 yes. no yes/no yes 200 plus 57 yes. It. no yes yes 200 no.
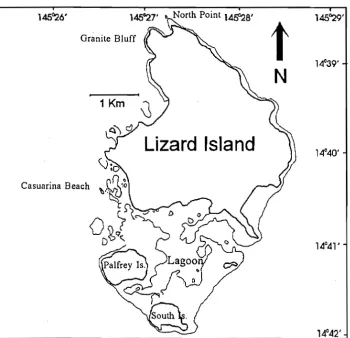
(26) CHAPTER II. SAMPLING ECTOPARASITES removal and quantification and develops a procedure, using comparisons among six methods to recover parasites, for measuring parasite loads. The study uses seven common coral reef fishes of varying morphology and ecology which are used in the study on host-cleaner fish interactions. 2.3 METHODS AND MATERIALS 2.3.1 SAMPLING DESIGN The fish species used are Acanthochromis polyacanthus (Pomacentridae),. Ctenochaetus striatus (Acanthuridae), Scolopsis bilineatus (Nemipteridae), Szganus doliatus (Siganidae), Chlorurus sordidus (Scaridae), Thalassoma lunare (Labridae), and Hemigymnus melapterus (Labridae). They were selected because they coexist in similar habitats on the reef and are abundant and relatively easy to capture. A total of 90 fish were collected from 4 sites on Lizard Island(North Point, Granite Bluff, Lagoon,Casuarina Beach), Great Barrier Reef, Australia (Fig. 2.1). The sites are in shallow fringing coral reefs which are located around the island and have different levels of wave exposure. The fish were used in 6 comparisons of methods. Due to logistical constraints, only the comparisons 3-5 used all 7 species (Table 2.1). For the remaining comparisons, 1-2 readily available species were selected. In August 1992, specimens of H. melapterus for comparison 1 and 2 and specimens of T. lunare for comparison 2 were collected. In January 1993, A polyacanthus, C. striatus, S. bilineatus, S.. doliatus, C. sordidus, T. lunare, and H. melapterus were collected for comparisons 3-5. In November 1993, S. bilineatus were collected for comparison 6. 2.3.2 METHODOLOGICAL COMPARISONS The 6 comparisons (1-6) are summarised in Table 2.1. To examine postcollection handling, fish were either transported alive in large (20L) containers (1) or dead in plastic bags (2) and the fluids of the container or plastic bag and the fish examined for parasites. Parasite removal and quantification was. 10.
(27) CHAPTER II. SAMPLING ECTOPARASITES examined using comparisons 3-6 with the same specimens used in comparisons 3-5. Fish were removed from plastic bags and rinsed with seawater then soaked in the anaesthetic chloretone to determine if enclosure in a plastic bag and a rinse was enough to remove parasites and whether additional parasites were removed with the anaesthetic (3). To select a filter size for use in recovering parasites from liquids, all liquids (plastic bag contents, rinse, and chloretone) were filtered first with a 200 pm then a 57 pm filter and the parasites recovered with each filter compared (4). To examine how effective these methods were in removing all parasites, fish were scanned under a microscope for remaining parasites which were compared with the recovered parasites (plastic bag .contents, rinse, and chloretone soak) (5). Comparison 6 measured the efficiency of chloretone at recovering parasites by comparing the parasites recovered when fish were soaked in either chloretone (dissolved in seawater) or seawater. 2.3.3 COLLECTION AND HANDLING OF FISH Fish were captured using a 15 m X 1.6 m barrier net with a 20 mm mesh. Fish were herded into the net one at a time and captured with a hand net. All fish, except those to be transported alive in containers (see fish transport comparisons), were placed in a quick-seal 2 L plastic bag as quickly as possible (15-60 s). Fish were then enclosed in a second plastic bag, and kept underwater in a mesh bag for up to 1 h. Fish died quickly from lack of oxygen. Fish in bags were placed in a shaded 40 L plastic container of seawater for up to 1 hour and taken to the laboratory. Ice was added to the water supporting the bags, and the water and fish refrigerated for 2-10 hrs. 2.3.4 PARASITE RECOVERY FROM FISH All fish, except those collected for the parasite recovery comparisons (35), were removed from plastic bags and the contents of the plastic bags set aside for filtration. The whole fish, with each operculum slit at the base and pried open, was covered in a solution of 0.4% chloretone (BDH Chemicals, Poole, England) in 57 gm filtered seawater for 30-60 min following Hargis (1953). Fish 11.
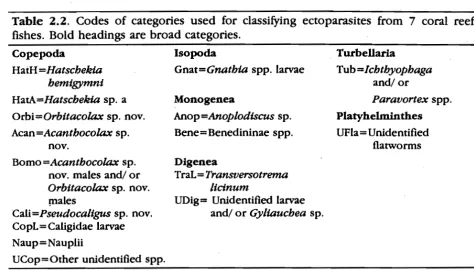
(28) Codes of categories used for classifying ectoparasites from 7 coral reef fishes. Bold headings are broad categories.. Table 2.2. Copepoda. Isopoda. Tu.rbellaria. HatH=Hatschekia. Gnat=Gnathia spp. larvae. Tub=Ichthyophaga and/ or. HatA=Hatschekia sp. a. Monogenea. Orbi=Orbitacolax sp. nov.. Anop=Anoplodiscus sp.. Platyhelminthes. Acan=Acanthocolax sp.. Bene=Benedininae spp.. UFIa=Unidentified flatworms. Bomo =Acanthocolax sp. nov. males and/ or Orbitacolax sp. nov. males Cab=Pseudocaligus sp. nov. CopL=Caligidae larvae. Digenea TraL= Transversotrema licinum UDig= Unidentified larvae and/ or Gyliauchea sp.. hemigymni. nov.. Naup=Nauplii UCop= Other unidentified spp.. Paravortex spp..
(29) CHAPTER II. SAMPLING ECTOPARASITES were then rinsed thoroughly with filtered seawater. During rinsing, the body surface, fins, gills, buccal cavity, lips, eyes, and nares were gently scraped with the squirt bottle nozzle. All plastic bags, filters, and containers were rinsed. 3. times. The rinses, anaesthetic bath, and plastic bag contents were filtered (nylon plankton mesh). Parasites were removed from the filter and placed in vials containing 10% formalin in 57 ,um filtered seawater. The gills of Hemigymnus. melapterus contain many Hatschekia hemigymni (Copepoda) after the chloretone bath (pers. obs.) therefore the gills from all H. melapterus were removed before the chloretone bath and fixed for parasite counts. 2.3.5 QUANTIFYING PARASITES The contents of the vials containing fixed parasites were allowed to settle for a minimum of 30 min and the excess liquid decanted. An inspection of the decanted material revealed no parasites. Before sorting parasites from H.. melapterus gills, blood cells associated with the gills were removed by shaking the vials, allowing parasites to settle for 30 min, and suspended blood cells decanted. Less than 1% of the total parasites were present in decanted material. All remaining material was examined with a sorting tray under a stereo microscope (35X) and sorted into several categories (Table 2.2). Only some parasites could be identified to genus or species with some of the few keys for Australian parasites (Bruce 1986, Lester and Cannon 1988, Kabata 1991, Cribb et al. 1992 ). The remaining parasites were placed in as narrow as possible categories and were examined by other workers ( G. Boxshall, L. Cannon, B. Cohen, T. Cribb, Z. Kabata, I. Whittington). Some copepods were larvae or males and could therefore not be identified to species (Z. Kabata pers. comm.). Gnathiids can only be identified from adult males (Holdich and Harrison 1980), therefore adult males were reared from larvae found on Siganus doliatus and Hemigymnus melapterus. Juvenile larvae in the last larval stage were placed in vials containing filtered seawater for 1-2 weeks, after which they molted to adults. These reared adults were a new species of. Gnathia (Gnathidae:) (B. Cohen pers. comm.). Fixed larvae either belonged to 12.
(30) CHAPTER II. SAMPLING ECTOPARASITES this new species or to at least one other species of Gnathia (B. Cohen pers. comm.), therefore all gnathiids were combined under the category Gnathia spp. Little is known about parasitic turbellaria of fish with only one study in Australia which describes turbellarians to genera only (Cannon and Lester 1988). These two genera were found and combined. To quantify the parasites in the preserved gills of Hemigymnus melapterus, gills were cut into individual arches, fixative added, and the contents shaken and rinsed 3 times. Parasite numbers were initially expressed as a function of weight of host and surface area of host. The relative difference among species was the same in both cases as surface area is curvilinear to weight (In area = 0.665 x 2.198(weight)). Weight is a more easily estimated measure of body size therefore weight was used to adjust for differences in body size among species. 2.3.6 FISH TRANSPORT COMPARISONS (1&2) To quantify parasite losses during the transport of live fish, Hemzgyrnnus melapterus (n=7) were captured and placed in 20 L plastic bags to reduce handling stress. Fish were taken directly to the boat and placed in separate covered plastic containers (10-20 L seawater) for 2 h during transport to laboratory. Fish were then removed from containers, killed with a blow to the head, and placed in plastic bags and refrigerated. Parasites on the fish were recovered and quantified as above using a 200 um filter. The contents of containers were filtered with a 200 ,um filter and fixed. The parasites in the container were compared to those recovered from fish (comparison 1). To determine how many parasites are lost when fish are transported dead in plastic bags, H. melapterus (n=8) and Thalassoma lunare (n=13) were collected as described above, placed in 2L plastic bags where they died, and the parasites in the bag contents and on the fish quantified 2-10 h afterwards as described above (comparison 2).. 13.
(31) CHAPTER II. SAMPLING ECTOPARASITES 2.3.7 PARASITE RECOVERY COMPARISONS (3-5) All seven species were used to investigate the parasite recovery process (n=4-8 per species). Fish were removed from the 2L plastic bags and the contents of the plastic bag set aside. Fish were rinsed thoroughly and the rinse added to plastic bag contents (bag+rinse in comparison 3). All fish, except for. Cblorurus sordidus (see below), were soaked in chloretone and rinsed (chloretone in comparison 3). The chloretone and rinse solutions were filtered with a 200 ,um then 57 ,Urn filter and the filtrates kept separately (comparison 4). To quantify how many parasites remain on the fish after the anaesthetic bath, the entire body surface of the above specimens, including the fins, eyes, and nares were inspected under a stereo microscope (16-20X). Gills were removed, cut into individual arches, and inspected. The operculum was removed to inspect the gill and buccal cavity. Any disfigurements of the skin or scales were examined further for turbellarians and other flatworms. Specimens of C.. sordidus were scanned under a microscope rather than soaked in chloretone to recover parasites, as the thick mucus in their gills and body surface blocks filters. The parasites recovered (bag, rinse, and chloretone) were compared to those remaining on fish (comparison 5). The parasites recovered and those remaining on fish were summed to investigate differences in parasite numbers between species. 2.3.8 THE EFFECTIVENESS OF CHLORETONE (COMPARISON 6) To measure the effectiveness of chloretone in recovering parasites, specimens of Scolopsis bilineatus were soaked in either chloretone (n=11) or in sea water (n=11) for 30 min and the parasites recovered compared (comparison 6). Fish were also scanned for remaining parasites. The parasites from the soak and the scan were summed and compared among treatments. Fish were collected, placed in bags, and soaked as described above. Both filtrates (200 and 57,um) were combined.. 14.
(32) CHAPTER II. SAMPLING ECTOPARASITES 2.3.9 STATISTICAL ANALYSES Differences in total numbers of parasites among species was tested with analysis of variance (ANOVA). The proportion of total parasites that fell off. Hemigynznus melapterus during transport in containers or in bags were tested for differences with a nonparametric ANOVA (Kruskal-Wallis test) as was the proportion of the two most abundant parasite categories. (Hatschekia. hemigymni and Gnathia spp.). The proportion of parasites that were removed with a rinse, the 200 tem filter (arcsine transformed), and by all treatments (vs scan) was tested for differences among species (Kruskal-Wallis test). Fish with no parasites were omitted from the above analyses. The same test was used to investigate whether the proportion of parasites removed by a rinse or by the 200 ,um filter differed among parasite categories. For the latter, only fish species with relatively large numbers of parasites were tested (Scolopsis bilineatus, Siganus. doliatus, and H. melapterus), using 3-4 of the most abundant parasite categories (see Fig. 2.5e-g, and Fig. 2.7e-g for parasite categories), and only individuals with the parasite category present. To examine the overall efficiency of chloretone, the proportion of total parasites (arcsine transformed) recovered with seawater and chloretone were tested for differences with a t-test analysis. To determine whether the species composition of parasites recovered by the soak differed among the two baths, the number of parasites per category were tested for differences using a multivariate analysis of variance (MANOVA). To test if the parasites recovered with a bath plus a scan were the same among baths, the total numbers of parasites per category from bath plus scan were tested for differences with a MANOVA. A canonical discriminant analysis (CDA) was used to discriminate among treatments when MANOVAs were significant. Data were natural log (x+1) transformed in the ANOVA and MANOVAs. The multivariate test statistic, Pillai's Trace, was used in the MANOVAs because it is more robust to heterogeneity of variance and is less likely to involve Type-I error than comparable tests (Green 1979). When the assumption of homogeneity of variance in the Kruskal-Wallis test (Maxwell and Delaney 1990) was violated, data were arcsine transformed.. 15.
(33) CHAPTER II. SAMPLING ECTOPARASITES 2.4 RESULTS The total numbers of ectoparasites per fish differed among the fish species (ANOVA F=10.12, df=6,27, p<0.001). Hemigymnus melapterus and. Siganus doliatus had the most parasites when expressed as numbers of parasites per fish and when adjusted for weight (Fig. 2.2). Two categories of parasite infestation were apparent, species such as Scolopsis bilineatus and especially H. melapterus and S. doliatus with relatively high parasite loads; and 4 species, Chlorurus sordidus, Thalassoma lunare, Ctenochaetus striatus, and. Acanthochromis polyacanthus with few parasites (Fig. 2.2). 2.4.1 FISH TRANSPORT Losses of parasites, mainly gnathiids, occurred in all transport comparisons (Fig. 2.3). The percent of total parasites that dropped off. Hemigymnus melapterus transported in containers (22.4% ± SE 11.4) and bags (20.5% ±SE 6.3) was not significantly different (Kruskal-Wallis test=0.121, p=0.728). The mean percent of parasites that dropped off Tbalassoma lunare transported in bags was 57.7% (±SE 11.8)(Fig. 2.3c). The proportion of parasites that dropped off fish was significantly different among transport methods for Hatschekia bemigymni (Kruskal-Wallis test=4.364, p=0.037) but not for Gnathia spp. (Kruskal-Wallis test=0.013, p=0.908). 2.4.2 RINSE VS. CHLORETONE A thorough rinse of the body surface and gills removed a large number of parasites from all 7 species, however additional parasites were recovered when fish were subsequently soaked in chloretone (Fig. 2.4). The number removed with the rinse differed due to differences in the total number of parasites among species, however the proportion of parasites removed with the rinse was not significantly different among fish species (Kruskal-Wallis test=10.22, p=0.116). Many different parasite categories were removed by the rinse (Fig. 2.5). Among abundant categories, the proportion of parasites. 16.
(34) CHAPTER II. SAMPLING ECTOPARASITES removed with a rinse was not significant different for Siganus doliatus (KruskalWallis test=3.91, p = 0.141), nor for Scolopsis bilineatus (ICruskal-Wallis Test=1.42, p=0.701), but was significantly different for Hemigymnus melapterus (Kruskal-Wallis Test=6.71, p=0.035) (See Fig. 2.5e-g for parasite categories tested). The parasites which were almost always completely removed with the rinse were all copepods. These consisted of unidentified Copepoda spp. (Fig. 2.5b, d-1), Caliginae spp. (Fig. 2.5b), Caligidae larvae (Fig. 2.5c, e, & I), nauplii (Fig. 2.5e-g), Acantbocolax sp. nov. and or Orbitacolax sp. nov. males (Fig. 2.5c, f, & g), and Orbitacolax sp. nov. (Fig. 2.5c, d, f, & g). Parasites removed with chloretone were often species found in gills such as unidentified flatworms (Fig. 2.5a, b, & e), Turbellaria (Fig. 2.5b, d, g), and Dactylogyridea spp. (Fig. 2.5e & t), or under scales (Transversotrema licinum) (Fig. 2.5b, t) and in epidermal pockets (Turbellaria) or were possibly internal parasites released post-mortem (unidentified Digenea spp., T.H. Cribb pers. comm.)(Fig. 2.5c, e, f, & g). Finally, a proportion of Gnatbia spp. remained after the rinse on most species, which was recovered only with the chloretone soak (Fig. 2.5a, c-g). 2.4.3 FILTER SIZE The smaller filter was easily blocked with mucus and debris and often required cleaning. However, additional filtering at 57 ,um revealed additional parasites for all species except Cblorurus sordidus (only the plastic bag contents were filtered for this species) (Fig. 2.6). Although some turbellarians (small parasites) were recovered by scanning on C. sordidus (Fig. 2.7d). The numbers removed by the large filter differed among fish species, however the proportion of total parasites removed by the large filter was not significantly different among fish species (Kruskal-Wallis Test=6.31, p=0.390). The proportion of parasites removed by the large filter was not significantly different among parasite categories for Siganus doliatus (ICruskal-Wallis Test=4.02, p=0.134), but was significantly different among parasite categories for Scolopsis bilineatus (Kruskal-Wallis Test = 15.58, p= <0.001) and for Hemigymnus melapterus 17.
(35) CHAPTER II. SAMPLING ECTOPARASITES. Table 2.3. The mean number of parasites remaining on fish (SE), found by scanning. fish under a stereo microscope, after fish were soaked in chloretonea. See Table 2.2 for definitions of parasite categories. Fish Species [sample size] C. striatus [5] A.polyacantbus[5] T lunare [5]. C. sordidus' [5] S. dollatus [5] S. bilineatus [4] H. melapterus [5]. UCop 0 1.20 (1.20) 0 0 0 0 0. Dact. TraL. UDig. 0 0 0 0 0 0 0 0 0.80 (0.80) 0 0 0.50 0 0. 1.20 0 0.20 0 1.00 (0.29) 0 12.60. Turb (1.20) (0.20). 0.20 0 0 0.20 (0.77) 0.20 0.75 (9.28) 2.80. UFIa (0.20). 0 0.60 (0.60) 0 (0.20) 0.20 (0.20) (0.20) 0.60 (0.40) (0.48) 1.25 (1.25) (2.33) 0. ' Cblorurus sordidus was not soaked in chloretone but scanned under microscope for parasites.. -.
(36) CHAPTER II. SAMPLING ECTOPARASITES (ICruskal-Wallis Test=7.52, p=0.023)(See Fig. 2.7e-g for parasite categories tested). The smallest parasites, copepod nauplii, 140-200 ,um in length, were mostly recovered with the small filter (Fig. 2.7e-g). A proportion of Turbellaria, usually less than 300 um in length with a diameter of 100 ,um, passed through the 200 Atm filter in all species (Fig. 2.7). The only categories that were always fully recovered with the 200 um filter were Orbitacolax sp. nov. (Fig. 6c-f),. Acanthocolax sp. nov. (Fig. 2.7f), and Caliginae spp. (Fig. 2.7b). These are relatively large parasites 710 um-2.5 mm in length. Many gnathiid isopods, which range from 280,um to 2.7 mm in length, were also recovered by the large filter (Fig. 2.7a, c-g). 2.4.4 REMOVED VS. REMAINING Although many parasites were removed by the process of rinsing and soaking the fish in anaesthetic, and by filtering all liquids with the 200 plus 57 ,um filters, a number of parasites remained on fish which were found by visual survey (Fig. 2.8). The proportion of parasites removed, however, was not significantly different among fish species (Kruskal-Wallis test=6.06, p=0.416). The parasites most commonly found remaining on the fish were unidentified Digenea spp., Turbellaria, and unidentified flatworms (Table 2.3). Copepoda were found only on Acanthochromis polyacanthus (Table 2.3) and these were gill copepoda from one fish. 2.4.5 CHLORETONE EFFICIENCY A chloretone bath removes many more parasites than does a seawater bath (Fig. 2.9). The percentage of total parasites recovered with a chloretone bath (88% ±SE 2.8) and with a seawater bath (37% ±SE 8.7) was significantly different (t=-5.52; df=20, p <0.001). The species composition of recovered parasites among treatments were different with the chloretone treatment characterised by many Transversotrema licinum and Anoplodiscus sp. and to a lesser degree by Dactylogyridea spp. (MANOVA Pillai's Trace=0.868, F=5.996, df=11,10, p=0.004). If all parasites not removed by a bath were recovered by. 18.
(37) CHAPTER II. SAMPLING ECTOPARASITES a scan then the species composition of all parasites collected (bath plus scan) should be the same. This was not the case as the species composition of all parasites (bath plus scan) was significantly different among treatments and was mainly due to more Anoplodiscus sp. being removed by the chloretone treatment and scan (MANOVA Pillai's Trace=0.872, F=6.193, df=11,10, p =0.004).. 2.5 DISCUSSION The study demonstrates that the method used to transport fish and remove ectoparasites can have a large influence on the numbers and species composition of recovered parasites. Two general categories of parasites are apparent: mobile crustaceans, which vacated their host on disturbance, and cryptic parasites which remained on host through most protocols but were recovered by the anaesthetic. Mobile parasites, particularly gnathiid isopods, which dropped off fish during transport of live and dead fish were recovered by retaining and filtering all transport liquids. It is likely that the stress of transport resulted in this loss. Several studies have shown that transporting (Aldrin et al. 1979, Specker and Schreck 1980, Pankhurst et al. 1991), handling (Pickering and Macey 1977, Pickering et al. 1982), and capture (Mazeaud et al. 1977, Perrier and Perrier 1978) of fish results in biochemical changes which are likely to be detected by parasites. Davies and Johnston (1976) found that the capture of a blenny with a handnet disturbed ectoparasites, including a gnathiid, and used anaesthetics to capture the fish and decrease gnathiid loss. Thus methods that maintain a low stress level during capture and handling of fish will likely result in lower parasite losses. The method described here lowers loss of parasites during capture by using a net with a small mesh which reduces entanglement of fish and thus abrasion of parasites. Handling time is decreased by using SCUBA, by capturing one fish at a time, and by placing fish into plastic bags as quickly as possible. Surprisingly, plastic bags have only occasionally been used to reduce parasite. 19.
(38) CHAPTER II. SAMPLING ECTOPARASITES losses (Hobson 1971, Losey 1974, Gorlick et al. 1987). Enclosure of fish in a bag and rinsing may be a useful method for recovering some types of mobile copepods as this method mainly removed copepods which have retained the ability to swim (Yamaguti 1963). However, if all parasites are sought, especially flatworms, an anaesthetic soak is more effective. Not only were more parasites recovered by the chloretone bath compared to the seawater bath, most importantly, a different species composition was obtained when the combination of anaesthetic bath and visual scan was used. The difference was due to recovery of fewer Anoplodiscus sp. in the seawater bath. However, Anoplodiscus sp. not recovered by the seawater bath were not detected in the subsequent scan. This suggests that some parasites may remain undetected when the traditional method of visual scanning is the only method used to recover parasites. Although there were no significant differences among fish species in the proportion of total parasites removed with the rinse, large filter, and by all treatments vs scan, there was some variation in the proportion removed in some parasite categories. In addition, many parasites categories were missed completely by the rinse and large filter. Thus parasite composition may be influenced during the stages of the parasite recovery process . Initially, a standard method which could be used for all species was sought. However, the general protocol was constrained by differences among species so the methods were modified slightly for some species. For one species with a high mucus load which blocked filters, filtration was minimised by scanning the whole fish and gills and filtering only the transport liquids. Chloretone did not recover all the gill copepods on one species so the gills were removed and examined separately. Using the comparisons as a guideline, the most efficient method for obtaining reliable estimates of the ectoparasites of the species investigated appears to be the following: fish are placed in plastic bags as quickly as possible, preferably underwater, and all liquids retained; for species with many gillinhabiting copepods, the gills are removed and fixed separately; after a soak in. 20.
(39) CHAPTER II. SAMPLING ECTOPARASITES anaesthetic, a subsample of fish should be scanned to check for accuracy; finally, although time consuming, all liquids should be filtered with a 57 µ m filter. This study differs from most other studies of this nature because it includes a wide range of ectoparasites and fish species, examines parasite losses at more than one sampling stage, and involves parasites of tropical fish. The benefit of this method over other methods is that it reduces field laboratory time because all parasites are removed from the fish and fixed; parasites can therefore be sorted and identified at a later date. The need for modifications suggests that either the method of parasite quantification must be extremely rigorous, or an optimal method must be identified for each species of interest. It is only then that reliable estimates of parasite loads will be obtained. The importance of using appropriate sampling techniques in the study of cleaning interactions is illustrated by the effect of methodology on gnathiids-parasites extremely important in cleaning interactions.. 21.
(40) CHAPTER II. SAMPLING ECTOPARASITES. Figure 2.1. Map of Lizard Island showing study sites.. 22.
(41) CHAPTER II. SAMPLING ECTOPARASITES. 300. 100. 35 30 25 20 15 10 5 0.0. 0. 0.5 1.0 1.5. S. do lia tus. me lap te rus. S. bi line a tus. sor di dus. A. p o ly ac an t hus. 2.0. Mean Num ber o fParas ites / We ig ht o fFis h (g ). Mean Num ber o f Para s ites / Fis h. 200 -. Species. Figure 2.2. The mean sum of the parasites removed with a chloretone bath plus parasites remaining on fish (±SE). The range in standard length (cm) of each species from left to right followed by the sample size is (8.9-9.2,5), (10.3-15.0,5), (9.4-15.5,5), (11.5-17.5,5), (11.0-15.5,4), (9.2-20.3,5), (14.6-18.3,5).. 23.
(42) ▪ CHAPTER II. SAMPLING ECTOPARASITES. Me an Number o fParas ites / Fis h. 150 100. EN. Container E23 Fish. a. 25 20 15 10 5 0 150 100 / 25 20 15 10 5 0 4-) as. ca, sa, o 0 cz5 u ou z 0. (15. 11111 Bag M Fish C. ta). czs. cd. Parasite Category. Figure 2.3. The mean number of parasites (±SE) found in the containment liquid (container or bag) compared to those on fish after transport. a. After Hemigymnus melapterus were held alive in container for 2 h, b. After H. melapterus were held dead in bag 2-10 h, c. After Thalassoma lunare were held dead in bag 2-10 h. Note Gnathia spp. were the most commonly lost parasites. See Table 2.2 for definitions of parasite categories. 24.
(43) Mean Num ber o f Paras ites / Fis h. CHAPTER II. SAMPLING ECTOPARASITES. 400 200 50 45. Rinse Chloretone •••■■■•••4 Gills * Scan **. (5). 40 35 30 25 20 15 10 5 0 CS (9.4-16.5). AP (6.6-9.2). TL (7.9-14.6). SS. SD. SB. HM. (9.2-17.0) (14.6-16.6) (9.3-15.5) (9.5-17.5). Species. Figure 2.4. The mean total number of parasites (±SE) removed with a seawater rinse compared with additional parasites recovered after a chloretone bath. Rinse includes contents of plastic bag. Sample size is above the mean. Parasites recovered separately from gills and by scanning are labelled separately. Legend for "gills" and "scan" apply only to species labelled with * or **. Fish species: CS= Ctenocbaetus striatus, AP= Acanthochromis polyacanthus, TL= Thalassoma lunare, SS= Cblorurus sordidus, SD= Siganus doliatus, SB= Scolopsis bilineatus, HM= Hemigymnus melapterus. The standard length range (cm) is below the fish species code, sample sizes are above means. 25.
(44) CHAPTER II. SAMPLING ECTOPARASITES. 5. C. striatus. a. Num ber o f Paras ites. 4—. 5. 5. A. poly** b. 4. C. sordidus 4. 4. 3. 3. 3. 2—. 2. 2. 0. 0 0 0 03. 0. 450 300. T. lunare. ;-■. 0 rs.. a. o --> 0 ci)0. S. bti/ineatus. f. *. 12. 45 40/H.. 9. YX*1.6.. Gills. *. 20. 25 6. 15. *-. 15 10. melapterus T *. WOW. 25. 20. A d. = ° O 0 co E-. 35 30. Scan Gills. 0. cd ■-•. e /15. S. doliatus I*. 3. MOW WX:wg. *. 3. 10. 5. 0. E. 0. co. -1 0. 0. 1-r; t. .7d c). -0. 5 C ) cme,. MI. Rinse. a.s. 0 0. 0 .4. —. 'jr1 OU 0 0,4 ZO ~ f. 01-,C21. Parasite Category. x Opp Ll.. c) c). o. t>, 1-f) t2,.0 0 0. cs. ,). F. :). Chloretone. Figure 2.5. The mean number of parasites (± SE) in each category removed with. a seawater rinse compared with additional parasites recovered after a chloretone bath. Parasites recovered separately in gills and by scanning are labelled separately. "Acanthochromis polyacanthus. See Table 2.2 for definitions of parasite categories. *Parasite categories tested for differences in the proportion removed with a rinse. 26.
(45) CHAPTER II. SAMPLING ECTOPARASITES. (/) r-T-1. 300 200 100. (1.). 45. til ctS ..4 cd C=1..,. 40. 4. `. 84. a.) ..0. =. 1.11 200m Filter 57m Filter ;: ■ , ;X :•: Vott68 Gills * Scan **. 11;. 35 30 25 20 15. Z. 10. 0:5 (1.). 5 0. * *. il. iiii. CS. k. AP. TL. SS. SD. SB. HM. Species. Figure 2.6. The mean total number of parasites (-± SE) removed first with a 200 ,um filter then an additional 57 ,um filter. Parasites recovered separately in gills and by scanning are labelled "scan" and "gills" and apply only to species labelled with * or **. CS= Ctenochaetus striatus, AP= Acanthochromis polyacanthus, TL= Thalassoma lunare, SS= Cblorurus sordidus, SS= Siganus doliatus, SB= Scolopsis bilineatus, HM= Hemigymnus melapterus.. 27.
(46) CHAPTER II. SAMPLING ECTOPARASITES. o f Paras ite s / Fis h. 5. C. striates. 5. . poly. a. C. sordtidus. T. lunare. 4. 4. 3. 3. 2. 2. t4.4.4.4.4. I. 1. 0. co C.). 300 150. O. an. z. 0. co. Cz. ,2. GO ,r). 15. S. doliatus j.1*. 7:$ -6'. BP. -2. a"-) CCIE-.. S. bilineatus. o. —1 a.. 0 r...). 40. f. 20. .t.11.0.0. 4. 0°<. Scan Gills. i i. o0 U c. Ll E—. 000. O :8. 1111 200m Filter. d. 4 4 Zvi 0. 0 A 0 a). atl. 0/. me/apterusi. 0 E. c z cc)oo.u Z. Q.*"a 9D A CO. c=1 E. d. M 57m Filter. Parasite Category. Figure 2.7. The mean number of parasites (± SE) in each category removed first with a 200 ,um filter then an additional 57 ,um filter. Parasites recovered separately in gills and by scanning are labelled separately. **Acanthochromis polyacanthus. See Table 2.2 for definitions of parasite categories. *Parasite categories tested for differences in the proportion recovered with the large filter. 28.
(47) CHAPTER II. SAMPLING ECTOPARASITES. 300 cn 200 Cx-I 100. MI Removed Mj Remaining. /. 40 7/1 cc5. 35. cd I:Li. 30 —. 0-1. 25. cD. 20 — 15. Z 10. a.). 5 —. 0 CS. AP. TL. SS*. SD. SB. HM. Species. Figure 2.8. The mean number of parasites (-±SE) removed with a chloretone bath compared with parasites remaining on fish after the chloretone bath. Remaining parasites were found by scanning fish under a microscope. CS= Ctenochaetus striatus, AP= Acanthochromis polyacanthus, TL= Thalassoma lunare, SS= Cblorurus sordidus, SS= Siganus doliatus, SB= Scolopsis bilineatus, HM= Hemigymnus melapterus. *Scanned under microscope rather than soaked in chloretone. 29.
(48) CHAPTER II. SAMPLING ECTOPARASITES. 20. By chloretone By seawater. 0. After chloretone After seawater. 5. 10. 15. O ;-4. O. 0. 0. o. 0. ro. 0 0 (11. .. a.. 20. Mean Num ber o f Par as i tes Rema in ing / Fis h. 0. 0. Parasite Category. Figure 2.9. The mean number of parasites ( -±SE) removed from and remaining. on Scolopsis bilineatus soaked in either 0.4% chloretone or seawater only. The mean standard length (cm) (SE) of chloretone soaked fish is 12.3 (0.7) and seawater soaked fish is 11.7 (0.7). See Table 2.2 for definitions of parasite categories. 30.
(49) CHAPTER III. SPATIAL AND TEMPORAL VARIATIONS OF THE ECTOPARASITES OF SEVEN REEF FISH SPECIES FROM LIZARD ISLAND AND HERON ISLAND. 3.1 SUMMARY The spatial and temporal variations in abundance of ectoparasites from seven coral reef fish species Hemigymnus melapterus, Siganus doliatus, Scolopsis bilineatus,. Thalassoma lunare, Cblorurus sordidus, Ctenochaetus striatus, and Acanthochromis polyacanthus at two locations, Lizard Island and Heron Island, were investigated. The study demonstrates that there is a significant species-specific parasite fauna which is conserved over space and time. Host identity explained most of the variation in parasite composition and abundance while host size explained a smaller proportion of the variation. For each species the parasite assemblage showed little variation among local, but physically varied, sites. Species specific patterns of parasite abundance were similar between widely separated locations although there were more categories of parasites at the northern location, Lizard Island. The abundance and species composition of parasites of seven fish species at Lizard Island did not vary among collection times except for S. doliatus which had a 7 fold increase between May 1992 and January 1993, mainly due to variation in the abundance of dactylogyridean monogeneans. Parasite abundance was positively correlated with fish standard length for 3 fish species.. 3.2 INTRODUCTION The numbers and species composition of marine ectoparasites vary both among fish species and within a fish species. Variation in parasites within a species can occur on a small spatial scale (Yeo and Spieler 1980) or on a large spatial scale latitudinally (Dogiel 1961, Polyanski 1961b, Rohde 1993). Parasites also vary seasonally (Kennedy 1975) and as a function of host size (Bortone et. al. 1978). These sources of variation can confound results and therefore must be considered in parasitological studies. Estimates of spatial variation are needed when designing sampling. 30.
(50) CHAPTER III: SPATIAL AND TEMPORAL VARIATION IN ECTOPARASITES programs in order to obtain reliable estimates of parasites. Before large scale spatial comparisons among locations can be made, estimates of small scale spatial variation among sites are needed to avoid confounding effects (Hurlbert 1984). Estimates of small scale variation are also important if fish collections are logistically constrained. For example, if some fish species are more easily collected at some sites than others, knowledge of the spatial variability among sites will determine whether sampling can be reduced to particular sites or combined among sites. Information on the temporal variability of parasites is needed to establish whether the parasite fauna observed is representative of the overall parasite fauna. Temporal variability in parasites can also affect factors influenced by parasites. For instance, the diet of cleaner fish or the cleaning behaviour of fish hosts could change if the parasite loads of fish change over time. Studies of temporal variation in fish parasites have been largely confined to cold temperate seas (Llewellyn 1959, Noble 1963, Kennedy 1975, Rawson 1976) with the few studies in the tropics restricted mostly to the parasites of snails (Rohde and Sandland 1973, Rohde 1981, Cannon 1978, 1979). The diversity of coral reef fishes found in the Great Barrier Reef is high (Randall et. al.. 1990). The diversity of monogenean parasites in the Great Barrier. Reef is almost certainly greater than that of fish species (Rohde 1977) and the number of parasite species at Heron Island alone have been estimated at 20,000 (Rohde 1977). If both parasite fauna and fish are diverse the potential for variability in the interactions between fish and parasites is high. Such questions require estimates of how parasites vary amongst species and the degree to which they are constant over space and time. Not only is this information relevant for this type of study but also for other parasitological work such as in fish stock discrimination (Lester et. al.. 1988) and evolution (Brooks and McLennon 1993).. Much parasitological work is observational or descriptive and thus tends to be non-quantitative (Sindermann 1986). This study is quantitative rather than qualitative with the emphasis placed on measuring the variability in numbers of parasites using broad categories of ectoparasites. The complete ectoparasite. 31.
(51) CHAPTER III: SPATIAL AND TEMPORAL VARIATION IN ECTOPARASITES faunas of seven relatively small fish species which are common on coral reefs of the Great Barrier Reef are quantified. The variations in ectoparasite numbers and species composition among fish species, sites, locations, and times of collection as well as the relationship between host size and parasite abundance were investigated. The species span a range of taxonomic and ecological relationships but are all common in shallow coral reef waters. 3.3 METHODS AND MATERIALS The fish species investigated are Hemzgymnus melapterus, Siganus. doliatus, Scolopsis bilineatus, Thalassoma lunare, Chlorurus sordidus, Ctenocbaetus striatus, and Acanthochromis polyacanthus. All species have different feeding habits and three (H. melapterus, T. lunare, C. sordidus) are taxonomically related and belong to the order Labroidei (sensu Greenwood et. al. 1966). A total of 304 fish were collected. 3.3.1 SAMPLING DESIGN Spatial variation was examined at two scales, within a reef system (Lizard Island) incorporating different habitats and between reef systems separated by 1000 km (Lizard Island and Heron Island)(Fig. 3. 1). Small scale variation was examined at 3 sites (1-5 km apart) located around Lizard Island which are in shallow coral reefs (2-7 m) and have different levels of wave exposure. Site 1 (North Point) is the most exposed, site 2 (Granite Bluff) is less exposed, and site 3 (Lagoon) is in a protected lagoon behind a small island and has little wave exposure. The differences among sites are reflected in the fish fauna (Choat and Bellwood 1985). Lizard Island is a continental island with fringing reefs while Heron Island is a coral cay with a large platform reef. The locations were selected because they represent reef systems at the extremes of the Great Barrier Reef, yet the species investigated are present at both reefs. Fish were collected at three times (seasons) from Lizard Island (May 1992, August 1992, and January 1993) and. 32.
(52) CHAPTER III: SPATIAL AND TEMPORAL VARIATION IN ECTOPARASITES once from Heron Island (June 1993).. 3.3.2 SITES To investigate the number and composition of parasites among fish species collected from different sites, 5-9 fish per site from 3 sites were collected from each species in May 1992. Specimens of approximately similar size were collected from within a species to reduce variation due to host size. 3.3.3 LOCATIONS The abundance and composition of assemblages of parasites on different fish collected at two locations was examined. The collections at Lizard Island (January 1993) were from the above 3 sites. The collections at Heron Island (June 1993) were from 2 sites on the reef slope (2-10 m in depth) located on opposite sides of the island (2 km apart). Between 5 and 9 specimens were collected from the above seven species at each location. Sites at each location were combined as the sample sizes of fish from each location were too small and unbalanced to test for differences among sites. 3.3.4 TIME The number of parasites per fish on Hemigymnus melapterus and. Thalassoma lunare were analysed for differences among 3 collection times (seasons) at Lizard Island (May 1992, August 1992, January 1993). The remaining 5 species were tested for differences in parasite numbers among two collection times (May 1992, January 1993). Only Hemigymnus melapterus and. Thalassoma lunare had sufficient sample sizes at each time to test for differences in parasite composition among times. To obtain sufficient degrees of freedom for a multivariate analysis of variance, the number of variables were reduced by selecting parasite categories (Table 3.1) that were present in 30% or more of the fish. This reduced the parasite categories from 7 to 2 for T. lunare (gnathiids and unidentified Digenea spp.) and from 12 to 7 in H. melapterus (gnathiids, Hatschekia henzzgymni, unidentified Digenea spp., Acanthocolax sp.. 33.
(53) CHAPTER III: SPATIAL AND TEMPORAL VARIATION IN ECTOPARASITES nov. and or Homobomolochus sp. nov. males, Caligidae larvae, Orbitacolax sp. nov., and Turbellaria. The reduced variables constituted 90.1% and 98.4% of the total parasites respectively. 3.3.5 FISH SIZE The relationship between total parasite numbers per fish and standard length was investigated for all species collected at Lizard Island using linear correlation. The sample size of fish was increased by using fish collected at different times. So that time did not confound results, only fish species that had no significant differences in total number of parasites among times were used. Outliers (total parasites of an individual fish) were tested (t-statistic) and omitted when p <0.05 (p corrected with Bonferroni's inequality). 3.3.6 STATISTICAL ANALYSES Separate multifactor analyses of covariance (ANCOVA) were used to test for differences in the total number of parasites among species and sites, and among species and locations with fish surface area as the covariable. For each species, a single factor ANCOVA was used to test for differences in the total number of parasites per fish among times using fish standard length as the covariable. The slopes were not significantly different (p<0.05) in all ANCOVAs so the interaction term was dropped. Separate multifactorial multivariate analyses of variance (MANOVA) were used to test for differences in the number of parasites per category among species and sites, and among species and locations; separate single factor MANOVAs was used to test for differences in the number of parasites per parasite category among times for each of the species Hemigymnus melapterus and Thalassoma lunare. All Transversotrema spp. at Heron Island were pooled to increase the degrees of freedom in the MANOVAs. The multivariate test statistic, Pillars Trace, was used in all MANOVAs because it is more robust to heterogeneity of variance and is less likely to involve Type-I error than comparable tests (Green 1979). To discriminate among species and sites, and. 34.
(54) CHAPTER III: SPATIAL AND TEMPORAL VARIATION IN ECTOPARASITES among species and locations a canonical discriminant analysis was used. To satisfy the assumptions of the statistical analyses performed, all data were natural log (x+ 1) transformed to achieve homogeneity of variance or linearity. Surface area was used as covariable when making comparisons among species while standard length was used as a covariable when making comparisons within a species. Surface area of all species was natural log transformed to achieve linearity as was the standard length of Hemigymnus melapterus. 3.3.7 CAPTURE OF FISH AND PARASITE COLLECTION Fish were collected and parasites quantified as described in Chapter II. All fish were immediately placed in a plastic bag upon capture, then soaked in anaesthetic, and all liquids filtered to remove parasites. Because the thick mucus produced by Cblorurus sordidus blocks filters, for C. sordidus collected in January 1993 and June 1993, the plastic bag contents were filtered, and the whole fish scanned under a stereo microscope (20X) for parasites. Although some parasites pass through the 200 pm filter, which are recovered with the 57 pm filter (Chapter II), the use of the 57 ,um filter is very time consuming as it quickly blocks with fish mucus. Therefore due to time constraints imposed by the large sample size the 200µm filter was used for the spatial (sites), temporal, and host size comparisons. An additional 57 ,um filter was used in January 1993 (Lizard Island) and June 1993 (Heron Island) therefore the location comparisons are based on parasites removed by both filters. Parasites were identified and placed into categories as described in Chapter II. Not all parasites were identified to species as the study was designed as a quantitative study rather than a qualitative study with the emphasis placed on estimating the spatial and temporal variability of ectoparasites. A large sample size was required, thus it was beyond the scope of this study to identify parasites that were found only 1-2 times during the study. In addition, the multivariate tests could not be carried out with numerous variables (parasite species) due to insufficient degrees of freedom nor with variables which 35.
Figure


+7


Related documents
Sister species of fig parasites often attack the same host in sympatry, and differ- ences in ovipositor length suggest that parasite speciation could result from divergence in
Parasite-augmented mate choice as an extended phenotype Parasites change host behavior in a multitude of ways, and not all of these are behavioral manipulation by the parasite.. Some
Regulation of Parasite Gene Expression Understanding how parasites regulate gene expression throughout their life cycle within a host is necessary in order to fully appreciate the
gibelio could be considered as their pre- ferred host ( Š imková et al. [5] suggested that even a gener- alist parasite may prefer some host species within its host range) The
(2) discriminate fishes into feeding guilds based on their preferential prey items; (3) examine the potential connection between diet and the parasite fauna among
Shop magma usa boat marine 20-in baitfilet mate fish cleaning cutting table board a mount both the fishing equipment section of Lowescom.. Folds up any style block cookies
The number of parasitized fish, number of parasites collected, prevalence, intensity and abundance of the parasite in different fish species are presented in
During this study monogenean parasites were collected from a total of 831 hosts specimens of as many as 14 different fish species (Table 2). TABLE 2 Host/parasite checklist
