doi:10.1152/ajpendo.00044.2004
287:E1090-E1099, 2004. First published 31 August 2004; Am J Physiol Endocrinol Metab
Wikstrom, B. E. Corkey, P. J. S. Smith and O. S. Shirihai
S. M. Katzman, M. A. Messerli, D. T. Barry, A. Grossman, T. Harel, J. D.
Psammomys obesus
and diabetic
normal
architecture in intact islets of Langerhans from
Mitochondrial metabolism reveals a functional
You might find this additional info useful...
47 articles, 26 of which can be accessed free at:
This article cites
http://ajpendo.physiology.org/content/287/6/E1090.full.html#ref-list-1
including high resolution figures, can be found at:
Updated information and services
http://ajpendo.physiology.org/content/287/6/E1090.full.html
can be found at: AJP - Endocrinology and Metabolism
about
Additional material and information
http://www.the-aps.org/publications/ajpendo
This infomation is current as of May 27, 2011.
20814-3991. Copyright © 2004 by the American Physiological Society. ISSN: 0193-1849, ESSN: 1522-1555. Visit our website at organization. It is published 12 times a year (monthly) by the American Physiological Society, 9650 Rockville Pike, Bethesda MD
publishes results of original studies about endocrine and metabolic systems on any level of AJP - Endocrinology and Metabolism
on May 27, 2011
ajpendo.physiology.org
Mitochondrial metabolism reveals a functional architecture in intact islets
of Langerhans from normal and diabetic
Psammomys obesus
S. M. Katzman,1,2M. A. Messerli,2D. T. Barry,3A. Grossman,4T. Harel,4
J. D. Wikstrom,1,2B. E. Corkey,5P. J. S. Smith,2and O. S. Shirihai1,2
1Department of Pharmacology and Experimental Therapeutics, Tufts University School of Medicine, Boston 02111;
2BioCurrents Research Center, Marine Biological Laboratory, Woods Hole, Massachusetts 02543;3National Aeronautics and
Space Administration, Washington, District of Columbia 20546;4Impulse Dynamics, Tirat Hacarmel, 39120 Israel; and 5Obesity Research Center, Department of Medicine, Boston University School of Medicine, Boston, Massachusetts 02118
Submitted 29 January 2004; accepted in final form 6 August 2004
Katzman, S. M., M. A. Messerli, D. T. Barry, A. Grossman, T. Harel, J. D. Wikstrom, B. E. Corkey, P. J. S. Smith, and O. S. Shirihai.Mitochondrial metabolism reveals a functional architecture in intact islets of Langerhans from normal and diabeticPsammomys obesus. Am J Physiol Endocrinol Metab287: E1090 –E1099, 2004; doi:10.1152/ajpendo.00044.2004.—The cells within the intact islet of Langerhans function as a metabolic syncytium, secreting insulin in a coordinated and oscillatory manner in response to external fuel. With increased glucose, the oscillatory amplitude is enhanced, leading to the hypothesis that cells within the islet are secreting with greater synchronization. Consequently, non-insulin-dependent diabetes mel-litus (NIDDM; type 2 diabetes)-induced irregularities in insulin se-cretion oscillations may be attributed to decreased intercellular coor-dination. The purpose of the present study was to determine whether the degree of metabolic coordination within the intact islet was enhanced by increased glucose and compromised by NIDDM. Exper-iments were performed with isolated islets from normal and diabetic
Psammomys obesus. Using confocal microscopy and the mitochon-drial potentiometric dye rhodamine 123, we measured mitochonmitochon-drial membrane potential oscillations in individual cells within intact islets. When mitochondrial membrane potential was averaged from all the cells in a single islet, the resultant waveform demonstrated clear sinusoidal oscillations. Cells within islets were heterogeneous in terms of cellular synchronicity (similarity in phase and period), sinusoidal regularity, and frequency of oscillation. Cells within normal islets oscillated with greater synchronicity compared with cells within diabetic islets. The range of oscillatory frequencies was unchanged by glucose or diabetes. Cells within diabetic (but not normal) islets increased oscillatory regularity in response to glucose. These data support the hypothesis that glucose enhances metabolic coupling in normal islets and that the dampening of oscillatory insulin secretion in NIDDM may result from disrupted metabolic coupling.
diabetes; metabolic oscillations; mitochondrial membrane potential; rhodamine 123
THE ONSET OF non-insulin-dependent diabetes mellitus
(NIDDM; type 2 diabetes) is accompanied initially by the loss of the first phase of insulin secretion and then by the transition of second-phase oscillatory secretion to irregular pulsatory secretion (21). Normal oscillations are critical for efficient insulin-mediated glucose uptake at the peripheral tissues (27, 32), where loss of oscillatory secretion may lead to insulin resistance in diabetic and prediabetic patients (1). Oscillations
in blood insulin levels are thought to result from the intrinsic insulin secretion pulsatility of the -cells in the pancreatic islets of Langerhans. Fuels such as glucose are processed by
-cells to produce metabolic signals for insulin release (39); thus it is generally assumed that intrinsic oscillations in insulin secretion result from oscillating metabolism (46). Metabolic oscillations in oxygen consumption (25) have been measured in intact islets and dissociated-cells; oscillation periods range between 3 and 5 min, similar to cytosolic calcium and insulin secretion from isolated islets (25).
In response to increasing glucose concentration, insulin secretion oscillations have been found to increase in amplitude but not in frequency (5). This increase in amplitude could result from1) greater secretion from already-active-cells,2) a recruitment of additional-cells into active secretion, 3) an increase in oscillatory synchronicity, or4) a combination of the above factors. Data demonstrating that -cells in clusters secrete insulin in response to glucose more effectively than dispersed-cells (17) led us to hypothesize that islet intercel-lular metabolic coordination may play a key role in the glucose response. Recent data by Ravier et al. (40) support this hy-pothesis by demonstrating thatob/obmouse islets (islets with an impaired glucose response) have asynchronous cytosolic calcium oscillations. Therefore, we would also expect to find a decreased metabolic synchronicity in islets from diabetic ani-mals.
The Israeli sand rat (Psammomys obesus) has been widely used as a model for human NIDDM, because the etiology of NIDDM inP. obesusis similar to its manifestation in humans. With a high-energy diet,P. obesusbecomes hyperinsulinemic, then hyperglycemic, followed by a marked decline in -cell function and apoptosis (9). The final stages of diabetes are irreversible (16), and, if the animal is not treated with exoge-nous insulin, it will eventually die after ketosis (18). Electro-physiological studies comparing islets from mice, rats, andP. obesus were reported by Palti et al. (31). Using a suction electrode, Palti et al. monitored membrane potential in the intact islet and demonstrated thatP. obesusshows a glucose-stimulated oscillatory response similar to that seen in the rat and mouse (31). In the present study, we used isolated islets from this rodent model to address the question of heterogeneity in metabolic oscillations in the context of the intact islet and in response to diabetes.
Address for reprint requests and other correspondence: O. Shirihai, Dept. of Pharmacology, Tufts Univ. School of Medicine, Boston, MA 02111 (E-mail: orian.shirihai@tufts.edu).
The costs of publication of this article were defrayed in part by the payment of page charges. The article must therefore be hereby marked “advertisement” in accordance with 18 U.S.C. Section 1734 solely to indicate this fact.
Am J Physiol Endocrinol Metab287: E1090 –E1099, 2004; doi:10.1152/ajpendo.00044.2004.
http://www.ajpendo.org E1090
on May 27, 2011
ajpendo.physiology.org
To quantify metabolic heterogeneity, we recorded oscilla-tions in mitochondrial membrane potential from individual cells within intact islets. Mitochondria play an essential role in glucose-stimulated insulin secretion (GSIS) by producing a major coupling messenger for insulin secretion, the ATP-to-ADP (ATP/ATP-to-ADP) ratio (reviewed in Ref. 26). Recent studies provide increasing evidence for the role of mitochondrial metabolic oscillation as an essential regulator of insulin secre-tion through the producsecre-tion of metabolic cofactors such as pyridine nucleotides (13). Changes in mitochondrial membrane potential (an indicator of ATP/ADP ratio flux) can be measured easily in the intact islet with the use of the highly permeable, potentiometric dye rhodamine 123 (Rh123). This technique provides an excellent tool by which to monitor oscillatory metabolism in the-cell (19). Studies have shown that this dye does not track plasma membrane potential (10). We tested the following hypotheses:1) that mitochondrial metabolic oscilla-tions can be recorded in individual cells within intact islets and that this oscillatory behavior is heterogeneous, responding to increased glucose concentration with greater synchronicity;2) that the diabetic P. obesus islets would exhibit disrupted metabolic intercellular coordination commensurate with com-promised insulin secretion (9); and3) that heterogeneity would be altered with respect to oscillation signal parameters (fre-quency, regularity, or synchronicity) in response to increased glucose and diabetic status.
MATERIALS AND METHODS
Animals.Both diabetic and nondiabeticP. obesuswere obtained from the Food and Drug Administration colony (Washington, DC). The animals were maintained under controlled conditions: a constant temperature (19 –22°C) and a 14:10-h light-dark cycle. Diabetic status was determined through measurements of blood glucose levels (⬎150 mg/dl; LifeScan, Milpitas, CA) and glycosylated hemoglobin (⬎7%; Petnostics, Palm City, FL). Diabetic animals were maintained on a high-energy diet (Harlan Teklad, Indianapolis, IN) with food placed (ad libitum) inside the cage of the diabetic animals to discourage exercise.
Isolation and preparation of islets.Animals were anesthetized with Halothane (3–5 min as an inhalant) and then euthanized with pento-barbital sodium (40 mg/ml ip). All procedures were performed in accordance with the Institutional Guidelines for Animal Care at the Marine Biological Laboratory in Woods Hole, MA (IACUC no. 2003-46), in compliance with United States Public Health Service regulations. Pancreatic islets of Langerhans were isolated by mincing the pancreata, followed by collagenase digestion and hand picking as described previously in Lacy and Kostianovsky (20). After isolation, islets were maintained in RPMI 1640 with 6 mM glucose overnight before imaging. Studies have shown that preincubation in low glucose concentrations does not restore normal function to islets of diabeticP. obesus(3, 29, 33).
Confocal microscopy experiments. Mitochondrial membrane po-tential was measured using the potentiometric dye Rh123 (Molecular Probes, Eugene, OR) loaded at a final concentration of 13M. This concentration of dye is not harmful to the cells; in studies of isolated -cells, exposure of cells to a high concentration of Rh123 (32M) had no effect on cell electrical activity (19). An alternate dye, tetramethylrhodamine ethyl ester (TMRE; 1M), was also tested but was not as permeable as Rh123 and only stained the outer islet cells. Islets were incubated with Rh123 for 30 min in 6 mM glucose-RPMI 1640 medium, washed with 6 mM glucose-RPMI 1640, and then transferred to a poly-D-lysine-coated, glass-bottomed dish (MatTek,
Ashland, MA) and placed on the heated and gas-equilibrated (37°C, 95% air-5% CO2) microscope stage (Carl Zeiss, Oberkochen,
Ger-many). Time-lapse images were recorded every 15 or 30 s for a total duration of 30 min at each glucose concentration in 2 ml of RPMI. Rh123 fluorescence was excited using the 488-nm line of a krypton-argon laser (Carl Zeiss) at low intensity to reduce phototoxicity. Phototoxicity was characterized by bleaching-related damage to mi-tochondria such as mimi-tochondrial membrane potential flickering and dissipation of the dye from the organelle. Emitted light was detected with the use of a band-pass 500- to 550-nm filter.
For all imaging we used a Zeiss LSM 510 confocal microscope and a Zeiss Plan-APOCHROMAT⫻63 oil immersion objective focused ⬃50 – 60m below the surface of the islet. The pinhole was set to give a confocal section thickness of no greater than 1m. Confocal images were analyzed using MetaMorph software (Universal Imag-ing, Downington, PA). Regions of interest were drawn around all identifiable cells (cells with mitochondrial staining and a distinct cell boundary) within the plane of focus, and fluorescent intensity was measured for each image frame. Each image frame was examined to adjust the regions of interest for slight movements in cellular location. Traces with large abrupt excursions in fluorescence intensity were eliminated from the analysis. Matlab (The Mathworks, Natick, MA) was used for the analysis of Rh123 time-lapse fluorescence record-ings. To reduce noise the data were band passed with a 10th-order zero-phase finite impulse response filter. This filter retains frequencies with periods between 2 and 15 min; this is within the range of metabolic oscillation frequencies reported previously. Because the amplitude of the signal could have been influenced by the amount of dye penetration and the focal plane of the cell, we normalized the amplitude from each cell by subtracting the mean and then dividing by the standard deviation of the signal.
Oscillation analysis. To determine1) whether the mitochondrial membrane potential of a cell is oscillating and2) the closeness of the waveform to a perfect sinusoidal waveform of the same frequency, we generated a measure of “regularity.” Given that an oscillating cell has a dominant frequency, the extent to which this waveform can be fitted to a perfect sinusoid of the appropriate dominant frequency is deter-mined as the regularity of the cell. Every waveform can be represented as a combination of sinusoidal waves with different weight. Extracting a sinusoidal component in each waveform enabled the application of mathematical tools to learn about frequency, regularity, and synchro-nicity. This is preferable, since the deviations from sinusoidal shape were not consistent from cell to cell, and the sinusoidal functions provide straightforward analysis of frequency and phase relationships. However, there were some distortions to the sinusoidal shape, and Fourier transformation typically revealed several harmonics. Recog-nizing that the waveforms were not perfect sinusoids, we did not directly use the largest Fourier amplitude to determine the frequency and phase parameters. Instead, we examined sinusoids representing the three largest Fourier amplitudes of the raw data and selected one sinusoid that best cross-correlated with the raw data. The specific technique is as follows. To determine the best-fit frequency and phase for each cell, the data were first autocorrelated to extract regular-period oscillations and smooth out irregularities and single-point deviations (noise); then, the autocorrelations were Fourier trans-formed. Three frequencies with the largest Fourier amplitudes were selected and used to generate sinusoids. The sinusoids were matched to the data and cross-correlated with the data trace. The matched sinusoids were presented overlaid on the data for visual inspection to avoid selecting a sinusoid that matched an obvious artifact. If there was no obvious artifact, then the sinusoid with the largest cross-correlation value was selected, and the frequency and phase parame-ters of each cell were thus determined.
We evaluated the regularity of the signal using approximate en-tropy and sample enen-tropy (35, 41) as well as the value of the cross-correlation coefficient with the best-fit sinusoid, as described above. Because the number of data points for each cell was in the range of only 60 –120, we expected the bias induced by self matches to distort the approximate entropy values toward zero. Sample entropy
on May 27, 2011
ajpendo.physiology.org
excludes self matches and is thus better suited to data with small numbers of sample points.
To characterize the synchronicity of the various waveforms within an islet, we used maximum absolute values of the cross-correlation coefficients. Specifically, for each cell in the islet, we calculated the maximum absolute value cross-correlation coefficient over all lags (i.e., the largest coefficient obtained when allowing the waveforms to shift in time to find the best possible phase match before cross-correlating) to every other cell in the islet. The maximum coefficient measures waveform similarity without regard to phase relationships. If the maximum coefficient values are low, then the waveforms are not similar and it will be difficult or impossible to characterize phase relationships in that population. To check whether the phases of the cells were similar, we calculated the absolute value of cross-correla-tion coefficient at zero lag (no time shifts) for each cell with every other cell in the islet. A high value implied that the phase relationship was close to either 0° or 180°. Note the importance of using the absolute value of the correlation coefficient in this step. For example, consider a hypothetical case where one-half of the cells have 0° phase relationship and one-half are 180° out of phase. Using just the correlation coefficient would generate an average coefficient of zero (one-half ones and one-half negative ones), missing an important relationship.
Alternative methods to assess relationships within a population are cross-approximate entropy and cross-sample entropy (35, 41). We used these measures to compare the correlation techniques.
Additional phase analysis was carried out by generating a sinusoid with the most common frequency (as determined by Fourier trans-form) of a group of cells and then running a maximal cross-correlation analysis to determine the phase relationships. The resulting centroid demonstrated the degree of phase coupling among the cells (a centroid value of⬎0.5 indicates that a significant coupling exists).
Statistical analysis.JMP (SAS Institute, Cary, NC) was used for statistical analysis. Data are given as means ⫾ SE. Two-tailed, unpaired, or paired Student’st-tests were used to compare islets at two glucose concentrations. Data analyzed as a percentage were normal-ized through arc sine transformation before statistical analysis (50).
P⬍0.05 was considered significant.
Materials.Unless otherwise indicated, all reagents were obtained from Sigma Chemical (St. Louis, MO). Oligomycin (a mixture of oligomycin A, B, and C) was first dissolved in dimethyl sulfoxide
(DMSO) and then diluted to 1:1,000 with buffer. The final concen-tration of DMSO did not exceed 0.1%, and the same concenconcen-tration of DMSO was added to controls.
RESULTS
Rh123 staining and fluorescence recordings.Rh123 staining revealed thorough and even penetration of the dye to at least 60
m depth in all islets (Fig. 1). We determined that Rh123 could be used at a concentration of 12 M to specifically stain mitochondria in living cells (14) (Fig. 1). Analysis of the stained islets revealed that staining was stable for at least 90 min, with no noticeable photobleaching under conditions where the 488-nm excitation wavelength did not exceed 0.05% of the 30-mW laser capacity. We used Rh123 as a measure of cell viability (because nonviable cells do not have distinct mitochondrial staining); a comparison of images from normal and diabetic islets demonstrated a decrease in viable -cell numbers associated with diabetes inP. obesus(this observation has been previously demonstrated using histological methods; Ref. 22) (Fig. 1). The average number of cells with distinct mitochondrial staining (we observed some rare cells with diffuse staining; these cells were not used for oscillation measurements) in the islet of a normal rat was 97⫾ 21 cells (n⫽12) and in the diabetic sand rat was 71⫾17 cells (n⫽ 11). The number of these cells did not differ significantly between 6 and 12 mM glucose for either the normal or the diabetic islets (P⬎0.05).
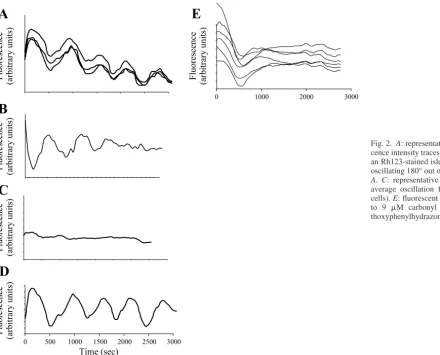
Fluorescence intensity traces from individual cells in each intact islet were plotted over time, demonstrating distinctive oscillations in whole cell averaged mitochondrial membrane potential. Oscillations from individual cells in a single islet were heterogeneous in terms of phase, period, and waveform (Fig. 2,AandB) in the diabetic and normal animals at 6 and 12 mM glucose. Although the majority of cells demonstrated distinct oscillations, some cells did not oscillate (Fig. 2C). The average unprocessed signal (of all individual cells) was oscil-latory (Fig. 2D).
Fig. 1. Representative rhodamine 123 (Rh123)-stained confocal images of diabetic (n⫽12) and normal (n⫽11) islets.Bottom: mitochondria-specific staining.
E1092 DIABETIC ISLET MITOCHONDRIAL OSCILLATIONS
AJP-Endocrinol Metab•VOL 287 • DECEMBER 2004 •www.ajpendo.org
on May 27, 2011
ajpendo.physiology.org
To ensure that the oscillations we were measuring were mitochondrial in origin, we treated the islets (n⫽3) with either oligomycin (at 2.5g/ml), an inhibitor of mitochondrial ATP synthase, or carbonyl cyanide p-trifluoromethoxyphenylhydra-zone (FCCP; at 9M), which collapses the membrane poten-tial by increasing the mitochondrial inner membrane perme-ability to protons. Oligomycin and FCCP both eliminated Rh123 fluorescence oscillations (FCCP data shown in Fig. 2E). Regularity. We determined the degree of oscillatory regu-larity for mitochondrial membrane potential from each cell in every islet. Regularity was defined as the similarity between the oscillating waveform and a regular sinusoidal waveform and calculated as the cross-correlation of the time-lapse fluo-rescence recording from each cell with its best-fit sinusoidal wave (as determined by Fourier transform analysis). In addi-tion, we compared our methods for calculating regularity with sample entropy and approximate entropy methods.
When we compared diabetic islets with normal islets, we found that the degree of oscillatory regularity was not signif-icantly different (P⬎ 0.05). To compare the glucose respon-siveness of normal and diabetic islets, we calculated the mean change in regularity between 6 and 12 mM glucose for each islet (the same islet at 6 and 12 mM glucose) and then averaged this number for both treatment groups. When we analyzed only the cells that were oscillating (cells with a regularity value
⬎0.5, a point of visual delimitation between oscillating and nonoscillating cells), both the regularity and the sample
en-tropy analyses showed that diabetic islets increased regularity in response to glucose significantly more than the normal islets (Fig. 3A;P⬍0.05).
Additionally, the percentage of cells with a regularity value
[image:5.612.50.491.69.424.2]⬎0.5 increased significantly with glucose in the diabetic islets (from 55% at 6 mM glucose to 62% at 12 mM glucose; P⬍ 0.05) but not in the normal islets (66.9% at 6 mM and 57.8% at 12 mM;P⬎0.05) (when all the cells in the islet were used in this analysis, there was no significant difference between the responses of the normal and diabetic islets). Further analyses were carried out to determine whether there was a specific regularity range that characterized a subpopulation of glucose-responsive cells. The regularity data was binned into catego-ries: nonoscillating cells (regularity values⬍0.45), cells with low-regularity values (0.45– 0.56), cells with midregularity values (0.56 – 0.71), and cells with high-regularity values (0.78 – 0.86). The percentage of cells in the nonoscillating category as well as the low- and the high-regularity categories did not significantly change with increased glucose for normal or diabetic islets (P ⬎ 0.05; Fig. 3B). In the midregularity category, the number of cells increased significantly more in the diabetic islets compared with the normal islets (P⬍0.05; Fig. 3B). These changes could not be explained by an increase in the number of analyzable cells (cells with distinct mitochon-drial staining), as there was no relationship between the num-ber of analyzable cells in a given islet and the regularity of that islet.
Fig. 2. A: representative selection of fluores-cence intensity traces from 3 different cells in an Rh123-stained islet.B: representative cell oscillating 180° out of phase with the cells in
A. C: representative nonoscillating cell.D: average oscillation from a single islet (81 cells).E: fluorescent trace from cell exposed to 9 M carbonyl cyanide p -trifluorome-thoxyphenylhydrazone.
on May 27, 2011
ajpendo.physiology.org
[image:5.612.44.241.72.420.2]Synchronicity.The intercellular synchronicity value, a mea-sure of the degree of synchronicity of each cell with all other cells in the same islet, was determined for each cell in each islet. Synchronicity was calculated by cross-correlating the fluorescence intensity traces of each cell with all other cells to find the degree of similarity in the waveforms without the assumption of a sinusoidal waveform. Additional related mea-sures of synchronicity included absolute and maximal cross-correlation as well as cross-sample and cross-approximate entropy. The synchronicity values for all cells in each islet were averaged to calculate an average synchronicity value for each islet. Synchronicity values were then averaged for all islets in each treatment group.
Normal islets had a higher synchronicity compared with diabetic islets at both concentrations of glucose (Fig. 4A). This was true for synchronicity in terms of cross-correlation, abso-lute cross-correlation, and maximum cross-correlation.
We calculated the mean change in synchronicity between 6 and 12 mM glucose for each islet (the same islet at 6 and 12 mM glucose) and then averaged this number for normal and for diabetic islets (this method allowed us to control for inter-islet variation and to show the synchronicity response to an increase in glucose). In this analysis, we eliminated cells with low-regularity values (cells that were not oscillating or cells with highly irregular oscillations). Analysis of oscillating cells in each islet showed that diabetic islets increased synchronicity significantly more than normal islets in response to glucose (demonstrated by both correlation analysis and
cross-sample entropy; Fig. 4B). The difference between normal and diabetic islets was not significant in terms of absolute (P⫽0.6) or maximum (P ⫽ 0.7) cross-correlation, indicating that the response to glucose may be largely due to phase shifts.
When all the cells in the islet were used in this analysis, there was no significant difference between the diabetic and normal islets in terms of glucose response according to all cross-correlation analyses [although the cross-sample entropy analysis showed that diabetic islets had a slightly larger glu-cose-induced increase in synchronicity than the normal islets (P⫽ 0.04)].
Within the normal islets, one-third had a distinctive popu-lation of cells oscillating with a very high regularity (⬎0.7; Fig. 5A). In each of these islets, the high-regularity cells oscillated with a singular frequency (Fig. 5B), which differed from islet to islet (range 3.9- to 6-min period; Table 1) and changed with glucose concentration. The high centroid value (0.5) from the phase analysis (Fig. 5C) demonstrated that these cells had highly coupled phase relationships. The distribution of highly regular cells (plot not shown) appeared to be scat-tered rather than localized at a given location in the focal plane. We compared topographical distributions of synchronicity for the cells in each islet. Visual inspection of these maps indicated that the synchronicity level for an individual cell was not clearly related to its position within the image plane. Clusters of cells with high synchronicity were not readily distinguishable. When normal islets were compared at 6 and 12
Fig. 4. Data are means⫾SE presented in arbitrary units (a.u.).A: absolute cross-correlation values for normal (N) islets (n⫽10) at 6 mM glucose (N6) and 12 mM glucose (N12) and diabetic (D) islets (n⫽6) at 6 mM glucose (D6) and 12 mM glucose (D12). Unpairedt-tests were used to compare N6 with D6 (P⬍0.05) and N12 with D12 (P⫽0.07).B: changes in cross-correlation values in response to glucose for normal and diabetic islets (values for each islet at 12 mM/6 mM glucose;n⫽10 for N,n⫽6 for D;P⬍0.001, unpaired
[image:6.612.44.296.72.307.2]t-test). Although inAneither treatment group appears to respond to glucose, the data presented inBshow a distinct increase in response to glucose. This discrepancy can be explained by the decreased variability in the data presented inB. InBwe measured the glucose response of individual islets at high and low glucose, whereas inAdata were pooled from each treatment to compare islet behavior at each glucose concentration. *Significant differences. Fig. 3. Bars represent average regularity change in islets exposed to an
increase in glucose (6 –12 mM; normal,n⫽9; diabetic,n⫽7–9).A: analysis of oscillating cells (regularity and sample entropy analysis methods) showed diabetic islets increasing regularity more than normal islets in response to glucose increase (6 –12 mM).B: regularity change between 6 and 12 mM glucose for nonoscillating and low-, medium-, and high-regularity oscillating cells. The difference is calculated as %change of the total no. of cells in each regularity bin⫾SE. An increase in “%cells” indicates a recruitment of more cells to a specified regularity resulting from an increase in glucose. With increased glucose, the %cells in diabetic islets oscillating with midregularity increases significantly more than in normal islets. *P⬍0.05.
E1094 DIABETIC ISLET MITOCHONDRIAL OSCILLATIONS
AJP-Endocrinol Metab•VOL 287 • DECEMBER 2004 •www.ajpendo.org
on May 27, 2011
ajpendo.physiology.org
[image:6.612.309.562.391.617.2]mM glucose, it became apparent that some cells shifted in their respective synchronicity ranking in response to increased glu-cose concentration (3 islets examined). Shifting occurred irre-spective of the cell’s location in the image plane (data not shown).
Periodicity. The phase of the period was determined by cross-correlating the best-fit sinusoidal waveform (as deter-mined by Fourier transform) with the filtered data. Cells with regularity values⬍0.45 were considered “nonoscillators” and were not included in the analysis. The value “0.45” was determined both through visual assessment of the fluorescent traces and by the resolution of our frequency analysis program, which could not accurately detect periods of regularity values
⬍0.45.
Islets from all treatment groups were heterogeneous in terms of periods from individual cells. The period distribution for normal (Fig. 6A) and diabetic (Fig. 6B) at each glucose con-centration was plotted for comparison. The period distribution for islets at 6 mM glucose appeared to be shifted slightly toward the higher periods compared with the distribution for the islets at 12 mM glucose. In general, the distribution of
periods occurring in the normal islets was narrower compared with the distribution in the diabetic islets, but this difference was not significant. No correlation existed between period or variability of the period (measured as standard deviation) and average intercellular synchronicity. The peaks of period distri-bution (normal at 6 mM, 3.2– 4.2 min; normal at 12 mM, 3–5.5 min; and diabetic at 6 and 12 mM, 2.5- to 5-min oscillations) corresponded well to previously measured frequencies of in-sulin secretion (25).
The periods for each islet were plotted according to location in the image plane (n⫽ 3). Visual inspection of these maps indicated that cells shift period when glucose concentration is increased. The distribution of cells either oscillating at a given period or shifting from one period to another appeared to be scattered rather than clustered within a given location in the focal plane.
DISCUSSION
[image:7.612.46.407.62.374.2]In normal intact pancreatic islets,-cells behave as a func-tional syncytium to maintain oscillatory insulin secretion (36) in response to increasing glucose. These oscillations in insulin secretion are thought to result from coordinated oscillations in fuel metabolism in the -cell. Fluctuations in mitochondrial membrane potential reveal the highly regulated balance be-tween hyperpolarizing factors such as the electron transport chain and depolarizing elements such as ATP synthase and uncoupling proteins such as UCP2. Measurements of mito-chondrial membrane potential oscillations may also reflect upstream oscillations in glycolysis, thereby allowing an overall analysis of intercellular metabolic coordination in the intact islet. Because diabetic pathology is associated with irregular Fig. 5. A: representative distribution from a single islet with a group of cells oscillating with high (0.7) regularity. Points represent the total %cells oscillating with a given binned regularity.B: scatter plot of all cells within an islet containing high-regularity cells. High-regularity cells oscillate with a singular period. “Regularity value” is repre-sented as arbitrary units.C: phase analysis of oscillatory phase using only high-regularity cells from a single islet at 6 mM glucose. The periphery of the circle is labeled with oscillatory phases (0 –360°). Circumferential points represent single cells. The centroid (䊐) represents a balance point connecting all cells. The centroid value (⬎0.5) demon-strates that the cells have a high coupling coefficient.
Table 1. Oscillation periods for high-regularity cells in 3 islets
Islet 6 mM Glucose 12 mM Glucose
1 4.2 3.9
2 6 5
3 3.9 4.5
Oscillation periods (in min) for high-regularity cells in 3 islets at 6 and 12 mM glucose.
on May 27, 2011
ajpendo.physiology.org
[image:7.612.45.297.666.718.2]insulin secretion oscillations (reviewed in Ref. 4) and because it is known that functional coupling in islets is critical to insulin release (7), we examined mitochondrial metabolic coordination among cells within intact normal and diabetic pancreatic islets. Specifically, we hypothesized that glucose and diabetes would alter the metabolic coordination within the intact islet. In general, we found that our data did not support our hypotheses. In normal islets, oscillatory metabolism remained stable in response to glucose, whereas oscillations in diabetic islets responded to a glucose increase. Our results indicate that the cascade of events leading to GSIS does not involve initiation of oscillatory behavior in islets from normal animals. The cause of the increase in oscillatory behavior found in diabetic islets may be due to their adaptation to a high-glucose environment, where 12 mM glucose is baseline and nonstimulatory. Possi-bly, a basal glucose concentration is necessary to establish regular oscillatory behavior, but, once the oscillator is already established, it is not altered by increased glucose. In normal islets exposed to an increase in glucose from basal to high levels, the increase in GSIS may stem from some point along the cascade other than mitochondrial metabolism and oxygen consumption.
In support of other P. obesus studies, the islets from our diabetic animals appeared to include regions consisting of apoptotic or necrotic cells (9, 34). The histological studies of Petkov et al. (34) showed that islet damage in diabetic P. obesusis similar to that found in human diabetes, BB Wistar rats, and C57BL/KS mice (11, 23, 42). We have found that the mitochondrial potentiometric dye Rh123 appears to be an excellent tool for visualizing cell damage in intact islets, as it is highly permeable and specific to mitochondria.
This study presents novel findings on metabolic coordination within intact pancreatic islets. Using the mitochondrial poten-tiometric dye Rh123 to monitor metabolic oscillations, we demonstrated that individual cells in intact islets of Langerhans are heterogeneous in terms of the synchronicity, regularity, and frequency of oscillation. Others have measured oscillations in mitochondrial membrane potential in isolated-cells (19), but this is the first study to show mitochondrial membrane poten-tial oscillations in an intact islet and to describe the heteroge-neity of these oscillations. It has been proposed that although isolated -cells demonstrate metabolic heterogeneity (re-viewed in Ref. 37), this heterogeneity may disappear under the more physiologically relevant conditions of the intact islet (3) or even-cell clusters (15), where intercellular coordination is
increased through gap junctions (12, 28, 43). Heterogeneity and asynchronous oscillations (of calcium) have also been ascribed to prolonged culture conditions (6). Contrary to these studies, our data show that heterogeneous (and asynchronous) oscillations occur in islets from normal animals after short-term (overnight) culture conditions. A recent study by Ravier et al. (40) supports our findings through consistent measure-ments of asynchronous calcium oscillations from intact islets from ob/ob mice and, infrequently, from normal islets (islets were cultured for a maximum of 1 day after isolation).
Oscillatory regularity appears to be an essential measure of islet health; one of the characteristics of human NIDDM is the switch from regular to irregular insulin secretion pulsatility (21). We used a novel method to determine the waveform regularity of recorded mitochondrial membrane potential os-cillations. Our measured waveforms could be classified as nonstationary and possibly multicomponent because 1) the duration of the experiments, combined with typical oscillation periods of 4 min, limited our data to ⬍10 cycles; and 2) the cycles were not all the same period and were not perfectly sinusoidal. In general, nonstationary, multicomponent signals cannot be classified with a single frequency and phase. Con-sequently, we used correlation and Fourier transform tech-niques to find stationary sinusoidal waveforms that approxi-mate the data. The degree to which our data matched an ideal sinusoid was a reasonable measure of its regularity. To check whether this measure was valid, we also calculated sample entropy values (41) for the data. In general, the sample entropy measure of regularity agreed with the correlation measure of regularity. However, sample entropy provided no insight into phase relationships among the cells. An advantage of using the sinusoids was that we could assess frequency and phase rela-tionships within islets.
Regularity was defined as the closeness of a given measured waveform to a sinusoidal waveform of similar frequency. These values were averaged from all cells for each islet to obtain a regularity measure for each islet. Our analysis (both regularity and sample entropy) showed that diabetic islets increased regularity in response to glucose more than normal islets and that this change resulted from recruitment of non-oscillating cells into a midregularity oscillation category. This response indicates that diabetes alters the quality of oscillation in a subpopulation of islet cells.
Although normal islets had a larger number of viable cells compared with diabetic islets, there was not a dramatic differ-Fig. 6. Distribution of periods in normal (A;
n⫽12) and diabetic (B;n⫽11) islets at 6 mM (6) and 12 mM (12) glucose. Data points represent the average %cells oscillating at a given (binned) period. Data are presented as means⫾SE.
E1096 DIABETIC ISLET MITOCHONDRIAL OSCILLATIONS
AJP-Endocrinol Metab•VOL 287 • DECEMBER 2004 •www.ajpendo.org
on May 27, 2011
ajpendo.physiology.org
[image:8.612.204.562.72.221.2]ence between the two in terms of the total percentage of cells per islet oscillating at any given glucose concentration. Normal islets have a larger absolute number of oscillating cells as well as a greater store of insulin granules and thus a superior glucose-induced insulin release, whereas diabetic islets may have to recruit more cells into activity to approximate a normal insulin secretion response. This subpopulation of nonoscillat-ing cells may have been modified by exposure to diabetic conditions, resulting in reduced sensitivity to glucose. They may be held in reserve so that when glucose is increased, this subpopulation can be called on to start oscillating, thus secret-ing more insulin.
Using cross-correlation analysis, we found that normal islets oscillated with higher synchronicity than diabetic islets at both glucose concentrations. Similar findings of reduced synchro-nicity (in this case, calcium) oscillations have been reported in ob/ob mice (40). We also found that diabetic islets increase oscillatory synchronicity significantly more than normal islets in response to glucose. These differences in glucose respon-siveness were significant only when nonoscillating cells were eliminated from the analysis. When the analysis was modified to include these cells, the differences between the diabetic and normal groups disappeared, indicating that the oscillating cells were the major driving force behind the glucose-induced change in synchronicity. The mechanism for the glucose-induced increase in oscillatory synchronicity in diabetic islets can be attributed to the recruitment of cells from the nonoscil-latory to the oscilnonoscil-latory category (an increase in regularity in diabetic but not normal islets). It is possible that these cells have a higher threshold for glucose response because of expo-sure to diabetic conditions.
Previous studies have supported the idea that, in normal islets, glucose stimulates a recruitment of cells into activity (36, 37). In support of our findings (that only diabetic islets recruit cells into activity as a result of glucose stimulation, whereas all cells within a normal islet function simultaneously at a range of glucose concentrations), a study by Jonkers and Henquin (15) demonstrated that, although isolated-cells are recruited in response to increasing glucose, all-cells within a cluster have an active calcium response to glucose (6 –10 mM). Also, diabetic islets have fewer functional cells (as indicated by Rh123 staining and terminal transferase-mediated dUTP nick-end labeling assays; Ref. 9) compared with normal islets. This reduced population may compensate by increasing syn-chronicity dramatically with glucose to achieve the same in-sulin secretion as a normal islet (with a normal complement of functioning-cells).
Although overall synchronicity levels were lower in diabetic islets compared with normal islets, the greater glucose re-sponse in diabetic islets indicates that a large increase in synchronicity is not necessarily responsible for the normal insulin response to glucose. This result was unexpected; we had anticipated that a large increase in the degree of synchro-nicity would be the hallmark of a normally functioning islet, as the literature states that glucose increases the amplitude of oscillatory insulin release (8). An increase in synchronicity among individual cells could result in waveform summation and manifest as an increase in overall measured amplitude of insulin secretion. Alternatively, elevated postprandial plasma insulin levels due to increased islet insulin secretion oscillation amplitude may be a result of increased oscillatory amplitude in
individual islet cells rather than greater synchrony. This idea is supported by our results as well as previous studies (15) where cells in clusters increased in cytosolic calcium oscillation amplitude in response to glucose.
In addition to cross-correlation, we examined the synchro-nicity of our waveform data with absolute cross-correlation and maximal cross-correlation methods. The cross-correlation analysis revealed differences in glucose responsiveness, whereas absolute and maximal cross-correlation analysis did not distinguish between the treatment groups. This result indi-cates that the glucose-induced change in synchronicity is phase dependent and, more specifically, that the response to glucose involves a subpopulation of cells shifting oscillatory phase by 180°.
It is interesting to note that in one-third of normal islets, there were cells of very high regularity and almost identical frequency (within a given islet). This result implies the pres-ence of an intercellular messenger that sets both the frequency and the degree of oscillatory regularity within individual cells. These cells were dispersed rather than clustered within the focal plane of the islet, indicating that the coordinating factor must be diffusible rather than due to cell-to-cell junctional interactions. Only some of the cells in each of these islets were oscillating with identical frequency and regularity, indicating that a population of cells was not receptive to the diffusible factor. The number of receptive cells (cells sensitive to the imputed diffusible factor) did not differ between the glucose concentrations, although we cannot rule out an increase in the number of receptive cells at even higher concentrations of glucose or, likewise, a decrease at low glucose. We did not find these cells in diabetic islets; this result could indicate either a lack of diffusible factor or an increased resistance to its influence. We analyzed the phase status of the highly regular cells and found that these cells were highly coupled in terms of their oscillatory phase, but they were not highly synchronized. The one-third of islets in which this phenomenon was found did not appear to have any particular characteristics that dis-tinguished them from the other normal islets. Islets were isolated nonspecifically from the entire pancreas, so it is possible that these islets were unique because they came from a particular section of the pancreas.
Several mechanisms have been proposed to explain the oscillatory synchronization between insulin-secreting cells; these include gap junctions and diffusible factors. The use of gap junction blockers has illustrated that gap junctions are not imperative to intercellular calcium oscillation coordination (6, 44); additionally, the synchronicity of dispersed or clonal
-cells suggests that a diffusible factor may play a major role in coordination (8). Although past literature has negated the role of insulin in intercellular coordination and GSIS (8), recently insulin has been reexamined as a candidate diffusible factor, and several studies have demonstrated strong support-ing evidence for the essential role of insulin in glucose-stimulated insulin release (reviewed in Ref. 45). These studies show that not only is insulin necessary for glucose-stimulated insulin release, but it is important for increasing insulin secre-tion in response to glucose. It is possible that the lower level of synchronicity among cells in the diabetic islet could be a result of reduced insulin secretion from these cells. When insulin secretion is increased in response to glucose, synchronicity increases because of higher levels of this autocrine messenger.
on May 27, 2011
ajpendo.physiology.org
Additionally, synchronization in diabetic islets could be lower because the positive feedback mechanism depends on calcium-induced calcium release, which is impaired in dia-betic islets (2).
In our study, insulin feedback mechanisms may play a role in modulating both oscillatory amplitude and synchronicity. Westerlund et al. (48) found that the addition of insulin mimetic compound L-783281 increased the quantity of insulin release at 11 mM glucose without changing the insulin secre-tion pulsatile frequency, indicating that, in normal islets, insu-lin acts to increase the amplitude of insuinsu-lin secretion. At high levels of insulin, as found in normal islets, this feedback mechanism may work to enhance the amplitude of secretion from individual cells, whereas at low-insulin levels, such as those found in diabetic islets, the feedback mechanism may work to increase synchronicity. At low glucose levels (and also low levels of insulin secretion), Westerlund et al. found that the quantity of secretion was not affected, but frequency was altered. In the diabetic islets, this alteration in frequency could result in increased synchronicity among cells, changing the oscillatory profile so that the effective amplitude of insulin secretion from the entire islet, but not the overall quantity of insulin secretion, would be increased. This increased amplitude could potentially reflect the increase in synchronicity between the cells in the islet, as is seen in the diabetic animals in our study.
Our data revealed a wide heterogeneity in oscillatory period with peak periods falling within the range of previously de-scribed periods of pulsatile insulin secretion (25). The diabetic and normal islets did not differ significantly in terms of oscillatory period, a result that concurs with previous findings that demonstrate a change in oscillatory amplitude, but not period, in response to diabetes (8, 24). Oscillatory periods measured from individual cells in the intact islet for normal and diabetic animals were highly variable, more so at higher glucose concentrations. This result potentially could be ex-plained by the period variability that exists between islets as described by Yarimizu et al. (49), because this study presents the data as an average of binned periods for 11–12 islets. However, when the period distribution was examined for each islet, we found similar period variability for the cells oscillat-ing within an individual islet (data not shown).
We also demonstrated that oscillatory period was not depen-dent on location within the islet, at least within the confines of a confocal plane, and that cells oscillating with one period switched periods in response to an increase in glucose concen-tration. It is possible that -cells with different threshold responses to glucose (47) are being recruited to activity at a specific frequency, indicating that the secretory response to glucose has a greater frequency dependence than previously thought. This idea would contradict the current consensus that response to glucose is period independent (4). Similar to other studies, the period range presented in our study corresponds to periods found for insulin secretion, intracellular calcium con-centrations, the ATP/ADP ratio, and oxygen consumption in intact islets and dissociated -cells (8, 30, 38).
Some studies have provided evidence for the existence of a pacemaker cell (31). Accordingly, we would expect to be able to visualize the location of the pacemaker cell on the basis of our maps for each parameter, synchronicity, regularity, and frequency, but clustering for these parameters was not
appar-ent. It is possible that the signal propagation is not radial (from a single source) or that this source was located near the surface of the islet rather than close to the core; in this case, we would not be able to visualize clustering using our technique because of its two-dimensional limitations.
In summary, we have shown that mitochondrial metabolism, measured from individual cells in the intact islet, is oscillatory and that these oscillations are heterogeneous. We processed the data using methods novel to the field of islet oscillation analysis. Our results demonstrate that normal and diabetic islets oscillate with similar regularity, but only diabetic islets respond to glucose by increasing the number of oscillating cells. Furthermore, we found that cells in normal islets oscillate more synchronously compared with diabetic islets, but only cells in diabetic islets respond to glucose by greatly increasing oscillatory synchronicity. Although mitochondrial membrane potential in diabetic islets oscillates in a regular manner, the decreased intercellular oscillatory synchronicity could be re-sponsible for the decreased oscillatory amplitude of insulin secretion that results from type 2 diabetes.
ACKNOWLEDGMENTS
We thank J. R. Moorman, S. Pincus, J. Deeney, K. Tornheim, D. Dagan, S. Haigh, S. Graf, E. Corson, R. Khawaled, and G. Yaney for helpful discussions; V. M. Chenault for diabetic and normal sand rats; and G. Palchik for technical assistance.
GRANTS
This work was supported in part by National Institutes of Health Grants P-41-RR-001395-21 and RO-1-DK-063356-02 and by funding from Impulse Dynamics.
REFERENCES
1. Andersen UB, Dige-Petersen H, Frandsen EK, Ibsen H, and Volund A.Basal insulin-level oscillations in normotensive individuals with ge-netic predisposition to essential hypertension exhibit an irregular pattern.
J Hypertens15: 1167–1173, 1997.
2. Aspinwall CA, Qian WJ, Roper MG, Kulkarni RN, Kahn CR, and Kennedy RT.Roles of insulin receptor substrate-1, phosphatidylinositol 3-kinase, and release of intracellular Ca2⫹ stores in insulin-stimulated
insulin secretion in beta-cells.J Biol Chem275: 22331–22338, 2000. 3. Bennett BD, Jetton TL, Ying G, Magnuson MA, and Piston DW.
Quantitative subcellular imaging of glucose metabolism within intact pancreatic islets.J Biol Chem271: 3647–3651, 1996.
4. Bergsten P.Pathophysiology of impaired pulsatile insulin release. Dia-betes Metab Res Rev16: 179 –191, 2000.
5. Bergsten P and Hellman B. Glucose-induced amplitude regulation of pulsatile insulin secretion from individual pancreatic islets.Diabetes42: 670 – 674, 1993.
6. Bertuzzi F, Davalli AM, Nano R, Socci C, Codazzi F, Fesce R, Di Carlo V, Pozza G, and Grohovaz F.Mechanisms of coordination of Ca2⫹signals in pancreatic islet cells.Diabetes48: 1971–1978, 1999.
7. Bertuzzi F, Zacchetti D, Berra C, Socci C, Pozza G, Pontiroli AE, and Grohovaz F.Intercellular Ca2⫹waves sustain coordinate insulin secretion
in pig islets of Langerhans.FEBS Lett379: 21–25, 1996.
8. Cunningham BA, Deeney JT, Bliss CR, Corkey BE, and Tornheim K.
Glucose-induced oscillatory insulin secretion in perifused rat pancreatic islets and clonal -cells (HIT). Am J Physiol Endocrinol Metab 271: E702–E710, 1996.
9. Donath MY, Gross DJ, Cerasi E, and Kaiser N. Hyperglycemia-induced beta-cell apoptosis in pancreatic islets of Psammomys obesus
during development of diabetes.Diabetes48: 738 –744, 1999.
10. Duchen MR.Ca2⫹-dependent changes in the mitochondrial energetics in
single dissociated mouse sensory neurons.Biochem J283: 41–50, 1992. 11. Greider MH, Lacy PE, Kissane JM, Rieders E, and Thomas G.
Pancreatic perinuclear inclusions in diabetes mellitus and other diseases.
Diabetes26: 793–797, 1977.
E1098 DIABETIC ISLET MITOCHONDRIAL OSCILLATIONS
AJP-Endocrinol Metab•VOL 287 • DECEMBER 2004 •www.ajpendo.org
on May 27, 2011
ajpendo.physiology.org
12. Gylfe E, Grapengiesser E, Liu YJ, Dryselius S, Tengholm A, and Eberhardson M.Generation of glucose-dependent slow oscillations of cytoplasmic Ca2⫹in individual pancreatic beta cells.Diabetes Metab24:
25–29, 1998.
13. Hellman B, Idahl LA, and Danielsson A.Adenosine triphosphate levels of mammalian pancreatic B cells after stimulation with glucose and hypoglycemic sulfonylureas.Diabetes18: 509 –516, 1969.
14. Johnson LV, Walsh ML, and Chen LB.Localization of mitochondria in living cells with rhodamine 123.Proc Natl Acad Sci USA77: 990 –994, 1980.
15. Jonkers FC and Henquin JC.Measurements of cytoplasmic Ca2⫹ in
islet cell clusters show that glucose rapidly recruits-cells and gradually increases the individual cell response.Diabetes50: 540 –550, 2001. 16. Jorns A, Tiedge M, Ziv E, Shafrir E, and Lenzen S.Gradual loss of
pancreatic -cell insulin, glucokinase and GLUT2 glucose transporter immunoreactivities during the time course of nutritionally induced type-2 diabetes inPsammomys obesus(sand rat).Virchows Arch440: 63– 69, 2002.
17. Josefsen K, Stenvang JP, Kindmark H, Berggren PO, Horn T, Kjaer T, and Buschard K.Fluorescence-activated cell sorted rat islet cells and studies of the insulin secretory process.J Endocrinol149: 145–154, 1996. 18. Kalman R, Adler JH, Lazarovici G, Bar-On H, and Ziv E. The efficiency of sand rat metabolism is responsible for development of obesity and diabetes.J Basic Clin Physiol Pharmacol4: 57– 68, 1993. 19. Kindmark H, Kohler M, Brown G, Branstrom R, Larsson O, and
Berggren PO. Glucose-induced oscillations in cytoplasmic free Ca2⫹
concentration precede oscillations in mitochondrial membrane potential in the pancreatic-cell.J Biol Chem276: 34530 –34536, 2001.
20. Lacy PE and Kostianovsky M.Method for the isolation of intact islets of Langerhans from the rat pancreas.Diabetes16: 35–39, 1967.
21. Lang DA, Matthews DR, Burnett M, and Turner RC.Brief, irregular oscillations of basal plasma insulin and glucose concentrations in diabetic man.Diabetes30: 435– 439, 1981.
22. Leibowitz G, Yuli M, Donath MY, Nesher R, Melloul D, Cerasi E, Gross DJ, and Kaiser N.-Cell glucotoxicity in thePsammomys obesus
model of type 2 diabetes.Diabetes50,Suppl1: S113–S117, 2001. 23. Leiter EH, Gapp DA, Eppig JJ, and Coleman DL.Ultrastructural and
morphometric studies of delta cells in pancreatic islets from C57BL/Ks diabetes mice.Diabetologia17: 297–309, 1979.
24. Lin JM, Sternesjo J, Sandler S, and Bergsten P.Preserved pulsatile insulin release from prediabetic mouse islets.Endocrinology140: 3999 – 4004, 1999.
25. Longo EA, Tornheim K, Deeney JT, Varnum BA, Tillotson D, Prentki M, and Corkey BE. Oscillations in cytosolic free Ca2⫹, oxygen
con-sumption, and insulin secretion in glucose-stimulated rat pancreatic islets.
J Biol Chem266: 9314 –9319, 1991.
26. Maechler P. Mitochondria as the conductor of metabolic signals for insulin exocytosis in pancreatic-cells.Cell Mol Life Sci59: 1803–1818, 2002.
27. Matthews DR, Naylor BA, Jones RG, Ward GM, and Turner RC.
Pulsatile insulin has greater hypoglycemic effect than continuous delivery.
Diabetes32: 617– 621, 1983.
28. Meda P, Kohen E, Kohen C, Rabinovitch A, and Orci L. Direct communication of homologous and heterologous endocrine islet cells in culture.J Cell Biol92: 221–226, 1982.
29. Nesher R, Warwar N, Khan A, Efendic S, Cerasi E, and Kaiser N.
Defective stimulus-secretion coupling in islets ofPsammomys obesus, an animal model for type 2 diabetes.Diabetes50: 308 –314, 2001. 30. Nilsson T, Schultz V, Berggren PO, Corkey BE, and Tornheim K.
Temporal patterns of changes in ATP/ADP ratio, glucose 6-phosphate and
cytoplasmic free Ca2⫹in glucose-stimulated pancreatic-cells.Biochem
J314: 91–94, 1996.
31. Palti Y, David GB, Lachov E, Mida YH, and Schatzberger R.Islets of Langerhans generate wavelike electric activity modulated by glucose concentration.Diabetes45: 595– 601, 1996.
32. Paolisso G, Sgambato S, Gentile S, Memoli P, Giugliano D, Varricchio M, and D’Onofrio F.Advantageous metabolic effects of pulsatile insulin delivery in noninsulin-dependent diabetic patients. J Clin Endocrinol Metab67: 1005–1010, 1988.
33. Pertusa JA, Nesher R, Kaiser N, Cerasi E, Henquin JC, and Jonas JC.
Increased glucose sensitivity of stimulus-secretion coupling in islets from
Psammomys obesusafter diet induction of diabetes.Diabetes51: 2552– 2560, 2002.
34. Petkov P, Hadjiisky P, and Marquie G.Pancreatic islets histochemistry in normal sand rats (Psammomys obesus). Cell Mol Biol Incl Cyto Enzymol27: 655– 665, 1981.
35. Pincus SM. Approximate entropy as a measure of system complexity.
Proc Natl Acad Sci USA88: 2297–2301, 1991.
36. Pipeleers D.The biosociology of pancreatic B cells.Diabetologia 30: 277–291, 1987.
37. Pipeleers D, Kiekens R, Ling Z, Wilikens A, and Schuit F.Physiologic relevance of heterogeneity in the pancreatic-cell population. Diabeto-logia37,Suppl2: S57–S64, 1994.
38. Porterfield DM, Corkey RF, Sanger RH, Tornheim K, Smith PJ, and Corkey BE.Oxygen consumption oscillates in single clonal pancreatic
-cells (HIT).Diabetes49: 1511–1516, 2000.
39. Prentki M, Tornheim K, and Corkey BE.Signal transduction mecha-nisms in nutrient-induced insulin secretion. Diabetologia 40, Suppl 2: S32–S41, 1997.
40. Ravier MA, Sehlin J, and Henquin JC.Disorganization of cytoplasmic Ca2⫹oscillations and pulsatile insulin secretion in islets fromob/obmice.
Diabetologia45: 1154 –1163, 2002.
41. Richman JS and Moorman JR.Physiological time-series analysis using approximate entropy and sample entropy.Am J Physiol Heart Circ Physiol
278: H2039 –H2049, 2000.
42. Seemayer TA, Colle E, Tannenbaum GS, Oligny LL, Guttmann RD, and Goldman H.Spontaneous diabetes mellitus syndrome in the rat. III. Pancreatic alterations in aglycosuric and untreated diabetic BB Wistar-derived rats.Metabolism32: 26 –32, 1983.
43. Sherman A and Rinzel J. Model for synchronization of pancreatic
-cells by gap junction coupling.Biophys J59: 547–559, 1991. 44. Squires PE, Hauge-Evans AC, Persaud SJ, and Jones PM.
Synchro-nization of Ca2⫹-signals within insulin-secreting pseudoislets: effects of
gap-junctional uncouplers.Cell Calcium27: 287–296, 2000.
45. Srivastava S and Goren HJ.Insulin constitutively secreted by-cells is necessary for glucose-stimulated insulin secretion.Diabetes52: 2049 – 2056, 2003.
46. Tornheim K.Are metabolic oscillations responsible for normal oscilla-tory insulin secretion?Diabetes46: 1375–1380, 1997.
47. Van Schravendijk CF, Kiekens R, and Pipeleers DG.Pancreatic beta cell heterogeneity in glucose-induced insulin secretion.J Biol Chem267: 21344 –21348, 1992.
48. Westerlund J, Wolf BA, and Bergsten P.Glucose-dependent promotion of insulin release from mouse pancreatic islets by the insulin-mimetic compound L-783,281.Diabetes51,Suppl1: S50 –S52, 2002.
49. Yarimizu K, Kawano N, Ono J, and Takaki R.Periodicity of insulin secretion comprises multiple cycles with different duration in perfused rat islets.Diabetes Res Clin Pract17: 27–32, 1992.
50. Zar JH.Biostatistical Analysis. Upper Saddle River, NJ: Prentice Hall, 1998.
on May 27, 2011
ajpendo.physiology.org