w
***
* *
*
* *
*
***
STATISTICS IN FOCUS
[3?L]
Population and social conditions
eurostat
1998
D
3
.
. ..tO
ISSN 1024-4352
Migration between the Mediterranean Basin and the EU in 1995
In the context of this publication, the following countries are classified as Mediterraroan: Algeria, Cyprus, f
Egypt, Israel, Jordan, Lebanon, Malta, Morocco, Palestine, Syria, Tunisia and Turkey. These are the 12 :
partners cooperating with the EU in the MEDSTA T programme. This programme aims to harmonizs I
international statistics in different subject areas, including international migratbn. The figures currently i
published in this'Statistics in focus' are based on those provided solely by EU Member States [
Before the conclusion of the MEDSTA T programme, another 'Statistics in focus' will providean opportunity
to publish data contributed by both EU and Mediterranean countries.
Immigration from these Mediterranean countries represents 8% of the total immigration to the EU Member States. The flows are predominantly directed towards Germany, France and the Netherlands.
95% of immigrants with citizenship of a Mediterranean country are Turkish, Moroccan, Lebmese, Algerian
and Tunisian.
Some 80% of the Mediterranean citizens living in the EU reside in Germany or France.
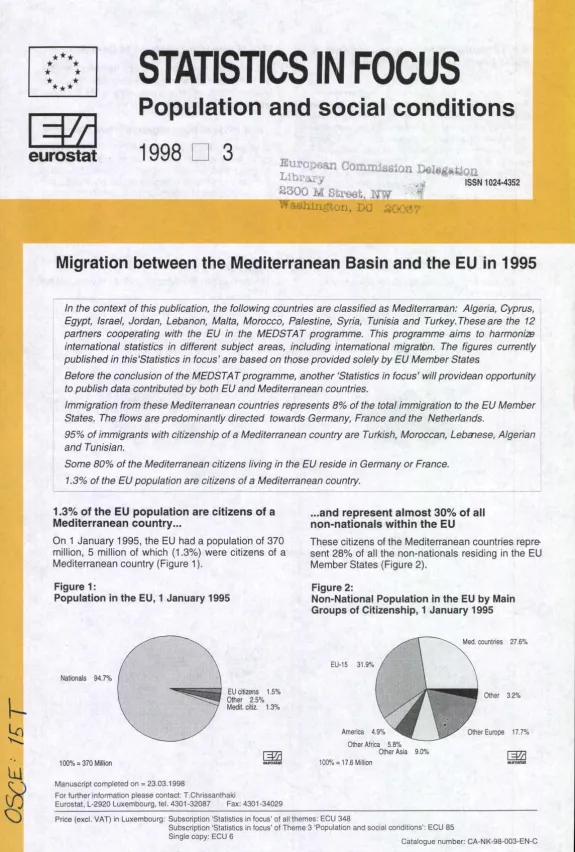
1.3% of the EU population are citizens of a Mediterranean country.
1.3% of the EU population are citizens of a Mediterranean country ...
[image:1.592.9.584.14.866.2]On 1 January 1995, the EU had a population of 370 million, 5 million of which (1.3%) were citizens of a Mediterranean country (Figure 1 ).
Figure 1:
Population in the EU, 1 January 1995
Nationals 94.7%
100% = 370 Million
Manuscript completed on = 23.03.1998
EU citizens 1.5%
Other 2.5%
Medit. citiz. 1.3%
~
eu'Ostat
... and represent almost 30% of all non-nationals within the EU
These citizens of the Mediterranean countries repre-sent 28% of all the non-nationals residing in the EU Member States (Figure 2).
Figure 2:
Non-National Population in the EU by Main
Groups of Citizenship, 1 January 1995
27.6%
EU-15 . 31.9%
Other 3.2%
Other Africa 5.8%
Other Asia 9.0%
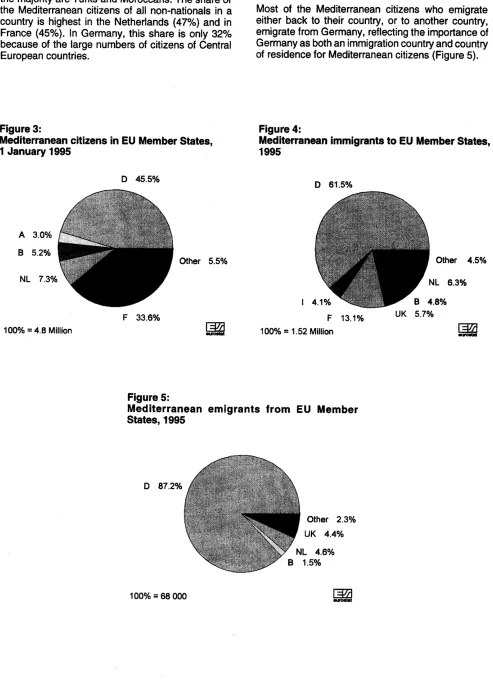
80% of Mediterranean. citizens resident
in
EU-15 live
in
Germany and France
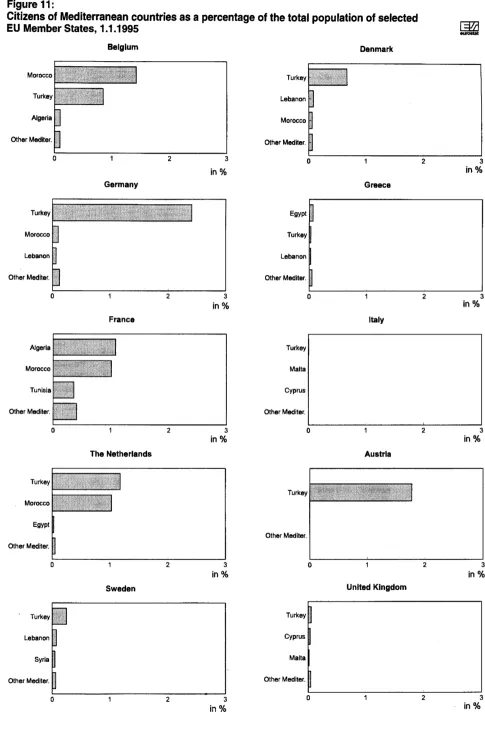
[image:2.589.55.548.158.844.2]On 1 January 1995, most of the Mediterranean citi-zens (80%) were concentrated in two Member States: Germany and France (Figure 3). In Germany, nearly all (90%) are Turks. In Belgium and the Netherlands the majority are Turks and Moroccans. The share of the Mediterranean citizens of all non-nationals in a country is highest in the Netherlands (47%) and in France (45%). In Germany, this share is only 32% because of the large numbers of citizens of Central European countries.
Figure 3:
Mediterranean c.itizens in EU Member States, 1 January 1995
A 3.0%
B 5.2% NL 7.3% 100% = 4.8 Million
D 45.5%
Other 5.5%
F 33.6%
Figure 5:
50% of new immigrants go to Germany ...
During 1995, Germany, France, Netherlands, Bel-gium, the UK and Italy received more than 90% of the Mediterranean citizens immigrating to the EU. Over half of them went to Germany (Figure 4).
... and most of the emigrants leave Germany
Most of the Mediterranean citizens who emigrate either back to their country, or to another country, emigrate from Germany, reflecting the importance of Germany as both an immigration country and country of residence for Mediterranean citizens (Figure 5).
Figure 4:
Mediterranean immigrants to EU Member States, 1995
D 61.5%
F 13.1% 100% = 1.52 Million
Other 4.5%
UK 5.7%
Mediterranean emigrants from EU Member States, 1995
D 87.2%
100% = 68 OOO
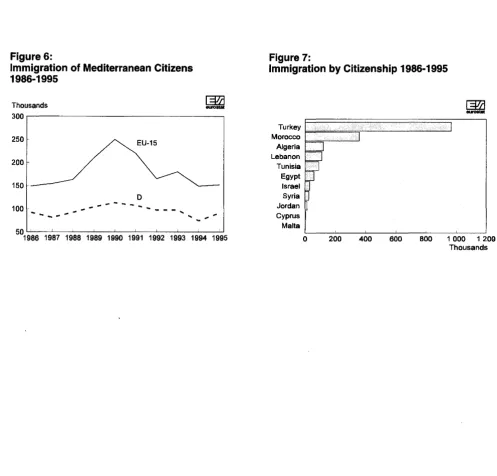
The last ten years
Receiving countries:
During the period 1986-1995 nearly 50% of all Med~ terranean immigrants went to Germany (Figure 6). If France, Netherlands and Italy, are also included, the percentage is nearly 90%. The figure for Belgium is 4% and some 2% for the United Kingdom and Swe-den. The peaks in Figure 6 are due to the regularisa-tion of undocumented migrants in Italy in 1987 (mostly Moroccans and Tunisians) and again, on a much larger scale, in 1990.
More detailed analysis of available information shows that between 1986 and 1995 the annual number of immigrants of Mediterranean citizenship to Germany rose steadily from 92 OOO to 113 OOO until 1990, and then declined to around 91 OOO in 1995; a total of almost 1 million immigrants during the whole period. The majority of Turks and Lebanese went to Ger-many.
France ranked second with 310 OOO immigrants dur-ing the same ten year period; mostly Moroccans and Algerians. The Netherlands, the second favourite
Figure 6:
Immigration of Mediterranean Citizens 1986-1995
Thousands 300
250
150 ,_
EU-15
D
100
---
-...
----5QL...1..-~L_____._~....__---'-~----'-~'---'-~-'---'
1986 1987 1988 1989 1990 1991 1992 1993 1994 1995
destination for Turks and Moroccans received 183 OOO immigrants.
Italy grew throughout the period as an important immigration country for Moroccans and Tunisians (20% of all non-nationals immigrating into Italy during the period 1986-1995).
Sending countries:
From 1986 to 1995 nearly 1 million Turks immigrated to the EU (Figure 7), the vast majority to Germany (78%), followed by Netherlands (9%) and France (6%). Despite a relatively steady decline since 1991, some 91 OOO Turks emigrated to the EU in 1995.
[image:3.589.53.550.346.822.2]More detailed analysis of available information shows that during the same period 1986-1995, 353 OOO Moroccans ·immigrated to the EU, mainly to France (113 OOO) but also to the Netherlands (70 OOO), ltaly (62 OOO) and Germany (49 OOO). Lebanese (111 OOO) went mainly to Germany (63%) but also to France and Sweden. 32% of the Tunisians went to France, 31% to Italy and 27% to Germany. Italy became an impor-tant host country for Tunisians during the late 1980s.
Figure 7:
Immigration by Citizenship 1986-1995
Turkey ~=========~·----~---'!
Morocco 6"""'=-c...;._;_-'-'-'-'I
L~:n~~:
Egyptf
Israel Syria
Jordan
Cyprus
Malta
0 200 400 600 800 1 OOO 1 209
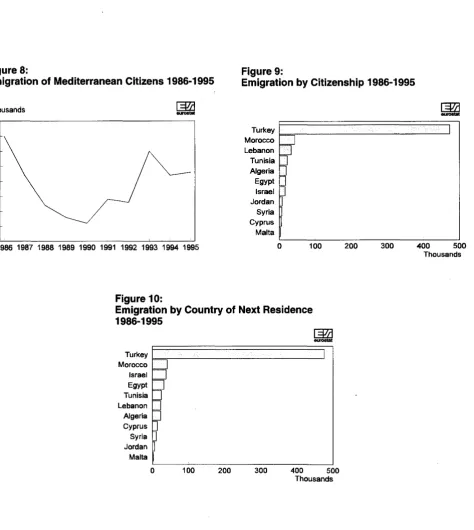
Emigrants from EU-15 countries
Only nine EU Member States (Belgium, Denmark, Germany, Italy, Luxembourg, Netherlands, Finland, Sweden and the United Kingdom) are able to provide data on emigration. In the period 1986-1995, emigra-tion of Mediterranean citizens was only 6% of total emigration (or 10% of emigration of non-nationals). Most of the emigrants were Turks (473 OOO or 75% of all Mediterranean emigrants) emigrating mainly from Germany to Turkey (Figures 8, 9, 10).
[image:4.589.62.536.272.802.2]Turks, Moroccans, Tunisians and Jordanese are the ones most likely to emigrate from an EU Member State but not necessarily back to their cou~tries.
Figure 8:
Emigration of Mediterranean Citizens 1986-1995
Thousands
a s . - - - ~ - ~ - - - - ~ - - - ,
80 75 70 65 60 55 50
4 5 ' - - - ~ - - - ~ - - - ' - - - ' 1986 1987 1988 1989 1990 199119921993 1994 1995
Figure 10:
There are different types of migrations. For example, migration in a single step, i.e. a person resident in his or her country of citizenship immigrating to a second country, seems to be the case with immigrants from Turkey, Jordan, Tunisia and Morocco. Migration in-volving more than one step i.e. a person immigrating to country A and then emigrating from A to country B where Bis not the country of origin is more difficult to record.
A comparison of Figures 9 and 10 shows the simi-larities and differences between emigration meas-ured by country of next residence and by citizenship. Some of the differences are the result of data collec-tion problems. Others indicate the number of people emigrating to a country· other than that of their own citizenship.
Figure 9:
Emigration by Citizenship 1986-1995
Turkey 1 = = = : ; - - - ~
Morocco
LJ
LebanonLJ
=
Tunisia Algeria """
Egypt 1=
F Israel Jordan Syria Cyprus Malta
0 100 200 300 400 500
Thousands
Emigration by Country of Next Residence 1986-1995
Turkey 1 = = = = . - - - ~
Morocco Israel Egypt Tunisia Lebanon Algeria Cyprus Syria Jordan Malta
0 100 200 300 400 500
Figure 11:
Citizens of Mediterranean countries as a percentage of the total population of selected
[3?LJ
EU Member States, 1.1.1995
-Belgium Denmark
Morocco Turkey
Turkey Lebanon
Algeria Morocco
Other Mediter. Other Mediter.
0 2 3 0 2 3
in% in%
Germany Greece
Turkey Egypt
Morocco Turkey
Lebanon Lebanon
Other Mediter. Other Mediter.
0 2 3 0 2 3
in% in%
France Italy
Algeria Turkey
Morocco Malta
Tunisia Cyprus
Other Mediter. Other Mediter.
0 2 3 0 2 3
in% in%
The Netherlands Austria
Turkey
Turkey Morocco
Egypt
Other Mediter. Other Mediter.
0 2 3 0 2 3
in% in%
Sweden United Kingdom
Turkey Turkey
I
Lebanon Cyprus
I
Syria Malta
Other Mediter. Other Mediter.
~
0 2 3 0 2 3
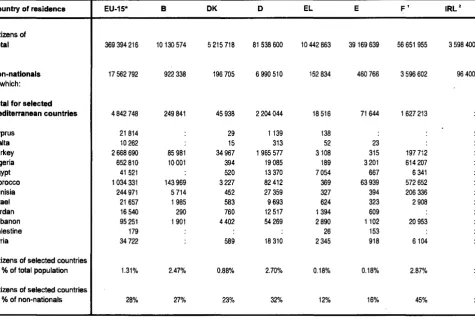
Table 1:
Population by citizenship 1 January 1995
[3!i]
8UI08lat
Country of residence EU-15* B DK D EL E F' IRL 2
Citizens of
Total 369 394 216 10130 574 5 215 718 81538600 10442 863 39169 639 56 651 955 3 598 400
Non-nationals 17 562 792 922 338 196 705 6 990 510 152 834 460 766 3 596 602 96 400 of which:
Total for selected
Mediterranean countries 4842 748 249 841 45 938 2 204044 18 516 71644 1627 213
Cyprus 21814 29 1139 138
Malta 10 262 15 313 52 23
Turkey 2 668 690 85 981 34 967 1965577 3108 315 197 712
Algeria 652 810 10001 394 19 085 189 3201 614 207
Egypt 41 521 520 13 370 7054 667 6 341
Morocco 1034331 143969 3227 82412 369 63939 572 652
Tunisia 244971 5714 452 27 359 327 394 206 336
Israel 21 657 1985 583 9693 624 323 2 908
Jordan 16540 290 760 12517 1394 609
Lebanon 95251 1901 4402 54 269 2890 1102 20 953
Palestine 179 26 153
Syria 34 722 589 18 310 2345 918 6104
Citizens of selected countries
as % of total population 1.31% 2.47% 0.88% 2.70% 0.18% 0.18% 2.87%
Citizens of selected countries
as % of non-nationals 28% 27% 23% 32% 12% 16% 45%
1
1990 Census results, metropolitan France.
2
Labour Force Survey, provisional data, refer to April 1995.
3
Council of Europe data.
4
Table 1: Population by citizenship 1 January 1995
13 L NL A p3 FIN s UK4
Country of residence
Citizens of
57 268 600 406 600 15424122 8 039 865 9 912100 5098 754 8 816 381 57 680 OOO Total
683 564 132 500 757138 720 911 157 073 62 012 537 441 2096000 Non.nationals
of which:
Total for selected
4 729 353430 142 970 151 2881 38 391 83 OOO Mediterranean countries
296 51 2 24 135 20 OOO Cyprus
700 100 3 6 50 9000 Malta
3 733 182 089 142 970 65 1178 21 995 29000 Turkey
933 222 578 4 OOO Algeria
4 548 197 824 8 OOO Egypt
158 653 597 1 513 7 OOO Morocco
2124 149 1116 1 OOO Tunisia
1 501 81 216 743 3 OOO Israel
320 109 541 Jordan
985 109 6640 2 OOO Lebanon
Palestine
2126 74 4256 Syria
Citizens of selected countries
0.01% 2.29% 1.78% 0.00% 0.06% 0.44% 0.14% as % of total population
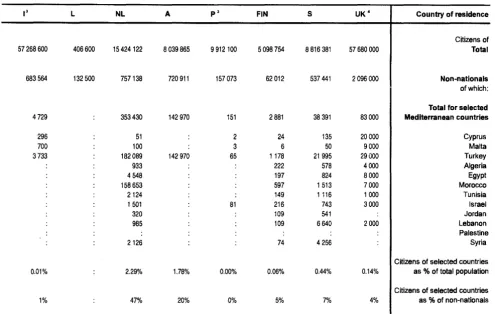
Table 2:
@!ij Immigration into the EU, by citizenship 1995 IIUIOSlat
Country of current residence EU-15, 86-95 EU-15* B DK D EL E F' IRL'
Total 1986-1995 18 821 531 524946 427 877 11447942 306440 289 650 679469 38400
Total Immigration 1 883269 62950 63187 1096048 20859 36092 50387 38400
of which:
Non-nationals 13106375 1 308197 53138 39145 792701 20859 19 538 50387
Citizens of selected
Mediterranean countries 1766722 152 254 7168 1 518 90911 2872 4352 19370
of which:
Cyprus 2 810 742 10
Malta 1589 418 7
Turkey 967 404 90944 2 520 990 74517 229 24 3072
Algeria 116170 11513 429 33 2990 22 334 7102
Egypt 55989 5495 73 1 608 1755 46 210
Morocco 352 992 25197 3596 145 3790 64 3846 6286
Tunisia 89315 5683 278 24 2143 46 18 1 862
Israel 30464 3070 218 63 825 60 11 135
Jordan 12 933 2 509 19 838 135 9
Lebanon 110765 3744 127 122 2300 200 29 572
Palestine 1272
Syria 25019 2939 48 1900 344 35 125
Citizens of selected countries
as % of total immigrants 9.4 8% 11% 2% 8% 14% 12%
Citizens of selected countries
as % of total non-nationals 13.5 12% 13% 4% 11% 14% 22% 38%
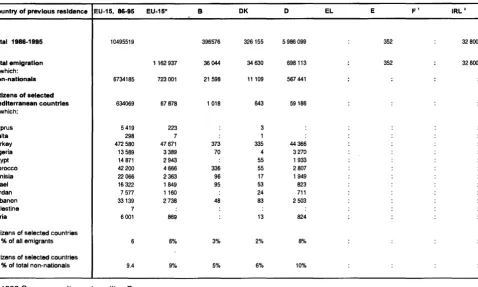
Table 3:
Emigration from the EU, by citizenship 1995 @!ij
eurostat
Country of previous residence EU-15, 86-95 EU-15* B DK D EL E F' IRL2
Total 1986-1995 10495519 396576 326 155 5986099 352 32800
Total emigration 1162 937 36044 34630 698113 352 32800
of which:
Non-nationals 6734185 723 001 21598 11109 567 441
Citizens of selected
Mediterranean countries 634069 67878 1 018 643 59186
of which:
Cyprus 5419 223 3
Malta 298 7 1
Turkey 472 580 47671 373 335 44366
Algeria 13589 3389 70 4 3270
Egypt 14 871 2943 55 1933
Morocco 42200 4666 336 55 2807
Tunisia 22066 2363 96 17 1949
Israel 16322 1849 95 53 823
Jordan 7577 1160 24 711
Lebanon 33139 2738 48 83 2503
Palestine 7
Syria 6001 869 13 824
Citizens of selected countries
as% of all emigrants 6% 3% 2% 8%
Citizens of selected countries
as % of total non-nationals 9.4 9% 5% 6% 10%
1
1990 Census results, metropolitan France.
2
Labour Force Survey, provisional data, refer to April 1995.
3
Council of Europe data.
4
Labour Force Survey Spring 1995 data, rounded figures, provisional data.
ii
[image:8.588.56.535.424.711.2]Table 2: Immigration into the EU, by citizenship 1995
I L NL A p• FIN s UK' Country of current residence
961 460 20355 1035395 : 34265 125 749 545 595 2 383 988 Total 1986-1995
100 788 10325 96099 : 5025 12 222 45887 245000 Total Immigration
of which:
53418 9590 66972 : 5025 7345 36079 154000 Non-nationals
Citizens of selected
6047 112 9378 : 28 298 1 800 8400 Mediterranean countries
of which:
: : 10 : 3 12 700 Cyprus
: 1 5 : 2 3 400 Malta
: 25 4 757 : 9 148 853 3800 Turkey
181 12 332 : 5 22 51 : Algeria
726 : 494 : 1 20 62 500 Egypt
4112 49 3100 : 8 46 155 : Morocco
1 028 25 173 : 2 14 70 ; Tunisia
: : 194 : 1 17 46 1 500 Israel
: : 37 : 1 10 60 1 400 Jordan
: : 99 : 1 11 183 100 Lebanon
: : : : : : : : Palestine
: : 177 : 5 305 : Syria
Citizens of selected countries
6% 1% 10% : 1% 2% 4% 3% as % of total immigrants
Citizens of selected countries
11% 1% 14% : 1% 4% 5% 5% as % of total non-nationals
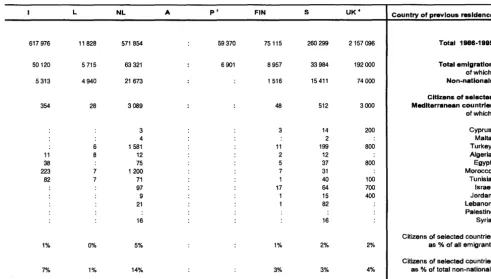
Table 3: Emigration from the EU, by citizenship 1995
I L NL A p• FIN s UK' Country of previous residence
617 976 11828 571 854 : 59370 75115 260299 2157 096 Total 1986-1995
50120 5 715 63 321 : 6901 8957 33984 192 OOO Total emigration
of which:
5313 4940 21 673 : : 1 516 15411 74000 Non-nationals
Citizens of selected
354 28 3 089 : : 48 512 3000 Mediterranean cou ntrles
of which:
: : 3 : : 3 14 200 Cyprus
: : 4 : : : 2 : Malta
: 6 1581 : : 11 199 800 Turkey
11 8 12 : : 2 12 : Algeria
38 : 75 : : 5 37 800 Egypt
223 7 1 200 : : 7 31 : Morocco
82 7 71 : : 1 40 100 Tunisia
: : 97 : : 17 64 700 Israel
: : 9 : : 1 15 400 Jordan
: : 21 : : 1 82 : Lebanon
: : : : : : : : Palestine
: : 16 : : : 16 : Syria
Citizens of selected countries
1% 0% 5% : : 1% 2% 2% as % of all emigrants
Citizens of selected countries
[image:9.594.60.551.421.699.2]Technical
1notes
1111migratlon and ernigratio11
Total irnmigration includes immigration of nationals and non,.natiohEllS; Although irnmigation is usually
Well
recorded, no reliable• and• comprehensive data• exist for Austria.
•For
Greece,• France and• Porugal,. such data have bEJen available only since 1991 andJ 992. respectively and. for non0nationals for the. tw:, • latter; No detailed breakdown by citizenship or country of previous/next residence exists for lrela1d.Emigration data·. notoriously under-record actual . emigration· flows and•. should generally be treated. with caution. No
~migration
dataare
available for Greece,. SpaIA, France and Austria~· ForPortuga.lthe seriesbegan in 1992.
Pop1.llation by
citizenship
These figures are available for·most years in countries with population registers. lreland.a,dthe UK· use the LabourForce Survey as a source and France and Austria use datafrom the census. For Italy, the source changed in• 1991, frompopulation. registers to• residence permits· (permits to stay).
The definition of citizenship and nationality presents some problems as country of origin'citizenship/natio-nality are terms sometimes used
as
if interchangeable.In
census and other surveys, citizenmip is often self-declared and ma.y. not ·coincide with the citizenship·recorded in
•the· passportAbbreviations ·and•signs
Nationals: people with citizenship of a Member State residing inthat MemberState;
Non-nationals;. people with citizenship of. country other than the one inwich they are I
residhg.
EU~ 15: MerriberStates ofthe European Union
(15
membersat
1 January 1995).Mediterranean countries: Algeria, Cyprus, Egypt, lsrael,.Jordan, Lebanon, Malta, Morocco~Palestine, Syria, Tunisia and Turkey.
* Eurostat · estimate
: No dataavailable
Further•·information
EUROSTAT
Demographic statistics •1997
For more information:
EUROSTAT
Directorate
E:
BELGIQUE/BELGIE
Eurostat Data Shop
Bruxelles/Brussel Tel. (32·2) 299 66 66
Fax (32-2) 295 01 25
E-mail:
ITAUA-Roma
ISTAT
Centro di informazione statistica -Sededi Roma
Eurostat Data Shop Tel. (39-6) 46 73 31 05/02 Fax {39-6) 46 73 31 07/01
E-mail: [email protected]
DANMARK
Danmarks Statistik Bi:lliotek og Information Eurostat Data Shop Tel. (45) 39 17 30 30
Fax (45) 3917 30 03 E-mail: bib@dstdk
LUXEMBOURG
Eurostat Data Shop Luxembourg BP 453 L - 2014 Luxembourg
4, rue A. Weicker L-2721 Luxembourg Tel. (352) 43 35 22 51 Fax (352) 43 35 22 221 E-mail: [email protected]
DEUTSCHLAND
STATISTISCHES BUNDESAMT -Berlin
Information Service Eurostat Data Shop
Tel. (49-30) 23 24 64 27/28 Fax (49-30) 23 24 64 30
NEDERLAND
STATISTICS NETHERLANDS Eurostat Data Shop • Library Tel. (31-70) 337 49 00
Fax (31-70) 337 59 84 E-mail: [email protected]
ESPANA
INE
Eurostat Data Shop Tel. (34-1) 583 91 67
Fax {34-1) 579 71 20
E-mail: [email protected]
SVERIGE
STATISTICS SWEDEN Information service Eurostat Data Shop Tel. (46-8) 783 48 01 Fax (46-8) 783 48 99 E-mail: [email protected]
FRANCE
INSEE Info Service Eurostat Data Shop Tel. (33-1) 5317 88 44 Fax (33-1) 5317 88 22 E-mail:
UNITED KINGDOM
ONS Sales Office Eurostat Data Shop Office for national statistics
Tel. (44·171) 533 5676
Fax (44-171) 533 5689
E-mail: [email protected]
ITALIA - Milano
ISTAT
Centro di infonnazione statistica
-Sede di Milano Eurostat Data Shop Tel. (39-2) 65 951331134 Fax (39-2) 65 30 75
USA
Haver analytics Eurostat Data Shop Tel. {1-212) 986 9300
Fax (1-212) 986 5857 E-mail: [email protected]
Eurostat homepage: http://europa.eu.int/eurostat.html
BELGJOUE/BELGIE - DANMARK- DEUTSCHLAND- GREECE/ELLADA - FRANCE IRELAND -ITALIA- GRAND-DUCHE DE LUXEMBOURG - NEDERLAND-0STERREICH - PORTUGAL-SUOMI /FINLAND - SVERIGE- UNITED KINGDOM - ICELAND NORWAY SWl1ZERLAND
-A worldwide list of our sales agems is available from the Office for Official Publications of the European Communities