OSD
3, 1225–1254, 2006Nesting operational forecasting models in
the Eastern Mediterranean
S. S. Sofianos et al.
Title Page
Abstract Introduction
Conclusions References
Tables Figures
J I
J I
Back Close
Full Screen / Esc
Printer-friendly Version
Interactive Discussion Ocean Sci. Discuss., 3, 1225–1254, 2006
www.ocean-sci-discuss.net/3/1225/2006/ © Author(s) 2006. This work is licensed under a Creative Commons License.
Ocean Science Discussions
Papers published inOcean Science Discussionsare under open-access review for the journalOcean Science
Nesting operational forecasting models in
the Eastern Mediterranean: active and
slave mode
S. S. Sofianos1,*, N. Skliris1, A. Mantziafou1, A. Lascaratos1, G. Zodiatis2, R. Lardner2, D. Hayes2, and G. Georgiou2
1
Ocean Physics and Modelling Group, University of Athens, Greece, University Campus, BUILD PHYS-5, Athens 15784, Greece
2
Oceanography Center, Department of Mathematics and Statistics University of Cyprus P.O. Box 20537, CY 1678 Nicosia, Cyprus
*
now at: University Campus, BUILD PHYS-5, Athens 15 784, Greece
Received: 8 May 2006 – Accepted: 28 May 2006 – Published: 8 August 2006 Correspondence to: S. S. Sofianos ([email protected])
OSD
3, 1225–1254, 2006Nesting operational forecasting models in
the Eastern Mediterranean
S. S. Sofianos et al.
Title Page
Abstract Introduction
Conclusions References
Tables Figures
J I
J I
Back Close
Full Screen / Esc
Printer-friendly Version
Interactive Discussion
Abstract
Modern ocean operational systems involve different groups and tools, in different re-gions and scales. Blending all these in a unique system with reliable forecasting ca-pabilities is an important task. The efficiency of nesting procedures between different scale and resolution models are crucial in determining whether the dynamics at the 5
different scales are well represented at each level or the nesting technique suppresses the dynamical features emerging from individual modelling components. In the present work, we investigate the role of the initialization of telescopically nested and with dou-ble horizontal resolution forecasting systems in the Eastern Mediterranean, comparing the results between weekly initialized experiments (“slave” mode) and “free” runs (“ac-10
tive” mode) at the regional (Aegean-Levantine area) and shelf (Cyprus) scale. It is found that, although the main circulation pattern remains similar, the differences in the domain mean kinetic energy between the “slave” and the “active” experiments in the Aegean-Levantine region are large in both September 2004 and January 2005, with the “active” being much more energetic, while in the Cyprus area differences are sig-15
nificantly smaller. The most pronounced differences in the circulation and sea surface temperature and salinity fields are observed in the Aegean Sea, during September 2004, related to the inflow and spreading of the Black Sea Water, and the Rhodes Gyre, during January 2005, related to small–scale eddy activity developed and surviv-ing in the “active” mode experiment that decreases the area of the gyre.
20
1 Introduction
Operational oceanography has been a major topic of research and development over the past decades. Marine monitoring systems (using in situ and remote-sensed meth-ods), marine forecasting systems (using various numerical forecasting models), their merging through assimilation techniques and dissemination activities, boosted by the 25
scientific and technological achievements of the past decades, are rapidly developing
OSD
3, 1225–1254, 2006Nesting operational forecasting models in
the Eastern Mediterranean
S. S. Sofianos et al.
Title Page
Abstract Introduction
Conclusions References
Tables Figures
J I
J I
Back Close
Full Screen / Esc
Printer-friendly Version
Interactive Discussion and expanding. Operational systems and networks have been established to
man-age, improve and consolidate the ever-increasing bulk of information and techniques. However, there remain many important aspects to be addressed, improvements to be achieved and challenges for future development.
Aiming at sharing the scientific and technical expertise as well as the financial and 5
operational load, multinational partnerships and networks are developing rapidly in sev-eral regions of the world ocean. Bringing together different groups and operational sys-tems is very crucial for monitoring the diversity of ocean dynamics in different regions and scales but also introduces the problem of blending different tools and methods. The operational forecasting activities with various numerical models and its connec-10
tion to the operational marine monitoring through various assimilation techniques are subject to these problems. Trying to evaluate the compatibility of different tools and methods becomes and outstanding activity of the operational oceanography commu-nity. These goals and problems are being targeted by theMediterranean Forecasting System (MFS), which presently finalizes its second phase, namely the partnership 15
Toward Environmental Prediction (MFSTEP) and is integrated in the Mediterranean Operational Oceanography Network (MOON).
The Mediterranean Sea, consisting of a number of semi-enclosed sub-basins with important local dynamics and at the same time interconnected with strong thermoha-line cells, is a favourable place for testing methods of blending different forecasting 20
tools. In the framework of MFS, operational forecasting activities are carried out at three levels/scales, the basin scale, the regional scale and the shelf scale, providing weekly five-days ocean circulation forecasts. These levels are connected through nest-ing with a “telescopic” pattern, where shelf models are nested in the regional ones and in turn the regional models are nested in the Mediterranean Oceanic General Circu-25
lation Model (MOGCM). An important question, when implementing this procedure, is whether the dynamics at the three different scales are well represented at each level or the nesting technique suppresses the dynamical features emerging from individual modelling components. Furthermore, is there an optimal integration time (at least in
OSD
3, 1225–1254, 2006Nesting operational forecasting models in
the Eastern Mediterranean
S. S. Sofianos et al.
Title Page
Abstract Introduction
Conclusions References
Tables Figures
J I
J I
Back Close
Full Screen / Esc
Printer-friendly Version
Interactive Discussion the region under consideration) for the modelling components to adequately develop
the circulation based on the physics of the specific model? How these apply in regions of different dynamical regimes?
In this paper, the above questions are applied in forecasting experiments in the East-ern Mediterranean Sea. Results are compared at the three different levels, basin-scale, 5
regional-scale and shelf scale, and for two different settings: weekly five-days forecast exercises, where the fine scale models are initialized every week from the coarser and larger scale model (“slave” mode) and continuous experiments, where the fine scale models are initialised only once from coarser model (“active” mode). The twin ex-periment is repeated during September 2004 and January 2005, in order to evaluate 10
possible influence of the different seasonal forcing fields. The modelling components are described in the next section. The experiments and their results are presented in the Sect. 3. Finally, discussion of the results and conclusions are derived in the last section of the paper.
2 Modelling components and experiments
15
At the top level of the operational forecasting system is the MOGCM. The modelling code is based on the OPA (Ocean Parallelise, Madec et al., 1997). The model is a primitive equation model, the Navier-Stokes equations are used with the approximation of thin-shell, Boussinesq, hydrostatic and incompressible fluid. In MFSTEP framework the model has been implemented in the Mediterranean at 10/16 horizontal resolution 20
and 72 unevenly spaced vertical levels (a detail description of the MOGCM system can be found in Tonani, 2003). The model domain covers the whole Mediterranean Sea and is extended in the Atlantic Ocean, where the model salinity and temperature fields are relaxed at all depths toward climatology along the boundary. This is done in an area, which has an extension of 2◦ at the west and south boundary and 3◦ at the 25
northern boundary (in order to cover all the area of the Gulf of Biscay). The coefficient of relaxation is bigger at the boundary of the box and exponentially decreases moving
OSD
3, 1225–1254, 2006Nesting operational forecasting models in
the Eastern Mediterranean
S. S. Sofianos et al.
Title Page
Abstract Introduction
Conclusions References
Tables Figures
J I
J I
Back Close
Full Screen / Esc
Printer-friendly Version
Interactive Discussion toward the inside of the box.
The surface freshwater flux is calculated by the salt flux given by a relaxation at the surface toward monthly mean climatological values given by MEDATLAS climatology (Jourdan et al., 1997). A sub-model computes air-sea fluxes of momentum and heat from 6 h operational analysis atmospheric forcing in all the Mediterranean Basin. The 5
sub-model computes separately all the terms in the surface heat budget and the choice of bulk formulas follows Castellari et al. (1998, 2000). Different choice has been done for the Atlantic Box where the wind stress are from a monthly mean climatology and the heat flux is given by relaxation at the surface toward the MEDATLAS monthly mean climatology.
10
Each week Mediterranean Sea data sets available for the two weeks before the starting day of forecast are assimilated. They include satellite data for the sea level anomaly, sea surface temperature, and in situ temperature profiles by VOS XBT ob-servations and in situ temperature and salinity profiles by ARGO obob-servations. The data assimilation scheme is the System for Ocean Forecast and Analysis (SOFA). It 15
is a reduced order optimal interpolation scheme (DeMey and Benkiran, 2002). The operational implementation of the scheme is described in Demirov et al. (2003).
Four regional models are nested operationally in the MOGCM forecasting system, among them the ALERMO system, described below.
2.1 Aegean-Levantine Eddy Resolving MOdel (ALERMO) 20
The ALERMO model has been implemented, developed and tested within the frame-work of the Mediterranean Forecasting System activities, (Korres and Lascaratos, 2003) including, in the latest version, application of the Variational Initialization method. The ALERMO model is based on the Princeton Ocean Model (POM, Blumberg and Mellor, 1987), a primitive equation, 3-D circulation model. POM has a bottom – fol-25
lowing vertical sigma coordinate system, a free surface and a split mode time step. Potential temperature, salinity, velocity and surface elevation, are prognostic variables. The ALERMO model covers the geographical area 20◦E–36.4◦E, 30.7◦N–41.2◦N
OSD
3, 1225–1254, 2006Nesting operational forecasting models in
the Eastern Mediterranean
S. S. Sofianos et al.
Title Page
Abstract Introduction
Conclusions References
Tables Figures
J I
J I
Back Close
Full Screen / Esc
Printer-friendly Version
Interactive Discussion and has one open boundary located at 20◦E as shown in Fig. 1. The computational
grid has a horizontal resolution of 1/30◦×1/30◦ (493×316 grid points) and 25 sigma levels in vertical with a logarithmic distribution near the sea surface, which results in a better representation of the surface mixed layer. The U.S. Navy Digital Bathymetric Data Base I (1/60◦×1/60)◦ was used for building up model’s bathymetry using bilinear 5
interpolation to map the data onto the model’s grid. The minimum depth in shallow areas has been set equal to 25 m. Seasonal hydrological data necessary for the eval-uation of the horizontal diffusion terms for tracers during the model integration were taken after proper bi-linear interpolation from the MODB-MED4 seasonal climatologi-cal data base (Brasseur et al., 1996).
10
The present ALERMO version treats Dardanelles as an open boundary where the net volume inflow into the Aegean Sea, the interface depth and the salinity of the inflowing waters are specified. Such a change was motivated by the fact that older parameterizations were underestimating the freshwater input of Black Sea origin into the Aegean Sea. Furthermore, the upgraded ALERMO version uses a real freshwater 15
flux boundary condition. The implementation of the freshwater flux boundary condition into the POM code is rather simple (since it is a free surface model) and involves only minor changes in the continuity equation’s numerical expression and the vertical velocity surface boundary condition:
∂n ∂t=−
∂HU¯
∂x + ∂HV¯
∂y
−wσ=0
20
wσ=0=E−P−R
whereηis the free surface elevation, ¯U V¯ are the zonal/meridional barotropic velocity components,H is the model bathymetry,wσ=0 is the vertical velocity at the first sigma level,E is the evaporation rate,P is the precipitation rate andR is the river runoff.
The one-way nesting with the MOGCM is applied along the western boundary of 25
ALERMO (located at 20◦E) and is thoroughly described in Korres and Lascaratos,
OSD
3, 1225–1254, 2006Nesting operational forecasting models in
the Eastern Mediterranean
S. S. Sofianos et al.
Title Page
Abstract Introduction
Conclusions References
Tables Figures
J I
J I
Back Close
Full Screen / Esc
Printer-friendly Version
Interactive Discussion 2003. The nesting between the two models involves the zonal/meridional velocity
com-ponents, temperature and salinity. The nesting scheme has been extensively tested in the MFS framework under both climatological and high frequency atmospheric forc-ing. During TOP, daily averaged OGCM variables are linearly interpolated in time and mapped onto ALERMO’s open boundary section using bi-linear interpolation in the hor-5
izontal and linear interpolation along the vertical. Normal velocities at the open bound-ary are constrained so that the volume transport is conserved between ALERMO and the OGCM.
Atmospheric conditions over the ALERMO domain are provided by the SKIRON/Eta atmospheric forecasting system (Kallos et al., 2005). The Eta atmospheric model used 10
in the SKIRON system is an operational weather prediction model, currently running with a 1/10◦×1/10◦horizontal resolution analysis for the needs of MFSTEP. It provides 10 m wind speed, 2 m air temperature and relative humidity, the precipitation rate, the shortwave radiative gain by the ocean and the infrared atmospheric radiation reaching the sea surface. These atmospheric fluxes/parameters (linearly interpolated in time) 15
are then used by the ALERMO model for the estimation of the heat, freshwater and momentum budget at the sea surface at each time step of the model’s integration. The coupling between the ALERMO and the ETA model is designed in such a way to allow one–way feedback ocean-atmosphere mechanisms to take place (Kallos et al., 2005). Although the atmospheric model fluxes at the sea surface are not influenced/corrected 20
by the oceanic model, the latter is free to adjust the evaporative, upward longwave radiation and sensible heat flux consistently with its own surface temperature using proper bulk formulae (Korres et al., 2002).
The ALERMO model is initialized from the MFSTEP OGCM (operationally on a weakly basis during the TOP period) using the Variational Initialization (VI) method 25
(Auclair et al., 2000). The VIFOP (Variational Initialization and Forcing Optimization Platform) package including the tangent linear of the POM model, was successfully implemented and configured in the ALERMO model. The Variational Initialization (VI) procedure is performed using only the external mode of the “background” field which
OSD
3, 1225–1254, 2006Nesting operational forecasting models in
the Eastern Mediterranean
S. S. Sofianos et al.
Title Page
Abstract Introduction
Conclusions References
Tables Figures
J I
J I
Back Close
Full Screen / Esc
Printer-friendly Version
Interactive Discussion is dynamically optimized to reduce the amplitude of the spyrous external gravity wave
generations during the initialization process. The constrains for the variational initiali-sation of the external mode used in ALERMO are: (1) Optimization of the global diver-gence, (2) optimisation of the surface elevation tendency, and (3) optimisation of the surface elevation tendency as a strong constrain. The extrapolation modulus has also 5
been included.
The ALERMO forecasting system started operations in 1 September 2004, produc-ing 5-days forecast on a weekly basis. Currently the forecast is operated on daily basis with the configuration described above (available athttp://www.oc.phys.uoa.gr). A se-ries of sensitivity experiment (very high resolution atmospheric forcing – 5 km, active 10
versus slave modes of forecasting, etc.) has also been performed as well as model val-idation, in order to evaluate the forecasting skill and perform tuning adjustments. Five high-resolution (∼1.5 km) shelf models are nested in the ALERMO system, among them the CYCOM system described below.
2.2 Cyprus Coastal Model (CYCOM) 15
The domain of CYCOM (Fig. 1) is bounded by coastline on the north and east (maxi-mum latitude of 36.917◦N and maximum longitude of 36.217◦E). The open boundary to the south is the 33.5◦N latitude line, and the open boundary to the west is the 31.5◦E meridian. The grid-spacing is sufficiently small to resolve steep bathymetry in the re-gion as well as features with internal Rossby radius length scales (10–15 km). In the 20
vertical, a non-uniform grid of 25 sigma layers was used with exponentially decreasing spacing near the surface and seabed to provide finer resolution of the surface and bot-tom layers. The botbot-tom topography is based on the 1/60◦×1/60◦high-resolution NOAA (National Oceanic and Atmospheric Administration) charts. The CYCOM is described in detail in Zodiatis et al. (2006).
25
In order to initialize CYCOM, the ALERMO data are downscaled from its lower res-olution, larger domain using VIFOP (Auclair et al., 2000), to reduce the amplitude of the numerical transient processes following the initialization. The procedure for nesting
OSD
3, 1225–1254, 2006Nesting operational forecasting models in
the Eastern Mediterranean
S. S. Sofianos et al.
Title Page
Abstract Introduction
Conclusions References
Tables Figures
J I
J I
Back Close
Full Screen / Esc
Printer-friendly Version
Interactive Discussion within ALERMO (resolution of about 3 km) is identical to that described by Zodiatis et
al. (2006). A passive, one way interaction is used, where the nesting provides for infor-mation to be passed along the open boundaries from the ALERMO coarse grid to the CYCOM high-resolution grid model.
Surface boundary forcing is provided by the SKIRON/Eta 5-day forecast, described 5
above. These daily atmospheric forecasts are used for each new ocean forecast us-ing the bulk flux formulation. Downward shortwave and longwave radiation are used directly from SKIRON, while heat loss terms are calculated from SKIRON-provided pa-rameters. Sensible and latent heat are calculated from Budyko (1963), longwave loss is calculated from Bignami (1995). Evaporation is also calculated from Budyko (1963) 10
and combined with SKIRON-provided precipitation determine a virtual surface salinity flux. Surface momentum fluxes are calculated using the computed drag coefficient of Hellerman and Rosenstein (1983). The daily average results of CYCOM are available on the web sitehttp://www.oceanography.ucy.ac.cy/cycofos//high-resolution.html.
2.3 Experiments 15
Aiming at investigating the efficiency of the nesting and initialization procedures dis-cussed in this section, two sequences of 5-days forecast fields (hereafter called the “slave” mode), initialized every week from the MOGCM, were compared with results obtained from experiments that were initialized only once in the beginning of the se-quence and integrated during the same period (hereafter the “active” mode). In order 20
to reduce the parameters influencing this comparison, the same surface and lateral boundary conditions (obtained by the SKIRON and MOGCM first day forecast fields) were applied in the two experiments.
Two months of the MFS forecasting activities were selected for the slave/active ALERMO experiments, namely September 2004 and January 2005. Each one con-25
tains four 5-days forecasting sets of the forecasting system. They also represent two different seasonal regimes of the Eastern Mediterranean circulation (end of the summer season and winter season, respectively). This way we try to minimize the influence of
OSD
3, 1225–1254, 2006Nesting operational forecasting models in
the Eastern Mediterranean
S. S. Sofianos et al.
Title Page
Abstract Introduction
Conclusions References
Tables Figures
J I
J I
Back Close
Full Screen / Esc
Printer-friendly Version
Interactive Discussion specific seasonal patterns in our results. During the second period (January 2005) the
slave/active experiment was duplicated at the shelf scale with the CYCOM system, in order to investigate the effects of the nesting and initialization procedures at the higher resolution case. It must be also emphasized that this experiment involves the same modelling systems (both systems are based on POM), although some features are dif-5
ferent (e.g. surface fresh water flux), and that the boundary condition from ALERMO are applied in a much larger percentage of the nested model’s boundaries (Fig. 1). The main findings of these experiments are described in the next section and some conclu-sions on the optimisation of the forecasting procedures in the Eastern Mediterranean are derived in the last section.
10
3 Results
Comparison between the different modelling components and experiments is carried out for basic parameters of the various modelling components, such as the domain average kinetic energy, but special emphasis is given on the sea surface conditions where the response to the atmospheric forcing is much faster and differences in circu-15
lation and seawater characteristics are more pronounced. The active/slave experiment results are presented first for September 2004 and next for January 2005, where the regional and shelf experiments are also compared.
3.1 September 2004
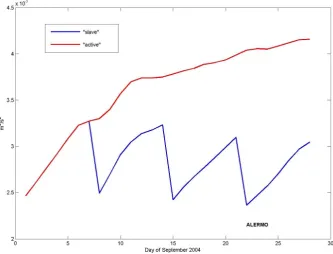
The pattern of the domain mean kinetic energy (Fig. 2) in the “slave” experiment during 20
September 2004 (saw-tooth pattern) is already indicative of the stronger circulation field in ALERMO, in comparison to the MOGCM values providing the initial conditions. This can be explained by the ALERMO’s higher resolution but also the higher resolution of the atmospheric fields forcing the ALERMO model. The basin mean kinetic energy in the “active” experiment increases very fast in the beginning of the experiment and 25
OSD
3, 1225–1254, 2006Nesting operational forecasting models in
the Eastern Mediterranean
S. S. Sofianos et al.
Title Page
Abstract Introduction
Conclusions References
Tables Figures
J I
J I
Back Close
Full Screen / Esc
Printer-friendly Version
Interactive Discussion the rate slows down progressively. After 28 days of integration it reaches a quasi
steady state at values slightly over 4×10⁻³m2s−2. The difference between the MOGCM (indicated by the first day results of the “slave” mode) and ALERMO kinetic energy is remarkable. During the firs day of the fourth “slave” mode cycle MOGCM’s mean kinetic energy in the area of the ALERMO is below 60% of that achieved by the “active” 5
ALERMO experiment.
The circulation pattern differences at the end of the two experiments (also compared with the MOGCM portion in the ALERMO domain) are depicted in Fig. 3, presenting the sea surface elevation field. The main circulation features of the Eastern Mediterranean are reproduced in the forecast of both “slave” and “active” modes, but the structure and 10
intensity of the different features deviates significantly after four weeks of simulation of the “active” mode. The Rhodes Gyre surrounded by the Ierapetra, Mersa Matruh and Shikmona anticyclones are the main features of the Levantine in agreement to regional studies (POEM group, 1992). In the Aegean Sea a complex system of cyclonic and anticyclonic features of smaller scale are identified in the various sub-basins confined 15
by the very complex topography of the region. The most prominent water mass is the Black Sea Water (BSW) characterized by a temperature and salinity minimum (see also Figs. 5 and 6), outflowing from the Dardanelles strait and following a general cyclonic pathway towards the soutwestern Aegean Sea. The sea surface elevation field at the end of the “slave” mode experiment looks very similar to the MOGCM field, indicating 20
the strong influence of the initialization procedure on the ALERMO results after one week of integration. In the “active” mode experiment the scale and intensity of the features (such as the Ierapetra and Rhodes Gyre) are altered, while in the Aegean Sea the cyclonic character and features are stronger.
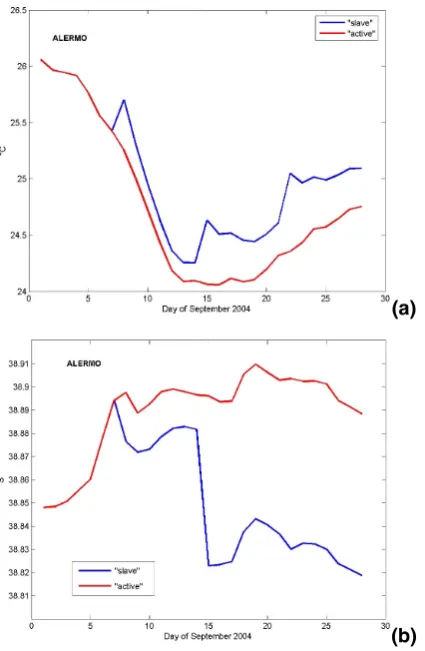
The differences in the circulation between the “slave” and “active” mode experiments 25
are also evident in the sea surface temperature (SST) and salinity (SSS) fields, pre-sented in Figs. 4a, b (domain average SST and SSS, respectively), Fig. 5 (SST in the last day of the experiment for the MOGCM, “slave” and “active” modes) and Fig. 6 (SSS in the last day of the experiment for the MOGCM, “slave” and “active” modes). At the
OSD
3, 1225–1254, 2006Nesting operational forecasting models in
the Eastern Mediterranean
S. S. Sofianos et al.
Title Page
Abstract Introduction
Conclusions References
Tables Figures
J I
J I
Back Close
Full Screen / Esc
Printer-friendly Version
Interactive Discussion end of the experiments the average SST difference is about 0.3◦C and the SSS diff
er-ence is 0.07. These differences are introduced abruptly in the initialization of each cycle (especially in the SSS time series and the third weekly cycle) by the MOGCM, subject to different heat and freshwater interaction with the atmosphere and temperature and salinity corrections through the assimilation procedures. The largest differences are 5
located in the Aegean Sea. The more vigorous circulation of the “active” mode and the stronger outflow of BSW from Dardanelles in the ALERMO system, compared to the MOGCM, generate a cooler and less saline Aegean Sea. The latter is evident comparing the MOGCM fields with both “slave” and “active” modes in Figs. 5 and 6. Other areas of large differences are located in the southeastern Ionian and the Rhodes 10
Gyre/Ierapetra anticyclone general area.
3.2 January 2005
The “slave” versus “active” experiment during January 2005 was duplicated in the CY-COM forecasting system. The CYCY-COM domain is only 11% of the ALERMO one and presents two open boundaries covering almost entirely the western and southern part 15
of the domain. The two systems share the main modelling and initialzation components and the same atmospheric forcing fields. Additionally, since the main flow field is cy-clonic following the western and northern part of the CYCOM domain, the mass trans-port is largely influenced by the boundary-imposed conditions. As a consequence, al-though the “active” mode of the CYCOM experiment is more energetic from the “slave” 20
one (Fig. 7a), the difference of the two experiments in the domain mean kinetic en-ergy is now very small. The positive offset of the “active” mode kinetic energy takes place during the first day of the second cycle and after that remains approximately con-stant. On the other hand in the ALERMO twin experiment the differences in the domain mean kinetic energy observed in the January 2005 experiment (Fig. 7b) are significant, 25
with the “active” mode experiment domain mean kinetic energy being larger by about 1.4×10⁻³m2s−2. The experiment took place during a period of increasing activity and both time series of the domain mean kinetic energy present an increasing trend.
OSD
3, 1225–1254, 2006Nesting operational forecasting models in
the Eastern Mediterranean
S. S. Sofianos et al.
Title Page
Abstract Introduction
Conclusions References
Tables Figures
J I
J I
Back Close
Full Screen / Esc
Printer-friendly Version
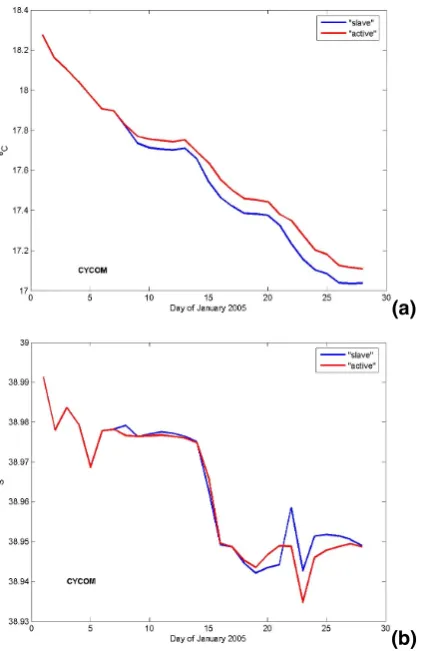
Interactive Discussion Sea surface temperature and salinity fields change very little in CYCOM domain
between the “slave” and “active’ mode experiments (Figs. 8a, b). At the last day of the experiment the average sea surface temperature in the “active” mode is higher by 0.07◦C, while sea surface salinity is almost identical in the end of the two experiments. With the exception of six days close to the end of the active experiment (days 21– 5
26 of the “active” mode experiment) the two time series are extremely close to each other. The main circulation pattern depicted in the sea surface temperature and salinity fields during the last day of the experiment (Figs. 9 and 10) is very similar. The only exceptions are located on the center of the CYCOM domain, southeast from the Cyprus island, and close to the center of the western boundary, where small-scale features 10
developed in the “active” mode experiment (or suppressed due to initialization in the “slave” mode experiment) are altering the sea surface temperature and salinity fields.
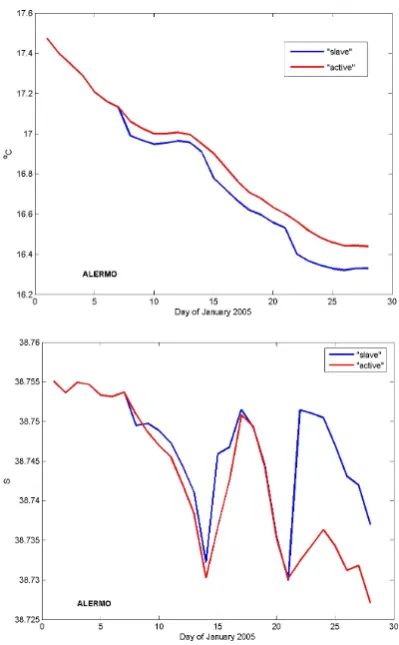
The differences between the “slave” and “active” mode experiments observed in the ALERMO domain are significantly larger (Figs. 11a, b), but perceptively lower than the differences observed at the end of the September 2004 twin experiment. At the 15
end of the two experiments the “active” mode renders a warmer sea surface field by 0.11◦C, while the sea surface salinity field is fresher by 0.01. The largest difference is present in the sea surface salinity field and takes place during the last weekly cycle of the experiment, when an abrupt change takes place in the MOGCM field used for the initialization of the ALERMO. The rest of the experimental period the sea surface salin-20
ity difference is negligible. One of the reasons for the reduction of differences in the water characteristics is the seasonal cycle of the BSW inflow in the Aegean Sea. This twin experiment takes place during the period of minimum BSW inflow and thus dif-ferences in the inflow parameterization between the two models and differences in the strength and pattern of the Aegean Sea circulation do not generate large differences in 25
the sea surface characteristics. The largest difference in the spatial distribution of the sea surface temperature and salinity fields are now located in the area of the Rhodes Gyre (Figs. 12 and 13). Smaller scale eddies are able to develop in the “active” mode experiment, and the Rhodes Gyre area, denoted by low temperature, is significantly
OSD
3, 1225–1254, 2006Nesting operational forecasting models in
the Eastern Mediterranean
S. S. Sofianos et al.
Title Page
Abstract Introduction
Conclusions References
Tables Figures
J I
J I
Back Close
Full Screen / Esc
Printer-friendly Version
Interactive Discussion reduced. This is in agreement with climatological experiments in the Levantine basin
(Lascaratos and Nittis, 1998) showing the effects of resolution on the structure and formation process of the Levintine Intermediate Water (LIW).
4 Summary and conclusions
Trying to optimize nesting procedures between different operational systems is often a 5
difficult task. There is always a compromise between the larger scale system, where larger scale dynamics and budgets have been tested and more data are incorporated in the system through the initialization and assimilation procedures, and the smaller scale system nested, where local expertise and a usually thorough validation and tuning are important for the operational procedures reliability. The new Mediterranean Forecasting 10
System operational activities put to test the above compromise and results can be helpful for other and future applications. In the present work, two systems, namely the ALERMO and CYCOM forecasting systems nested telescopically in the MOGCM, are tested by performing a four-week twin experiment. In the “slave” mode the two systems are initialized on a weekly basis from the MOGCM and the ALERMO respectively, 15
while in the “active” mode the two systems are initialized once, at the beginning of the simulation.
The differences in the domain mean kinetic energy between the “slave” and the “ac-tive” ALERMO experiments are significant in both September 2004 and January 2005 experiments, with the “active” being much more energetic. The increase in the kinetic 20
energy field is of the same order of magnitude during the two periods, mainly produced by the higher resolution of the ALERMO as well as the higher resolution of the atmo-spheric forcing. Although the main pattern of the flow field in the Aegean-Levantine region remains the same, changes in individual features’ structure and local patterns are evident in the “active” mode experiment. Most important changes observed are 25
located in the Aegean Sea, where the very irregular topography of the area, its semi-enclosed character and the presence of important inflowing water masses (BSW and
OSD
3, 1225–1254, 2006Nesting operational forecasting models in
the Eastern Mediterranean
S. S. Sofianos et al.
Title Page
Abstract Introduction
Conclusions References
Tables Figures
J I
J I
Back Close
Full Screen / Esc
Printer-friendly Version
Interactive Discussion rivers) increase the sensitivity of the system. During winter important changes are also
observed in the Rhodes Gyre area, where small-scale eddies developed and surviving in the “active” mode experiment decrease the area of the gyre.
Important temperature and salinity differences between the two experiments are also observed. They are significantly larger during September 2004, mainly due to 5
the stronger inflow of BSW in the Aegean Sea during that period, which is more pro-nounced in the “active” ALERMO results. Changes in the circulation features and the difference of the atmospheric forcing fields between MOGCM and ALERMO (influenc-ing the weekly initialization procedure) are also produc(influenc-ing differences in the sea sur-face temperature and salinity field. They become more important in the areas of strong 10
circulation features and coastal areas.
The CYCOM system domain is a small fraction of the ALERMO domain and presents extensive boundaries at the west and southern end. These features and the fact that both systems share a large number of components make the differences observed in the kinetic energy, sea surface temperature and salinity fields, during the “slave”-15
“active” experiment of January 2005, much smaller. Nevertheless, changes can be observed in time and space, located mostly in the central area of the CYCOM domain. The results discussed above emphasize the need for further investigation of the initialization procedures and tuning of system components and parameterizations. It should be carried in association with model validation with independent observations 20
and improvement of our understanding of the regional dynamics. Changes in the initial-ization procedures could improve the introduction of information from the large-scale dynamics without suppressing dynamical features emerging from the higher resolution local modelling components. The extension of the integration time, with a combination of hindcast and forecast modes, may contribute in this improvement. This extension 25
varies largely in the examples discussed above. While in the CYCOM case it is very small, in the ALERMO case it is about two weeks.
OSD
3, 1225–1254, 2006Nesting operational forecasting models in
the Eastern Mediterranean
S. S. Sofianos et al.
Title Page
Abstract Introduction
Conclusions References
Tables Figures
J I
J I
Back Close
Full Screen / Esc
Printer-friendly Version
Interactive Discussion
References
Auclair, F., Casitas, S., and Marsaleix, P.: Application of an inverse method to coastal modeling, J. Atmos. Oceanic Technol., 17, 1368–1391, 2000.
Bignami, F., Marullo, S., Santoleri, R., and Schiano, M. E.: Longwave radiation budget in the Mediterranean Sea, J. Geophys. Res., 100(C2), 2501–2514, 1995.
5
Blumberg, A. and Mellor, G. L.: A description of a three-dimensional coastal ocean circula-tion model, in: Three-Dimensional Coastal Ocean Models, edited by: Heaps, N. S., Am. Geophys. Union, Washington, DC, 1–16, 1987.
Brasseur, P., Beckers J. M., Brankart J. M., and Schoenauen, R.: Seasonal Temperature and Salinity fields in the Mediterranean Sea: Climatological Analyses of an Historical Data Set,
10
Deep Sea Res., 43(2), 159–192, 1996.
Budyko, M. I.: Atlas of the Heat Balance of the Earth, Academic Press, San Diego, CA, 69, 1963.
Castellari, S., Pinardi, N., and Leaman, K.: A model study of air-sea interactions in the Mediter-ranean Sea, J. Mar. Syst., 18, 89–114, 1998.
15
Castellari, S., Pinardi, N., and Leaman, K.: Simulation of water mass formation processes in the Mediterranean Sea: influence of the time frequency of the atmospheric forcing, J. Geophys. Res., 105, C10, 157–181, 2000.
De Mey, P. and Benkiran, M.: A multivariate reduced-order optimal interpolation method and its application to the Mediterranean basin-scale circulation, in: Ocean Forecasting, Conceptual
20
basis and applications, edited by: Pinardi, N. and Woods, J. D., Springer-Verlag, 2001. Demirov, E., Pinardi, N., DeMey, P., Tonani, M., and Fratianni, C.: Assimilation scheme of
Mediterranean Forecasting System: Operational implementation, Ann. Geophys., 21, 189– 204, 2003.
Hellermann, S. and Rosenstein, M.: Normal wind stress over the world ocean with error
esti-25
mates, J. Phys. Oceanogr. 13, 1093–1104, 1983.
Jourdan, D., Balopoulos, E., Dooley, H., Garcia-Fernandez, M.-J., Maillard, C., Fichaut, M., Baudet, L., and Hassani, A.: The MEDATLAS climatology: Objective analysis of Temperature and Salinity Fields in the Mediterranean Basin, Proc. Ocean Data Symp., October 1997, Dublin, Ireland, 1997.
30
Kallos, G., Sofianos, S., Pytharoulis, I., Katsafados, P., and Skliris, N.: Limited Area Atmo-sphere/Ocean Forecasting System for the East Mediterranean MFSTEP Activities:
OSD
3, 1225–1254, 2006Nesting operational forecasting models in
the Eastern Mediterranean
S. S. Sofianos et al.
Title Page
Abstract Introduction
Conclusions References
Tables Figures
J I
J I
Back Close
Full Screen / Esc
Printer-friendly Version
Interactive Discussion
mance Analysis, June 6–10, 2005, Int. Ocean Res. Conference, UNESCO, Paris, 2005. Korres, G., Lascaratos, A., Hatziapostolou, E., and Katsafados, P.: The Implementation of
an Ocean Forecast System for the Aegean Sea , The Global Atmos. Ocean Syst., 8, 2–3, 191–218, 2002.
Korres, G. and Lascaratos, A.: An eddy resolving model of the Aegean and Levantine basins
5
for the Mediterranean Forecasting System Pilot Project (MFSPP): Implementation and cli-matological runs, Ann. Geophys., 21, 205–220, 2003.
Lascaratos, A. and Nittis, K.: A high-resolution three-dimensional numerical study of intermedi-ate wintermedi-ater formation in the Levantine Sea, J. Geophys. Res., 103(C9), 18 497–18 511, 1998. Madec, G., Delecluse, P., Imbard, M., and L ´evy, C.: OPA version 8. Ocean General
Cir-10
culation Model reference manual. Rapp. Int., LODYC, France, 200, Aucan, J. 1997: Ro-tation de l’op ´erateur de diffusion de quantit ´e de mouvement du code OPA 8.1., Rapport d´ıEnseignement Par la Recherche, ENSTA, 22, 1997.
POEM group: General circulation of the Eastern Mediterranean, Earth-Sci. Rev., 32, 285–309, 1992.
15
Tonani, M.: Studio della predicibilit `a della circolazione del Mar Mediterraneo, PhD thesis, 2003. Zodiatis, G., Lardner, L., Hayes, D., Georgiou, G., Sofianos, S., Skliris, N., and Lascaratos, A.:
Operational coastal ocean forecasting in the Eastern Mediterranean: implementation and evaluation, Ocean Sci., 3, 397–434, 2006.
OSD
3, 1225–1254, 2006Nesting operational forecasting models in
the Eastern Mediterranean
S. S. Sofianos et al.
Title Page
Abstract Introduction
Conclusions References
Tables Figures
J I
J I
Back Close
Full Screen / Esc
Printer-friendly Version
Interactive Discussion Fig. 1.Model domain of the ALERMO and CYCOM models nested telescopically in the
Mediter-ranean OGCM.
OSD
3, 1225–1254, 2006Nesting operational forecasting models in
the Eastern Mediterranean
S. S. Sofianos et al.
Title Page
Abstract Introduction
Conclusions References
Tables Figures
J I
J I
Back Close
Full Screen / Esc
Printer-friendly Version
[image:19.612.69.403.78.332.2]Interactive Discussion Fig. 2. Daily average of the ALERMO domain mean kinetic energy in the “slave” (blue) and
“active” (red) mode experiments during September 2004.
OSD
3, 1225–1254, 2006Nesting operational forecasting models in
the Eastern Mediterranean
S. S. Sofianos et al.
Title Page
Abstract Introduction
Conclusions References
Tables Figures
J I
J I
Back Close
Full Screen / Esc
Printer-friendly Version
[image:20.612.470.597.48.410.2]Interactive Discussion Fig. 3. Sea surface elevation during the last day of the September 2004 experiment from the
MOGCM (upper panel), “slave” mode ALERMO experiment (middle panel) and “active” mode ALERMO experiment (lower panel).
OSD
3, 1225–1254, 2006Nesting operational forecasting models in
the Eastern Mediterranean
S. S. Sofianos et al.
Title Page
Abstract Introduction
Conclusions References
Tables Figures
J I
J I
Back Close
Full Screen / Esc
Printer-friendly Version
Interactive Discussion (a)
[image:21.612.132.345.25.351.2](b)
Fig. 4. Daily average of the ALERMO domain mean sea surface temperature (a) and sea surface salinity(b)in the “slave” (blue) and “active” (red) mode experiments during September 2004.
OSD
3, 1225–1254, 2006Nesting operational forecasting models in
the Eastern Mediterranean
S. S. Sofianos et al.
Title Page
Abstract Introduction
Conclusions References
Tables Figures
J I
J I
Back Close
Full Screen / Esc
Printer-friendly Version
[image:22.612.470.597.48.409.2]Interactive Discussion Fig. 5.Sea surface temperature during the last day of the September 2004 experiment from the
MOGCM (upper panel), “slave” mode ALERMO experiment (middle panel) and “active” mode ALERMO experiment (lower panel).
OSD
3, 1225–1254, 2006Nesting operational forecasting models in
the Eastern Mediterranean
S. S. Sofianos et al.
Title Page
Abstract Introduction
Conclusions References
Tables Figures
J I
J I
Back Close
Full Screen / Esc
Printer-friendly Version
[image:23.612.470.598.43.423.2]Interactive Discussion Fig. 6. Sea surface salinity during the last day of the September 2004 experiment from the
MOGCM (upper panel), “slave” mode ALERMO experiment (middle panel) and “active” mode ALERMO experiment (lower panel).
OSD
3, 1225–1254, 2006Nesting operational forecasting models in
the Eastern Mediterranean
S. S. Sofianos et al.
Title Page
Abstract Introduction
Conclusions References
Tables Figures
J I
J I
Back Close
Full Screen / Esc
Printer-friendly Version
Interactive Discussion (a)
[image:24.612.470.597.48.410.2](b)
Fig. 7.Daily average CYCOM(a)and ALERMO(b)domain mean kinetic energy in the “slave” (blue) and “active” (red) mode experiments during January 2005.
OSD
3, 1225–1254, 2006Nesting operational forecasting models in
the Eastern Mediterranean
S. S. Sofianos et al.
Title Page
Abstract Introduction
Conclusions References
Tables Figures
J I
J I
Back Close
Full Screen / Esc
Printer-friendly Version
Interactive Discussion (a)
[image:25.612.132.348.24.350.2](b)
Fig. 8. Daily average CYCOM domain mean sea surface temperature (a) and sea surface salinity(b)in the “slave” (blue) and “active” (red) mode experiments during January 2005.
OSD
3, 1225–1254, 2006Nesting operational forecasting models in
the Eastern Mediterranean
S. S. Sofianos et al.
Title Page
Abstract Introduction
Conclusions References
Tables Figures
J I
J I
Back Close
Full Screen / Esc
Printer-friendly Version
[image:26.612.470.597.48.409.2]Interactive Discussion Fig. 9. Sea surface temperature during the last day of the January 2005 experiment from the
ALERMO (upper panel), “slave” mode CYCOM experiment (middle panel) and “active” mode CYCOM experiment (lower panel).
OSD
3, 1225–1254, 2006Nesting operational forecasting models in
the Eastern Mediterranean
S. S. Sofianos et al.
Title Page
Abstract Introduction
Conclusions References
Tables Figures
J I
J I
Back Close
Full Screen / Esc
Printer-friendly Version
[image:27.612.470.598.43.423.2]Interactive Discussion Fig. 10. Sea surface salinity during the last day of the January 2005 experiment from the
ALERMO (upper panel), “slave” mode CYCOM experiment (middle panel) and “active” mode CYCOM experiment (lower panel).
OSD
3, 1225–1254, 2006Nesting operational forecasting models in
the Eastern Mediterranean
S. S. Sofianos et al.
Title Page
Abstract Introduction
Conclusions References
Tables Figures
J I
J I
Back Close
Full Screen / Esc
Printer-friendly Version
[image:28.612.135.335.23.346.2]Interactive Discussion Fig. 11. Daily average of the ALERMO domain mean sea surface temperature (a) and sea
surface salinity(b) in the “slave” (blue) and “active” (red) mode experiments during January 2005.
OSD
3, 1225–1254, 2006Nesting operational forecasting models in
the Eastern Mediterranean
S. S. Sofianos et al.
Title Page
Abstract Introduction
Conclusions References
Tables Figures
J I
J I
Back Close
Full Screen / Esc
Printer-friendly Version
[image:29.612.470.597.48.409.2]Interactive Discussion Fig. 12.Sea surface temperature during the last day of the January 2005 experiment from the
MOGCM (upper panel), “slave” mode ALERMO experiment (middle panel) and “active” mode ALERMO experiment (lower panel).
OSD
3, 1225–1254, 2006Nesting operational forecasting models in
the Eastern Mediterranean
S. S. Sofianos et al.
Title Page
Abstract Introduction
Conclusions References
Tables Figures
J I
J I
Back Close
Full Screen / Esc
Printer-friendly Version
[image:30.612.470.597.48.409.2]Interactive Discussion Fig. 13. Sea surface salinity during the last day of the January 2005 experiment from the
MOGCM (upper panel), “slave” mode ALERMO experiment (middle panel) and “active” mode ALERMO experiment (lower panel).