Transport business
statistics
Buses and urban railways largest employers
in the passenger land transport sector
in focus
Aurora Ortega Sanchez
INDUSTRY, TRADE
AND SERVICES
THEME 4-16/2000
SECTORIAL PROFILES
Contents
Few, but large enterprises in
the buses and urban railways
sector 2
The turnover per person
employed is the lowest for the
whole transport industry 3
High personnel costs put a
strain on operating results 4
The domination and the
increasing share of passenger
cars on public transport
services 5
16 buses per 10 thousand
persons on average in the
European Union 6
The passenger land transport sector consists of buses and urban railways,
taxis and coach charter services. Passenger transport by interurban railways
is excluded (see methodological notes).
Main features on the European Union passenger land transport sector:
Higher self-employment rate in taxi operation than in the other
sub-sectors.
Few, but large enterprises in the buses and urban railways sector.
The turnover per person employed was the lowest within the whole
transport industry.
Passenger land transport shows a higher share of personnel costs in
production compared to the other land and road transport sectors.
The high personnel costs put a strain on operating results which also
show a high disparity between Member States.
[image:1.595.222.585.515.657.2]A dominant 90% of passenger-kilometers are made by cars. Only 9% are
made by buses & coaches and 1 % by trams & metros.
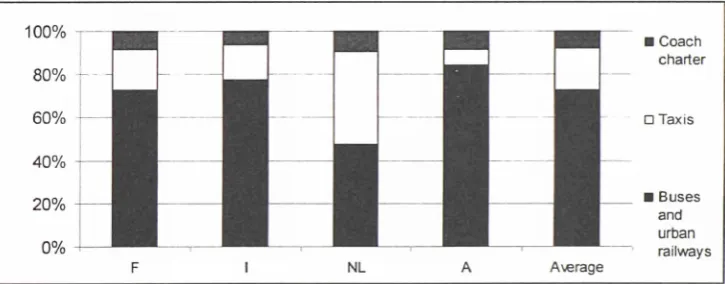
Figure 1: Distribution of persons employed in passenger land transport (various
reference years, see table 2 for details)
* * *
* *
* *
* *
* * *
eure
»stat
Jr
Manuscript completed on: 30.03.2000 ISSN 1561-4840Catalogue number: CA-NP-OO-016-EN-C Price in Luxembourg per single copy (excl. VAT): EUR 6
© European Communities, 2000
Other relevant information highlighted:
• The use of cars increases faster than buses & coaches together with
trams & metros.
EU 15 Β DK D EL E(1) F (2) IRL I L NL(3) A (4) Ρ FIN S (2) UK(5)
Year
1996
1997 1997
1996 1996 1997 1998
1998 1996 1997 (1) Data for 60.22 (2) Data for 60.21. (3) Data for 60.21, (4) Data for 60.21, (5) Data for 60.21,
Few,
Pass
enge land transpon
66911 33648
2285= 176 3085 4187
9022 9594 8471 and 60.23: 1 60.22 and 6 60.22 and 6 60.22 and 6 60.22 and 6
but large enterprises
dumber of enterprises
Buses
and urban t railways
262
3679 1842
2406
66 516
■
988 2401 996 (for 60.21: 0.23: 1994 0.23: 1993 0.23: 1991 0.23: 1996
Taxis
63107 23624
17464
3295 2881
785C 4332 1994)
Coach chartei
3672 119C
298S
245 561
445 167S
in the buses and urban railways sector
(Please note that the figures of the three subsectors. railways, taxis
and coach charter, do not always sum up lo
the aggregate, passenger land transport, due to various reference years shown.)
EU 15 B
DK D EL
E(1) F (2) IRL I L NL A (3)
Ρ FIN
S UK
Year
1997
1996
1996 1996
1996 1996 1993 1998
1998
(1) Data for 60.21: (2) Data for 60.21, (3) Data for 60.21,
NumDer or persons employed Pass
engei land
Buses
and urban
transport railways
27974
173305
136011 1867 58295 3771C
24076
7994
:
1378465265 118295
105384
27805 67986
60.22 and 60.23: 1994 60.22 and 60.23: 1991
Taxis
31012
2237e
24935 5907
Coach charter
38180 13662
8248
[image:2.595.54.582.74.376.2]5555 6982
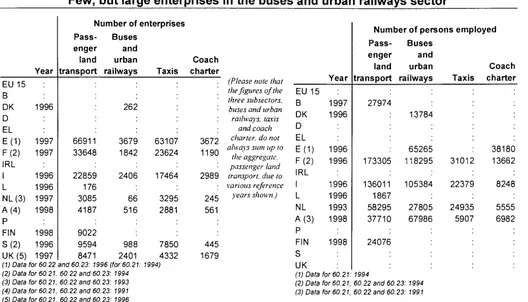
Table 1 : Enterprises population in passenger land transport
Table 2: Employment in passenger land transport
The number of enterprises in the taxi
sector is high compared to the other
subsectors. Indeed, taxi enterprises
are
representing
84%
of
the
enterprises of the sector (8% and 7%
respectively for buses and urban
railways and coach charter). This
has to be put in context to the
number of persons employed: the
taxi enterprises employed only 19%
of the workers in the sector. On the
opposite, the buses and urban
railways sector is much more con
centrated in employing 73% of the
passenger land transport workers.
Amongst Member States where data
are available, Spain and France
have
the
largest
number
of
enterprises, pulled up by the number
of taxi enterprises. France and Italy
are the countries with the highest
number of persons employed.
Few Member States have business
data available on taxis. In Spain
there are 63 thousand enterprises,
while in France there are nearly 24
thousand
enterprises
with
31
thousand persons employed. The
Netherlands has a relatively high
number of persons employed per taxi
enterprise, 7.6, while there are just
1.3
in
France
and
Italy.
Bus
enterprises may also own taxis. One
of the largest Dutch bus enterprises
(Connexxion) runs 4000 buses, but
also 2500 taxis.
The Netherlands has the highest
number of persons employed per
enterprise
in
passenger
land
transport with
18.9 followed by
Luxembourg (10.6) and Austria (9).
Finland (2.7) has the lowest number
of persons employed per company.
Number of enterprises 1
■ Buses & urban railways
Number of persons 1
employed ^ ^ ^ ^ ^ ^ ^ ^ ^ ^ ^ ^ ^ ^ ^ H
0% 20% 40%
O Taxis
60%
■
■ Coach charter
■
[image:2.595.234.576.404.634.2]80% 100%
Figure 2: A sectorial comparison of the number of enterprises (E, F, I, NL, S
and UK) and persons employed (F, I, NL and A)
Figure 3: Number of persons employed per passenger land transport enterprise,
calculated from available data, see table 1 and 2
Statistics in focus — Theme 4 — 16/2000 ■
EU 15 Β DK D EL E(1) F (2) IRL I L NL A (3) Ρ FIN S
Year
1997
1996
1996
1996
1996
1996 1993 1998
1998
UK
(1) Data for 60.23. (2) Data for 60.21, (3) Data for 60.22.
■
Pass· engei land transport
8
16
18 1C
e
11
42
1994 60.22 and 60 1991
Selfemployment rate Buses
and
urbar
railways
1
4 1
a
c
23: 1994
Taxis
77
81
13 C
Coach charter
7 6
43
1 :
EU 15 B(1) DK D EL E F IRL I L NL A (2) Ρ FIN (2) S UK
Year
1997
1996
1996 1996 1997 1998
1998 1996 1996
Unii laboui costs
(1000 ECU
33
33
36 35
24
24 31
Wage adjusted labour productivity (%)
111
76
96 117
128
107
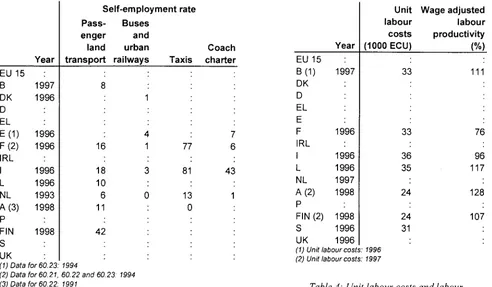
Table 3: Self-employment rate \
(1) Unit labour costs: 1996 (2) Unit labour costs: 1997
Table 4: Unit labour costs and labour
productivity in passenger land transport
The concentration (few and large
enterprises) in buses and urban
railways is confirmed by the low
selfemployment and may be due
to the high infrastructure invest
ments required in this business.
The
taxis
sector
shows
the
opposite tendency, with a high self
employment rate due to the low
costs of entry.
Amongst the 6 Member States for
which data are available, the wage
adjusted
labour
productivity
is
lower than in the road transport sector.
This is a consequence of the higher
share of personnel costs in production
(see page 4). Member States with
higher labour costs in production are
Luxembourg (125%) and Belgium
(84%). The
Luxembourgish
value
would be lower than 100% if the
personnel costs were divided by the
turnover instead.
The unit labour costs in the passenger
land transport
sector
indicate
3
relatively low labour cost countries: the
United
Kingdom,
Austria
and
Finland.
France and Sweden were two
Member
States
with
higher
personnel costs than value added.
This was shown by the low wage
adjusted
labour
productivity
for
France (76%). The relatively low
figure for Italy (96%), but also for
France were due to adjustments of
the selfemployment rate (18% and
16% respectively).
The turnover per person employed is the lowest for the whole transport industry
(1) Number of persons employed: 1993 EU 15
Β DK D EL E F IRL I L NL(1) A Ρ FIN S UK
Year
1997
1996
1996 1996 1997 1998
1998 1996 19 97
Turnove (Mio ECU
1016
7902
3465 66 167C 1624
115C 3285 6717
Turnover per • person employed (1000 ECU)
36
46
30 36 28 43
48
The data available for the subsectors,
provided
by
France,
Italy,
the
Netherlands and the United Kingdom,
show the heavy weight of the buses
and urban railways sector. Its turnover
represents 72% of the passenger land
transport sector to 15% for taxis and
13% for coach charter.
Turnover data for the passenger land
transport sector, the aggregate of the
three subsectors, are provided by 9
Member States. The Member States
with the highest turnover per person
employed are Finland (48 thousand
ECU) and
France (46 thousand
ECU). The Netherlands (28 thousand
ECU) and Italy (30 thousand ECU)
have the lowest results. However,
the other operating ratios will show
other scales (see page 4).
The average turnover per person
employed, amongst the 7 Member
States with data available, is 37
thousand ECU. It was the lowest
figure
for
the
whole
transport
industry. For instance, the road
haulage
and
the
air
transport
industry achieved greater results: 77
thousand ECU and 175 thousand
ECU in 1995.
Table 5: 'Turnover in passenger land transport
^
eurostat
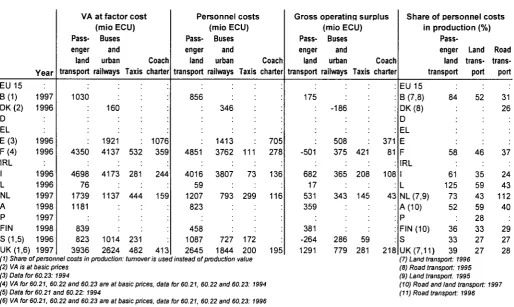
[image:3.595.58.550.33.320.2]High personnel costs put a strain on operating results
One of the major feature of the
passenger land transport sector
is its high level of personnel
costs which are indeed higher
than in the land and road
transport sectors. This can be
shown with the ratio personnel
costs in production: except for
Austria (59% in land transport)
and the Netherlands (112% in
road transport), all available
Member States show that this
ratio is higher than in land and
road transport. This comes from
the situation in the buses and
urban railways sub-sector: the
personnel costs in production
reached 62% to 24% in taxis
and 30% in coach charter.
Luxembourg
and
the
Netherlands have a value added
in production value that is higher
than 100%. This is explained by
large operating subsidies in the
buses
and urban
railways
sector.
EU 15 B ( 1 ) DK(2) D EL E F (3) IRL I L NL A Ρ FIN S (1,4) UK (1,5)
Year 1997 1996 1996 1996 1996 1996 1997 1998 1998 1996 1997
Gross operating rate (%) Pass engei lane transpon 17
-e
2C 26 32 22 33 -8 19 Buses and urban t railways-27 6 15 50
.
16 18 Taxis 49 44 21 1C 3C Coach charter 19 10 20 15:
27VA in production Pass Buses enger and
land transport 101 52 72 162 105 74 66 25 59 urban t railways
23 72 76
•
160 55 60 value Taxis 62 61 68 3S 52(%)
Coach charter 61 51 43 55 51(1) VA in production value: tumoveris used instead of production value (2) VA is at basic prices
(3) VAfor60.21, 60.22 and 60.23 are at basic prices, data for 60.21, 60.22 and 60.23: 1994 (4) Data for 60.21 and 60.22: 1994
[image:4.595.187.562.74.369.2](5) VA for 60.21, 60.22 and 60.23 are at basic prices, data for 60.21, 60.22 and 60.23:1996
Table 6: Gross operating rate and value added in production value (%)
EU 15 B ( 1 ) DK(2) D EL E (3) F (4) IRL I L NL A Ρ FIN S (1,5) UK (1,6) Year 1997 1996 1996 1996 1996 1996 1997 1998 1997 1998 1996 1997
VA at factor cost
Pass enge lano
(mio ECU) Buses r and urban transport railways
103C 435C 4698 76 1739 1181 83S 822 3936
:
160 1921 4137 4173 1137:
1014 2624 Coach Taxis charter532 281 444 231 482 1076 359 244 159 413
Personnel costs
Pass
(mio ECU) Buses enger and lane urban transport railways
856 4851 4016 59 1207 822 456 1087 2646 346 1413 3762 3807
:
793:
:
727 1844 Coach Taxis charter111 72 299 172 20C 705 278 136 116 ■ 195
Gross operating surplus
Pass
(mio ECU) Buses enger and lane urban transport railways
176 -501 682 17 531 359 381 -264 1291 -186 508 375 365 343
:
286 779 Coach Taxis charter421 208 145 59 281 371 81 108 43
:
218S h a r e of personnel costs in production (%)
Pass enger Lane
lane transpor EU 15
Β (7,8) 84 DK (8) D EL E F 58 IRL I 61 L 126
NL (7,9) 72 A (10) 52 Ρ
FIN (10) 36
S 33
UK (7,11) 3S trans t por
52 46 35 59 42 59 28 33 27 27 Road • trans-t port
31 26 37 24 43 112 40
:
29 27 28(1) Share of personnel costs in production: tumoveris used instead of production value (2) VA is at basic prices
(3) Data for 60.23:1994
(4) VA for 60.21, 60.22 and 60.23 are at basic prices, data for 60.21, 60.22 and 60.23: 1994 (5) Data for 60.21 and 60.22:1994
(6) VA for 60.21, 60.22 and 60.23 are at basic prices, data for 60.21, 60.22 and 60.23:1996
(7) Land transport: 1996 (8) Road transport: 1995 (9) Land transport: 1995 (10) Road and land transport: 1997 (11) Road transport: 1996
Table 7: Value added at factor cost, personnel costs, gross operating surplus and share of personnel costs in production for
passenger land transport
Statistics in focus
— Theme 4 — 16/2000 ■
m
[image:4.595.46.561.429.736.2]The high figures on personnel costs
put a strain on operating results and
the first operating balance is even
negative for two Member States:
France and Sweden (-501 and -264
Mio ECU). An inter-sectoral
comparison shows that the gross
operating rate is lower in passenger
land transport than in road transport
as a whole (10% compared to 14%).
These operating ratios also shows a
great disparity between Member
States. The Netherlands and Finland
show the highest rates (32% and
33%) while France and Sweden
show very low rates (-6% and -8%).
These discrepancies can be
explained by the heterogeneous
passenger land transport market
(compared for example to the
integrated road haulage market).
Investment figures are crucial for a
better comprehension of this sector,
especially buses and urban railways,
where the infrastructure costs are
high.
Indeed, for the four Member States
that provide investment data for the
three subsectors, the investment in
tangible goods in buses and urban
railways represented four fifths of the
total investment in the passenger
land transport sector.
The average investment rate for the
passenger land transport (calculated
with available data) is 28% which is
in the same range as road transport
(26%) and land transport (29%).
Member States that have the highest
investment rates are Austria (51%)
and Sweden (50%). It means that
half of the wealth created has been
reinvested.
EU 15
Β
DK
D
EL
E
F
IRL
I
L
NL
A
Ρ
FIN
S
UK(1)
Year
1996
1996
1995
1997
1998
1998
1996
1996
Invest
meni
(mio ECU
1506
1001
16
504
600
240
414
691
Invest-t menInvest-t
rate (%)
35
21
21
29
51
29
50
18
[image:5.595.394.548.43.292.2](1) VA is at basic prices
Table 8: Investment and investment rate
in the passenger land transport sector
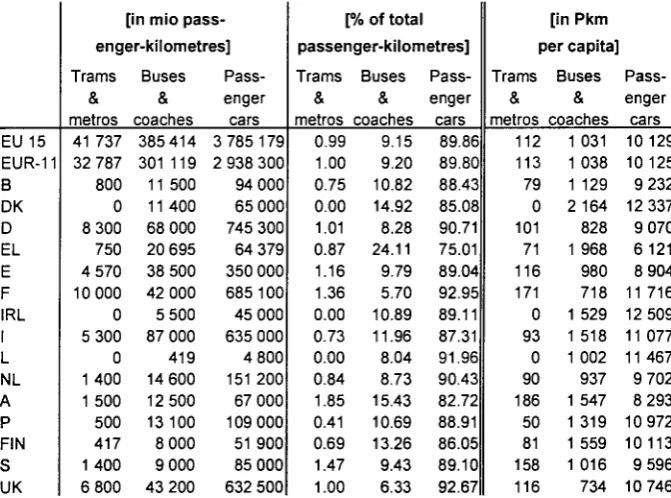
The domination and the increasing share of cars in traffic
Source: Eurostat, Milieu database
The use of cars are dominating in
traffic, with 90% of the
passenger-kilometres in the EU. Only 9% are
made by buses & coaches and 1%
by trams & metros.
However, it is also noted that some
Member States have a greater use of
public transport services. This is
shown when comparing the share of
the demand of land transport (except
railways) expressed in Pkm
(passenger-kilometres) per capita.
Only four Member States are above
the average of 1% for the share of
use of trams and metros: Austria
(1.9), Sweden (1.5), France (1.4) and
Spain (1.2). Portugal is at 0.4%.
The share of the use of buses and
coaches is more important (10%).
Three Member States stand out in
the group: Greece (24%), Denmark
(15%) and Austria (15%). In view of
the relative importance of this type of
vehicles these three Member States
are also these that had less recourse
m
eurostat
EU 15 EUR-11 Β DK D EL E F
IRL
I L
NL A Ρ FIN S UK
[in mio pass enger-kilometres]
Trams
&
metros41 737 32 787 800 0 8 300 750 4 570 10 000 0 5 300 0 1 400 1 500 500 417 1 400 6 800
Buses
&
coaches385 414 301 119 11 500 11 400 68 000 20 695 38 500 42 000 5 500 87 000 419 14 600 12 500 13 100 8 000 9 000 43 200
Pass enger
cars 3 785 179 2 938 300 94 000 65 000 745 300 64 379 350 000 685 100 45 000 635 000
4 800 151 200 67 000 109 000 51 900 85 000 632 500
[% of total passenger-kilometres]
Trams
&
metros0.99 1.00 0.75 0.00 1.01 0.87 1.16 1.36 0.00 0.73 0.00 0.84 1.85 0.41 0.69 1.47 1.00
Buses
&
coaches9.15 9.20 10.82 14.92 8.28 24.11 9.79 5.70 10.89 11.96 8.04 8.73 15.43 10.69 13.26 9.43 6.33
Pass enger cars
89.86 89.80 88.43 85.08 90.71 75.01 89.04 92.95 89.11 87.31 91.96 90.43 82.72 88.91 86.05 89.10 92.67
[in Pkm per capita
Trams
&
metros112 113 79 0 101 71 116 171 0 93 0 90 186 50 81 158 116
Buses
&
coaches1 031 1 038 1 129 2 164 828 1 968 980 718 1 529 1 518 1 002 937 1 547 1 319 1 559 1 016 734
Pass enger
cars 10 129 10 125 9 232 12 337 9 070 6 121 8 904 11 716 12 509 11 077 11 467 9 702 8 293 10 972 10113 9 596 10 746
Table 9: Passenger land transport intensity compared to passenger cars intensity
[1997] (See methodological notes for details about the terminology used)
to cars: 75% for Greece, 83%
Austria and 85% for Denmark.
for
In Greece it is due to the preffered
use of buses, with their high
scheduled traffic intensity and low
fares. The spending on cars is
relatively low in Greece as well.
[image:5.595.214.550.436.685.2]Comparing to the slow growth
of the intensity of use of the
public
transport
services
(0,36% for trams and metros
in 5 years and 1,73% for
buses and coaches in 8
years),
the
increase
for
passenger cars is huge (more
than 10% in 8 years).
Portugal and Greece are the
Member States that have seen
the use of passenger cars the
most increased (+67% and
+27% between 1990 and
1997).
Among the Member States
that have increased the use of
buses and coaches, we find
Austria and Ireland (in both
cases, +37% between 1990
and 1997).
On the opposite, Germany and
the United Kingdom show a
decrease in their use of buses
and coaches services (10%
and 8% in the same period).
1990 1991 1992 1993 1994 1995 1996 1997
[passengerki lometers
Trams
&
metros
111 112 109 113 112
per capita'
Buses
&
coaches 1 014 1 017 1 018 1 008 1 008 1 031 1030 1 031
Pass enger cars 9 053 9 204 9 502 9 600 9 660 9 826 9 951 10 129
[index: 1993 = 100%]
Trams
&
metros
100 100 98 101 100
Buses
&
coaches 101 101 101 100 100 102 102 102
Pass enger
cars 94 96 99 100 101 102 104 106
[image:6.595.26.556.46.437.2]Source: Eurostat, Milieu database
Table 10: Evolution of the intensity of public transport services
compared to passenger cars
: 1993 = 100%]
■Λ Passenger cars
Buses & coaches
Trams & metros
1990 1991 1992 1993 1994 1995 1996 1997
Source: Eurostat, Milieu database
Figure 4: Evolution of the intensity of public transport services
compared to passenger cars (index: 1993 = 100%)
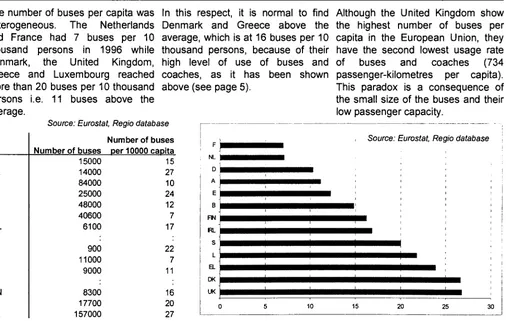
16 buses per 10 thousand persons on average in the European Union
The number of buses per capita was
heterogeneous. The Netherlands
and France had 7 buses per 10
thousand persons in 1996 while
Denmark, the United Kingdom,
Greece and Luxembourg reached
more than 20 buses per 10 thousand
persons i.e. 11 buses above the
average.
In this respect, it is normal to find
Denmark and Greece above the
average, which is at 16 buses per 10
thousand persons, because of their
high level of use of buses and
coaches, as it has been shown
above (see page 5).
Although the United Kingdom show
the highest number of buses per
capita in the European Union, they
have the second lowest usage rate
of
buses
and
coaches
(734
passengerkilometres per capita).
This paradox is a consequence of
the small size of the buses and their
low passenger capacity.
B DK D EL E F IRL
L NL A Ρ FIN S UK
Source: Eurostat, Regio database
Number of buses 15000 14000 84000 25000 48000 40600 6100
900 11000 9000
8300 17700 157000
Number of buses per 10000 capita 15 27 10 24 12 7 17
22 7 11
16 20 27
F
NL
D
A
E
Β
FN
RL
S
L
EL
DK
UK
Source: Eurostat, Regio database
10 15 25 30
Table
11:
Number of buses in 1996
[image:6.595.226.488.52.208.2]S t a t i s t i c s in f o c u s — Theme 4 — 16/2000 ■
Figure 5: Number of buses per 10000 capita in 1996
m
[image:6.595.58.564.450.771.2]> ESSENTIAL I N F O R M A T I O N - M E T H O D O L O G I C A L NOTES
Databases used
Data is extracted from NewCronos, the reference database of Eurostat. This Statistics in focus is based on the annual enterprise statistics (DFT file: enter) being a part of the Structural Business Statistics domain.
Data was also extracted from other Eurostat domains: Theme 1, domain regio, collection tran (number of buses) and Theme 8, domain milieu, collection term, group termd (passenger transport).
60.2A 'Passenger land transport'
This is a sum of three sectors in the NACE Rev. 1 the statistical classification of economic activities. It is at 4digit level. These groups include:
60.2A =
60.21 ('Other scheduled passenger land
transport' or the popular term used here:
'buses & urban railway') +
60.22 ('Taxi operation' or the popular
term used here: 'taxis') +
60.23 ('Other land passenger transport'
or the popular term used here: 'coach charter').
Examples of activities:
(sub)urban transport of passengers on scheduled routes carried out with motor bus, tramway, street car, trolleybus, underground and elevated railways, etc; interurban transport, except by rail, of passenger on scheduled routes; operation of school buses, townto airport/station lines, funicular railways, aerial cableways, etc.
Taxi operation also includes other rental of private cars with operator.
Other land passenger transport includes other nonscheduled passenger road transport, charters, excursions and other occasional coach services.
NACE coverage
'Transport by railways' NACE code
60.1 is excluded because it includes
both passenger and freight transport by interurban railways.
'Road haulage' NACE code 60.24 is
also excluded. Though it is a part of
NACE group 60.2, 'road haulage' only includes freight transport operation by road.
Download NACE Rev. 1 from the web: http://forum.europa.eu.int/Public/irc/dsis/b methods/info/data/new/classifications/nac e en.pdf
'Trams & metros', 'Buses & coaches' and '(Passenger) cars'
Definitions used are taken from the MILIEU database. For this reason, the urban railways ('Trams & metros') are isolated from the buses while those types of vehicles are grouped in the same NACE code (60.21). Similarly, the public transport vehicles ('Buses & coaches')
are grouped together while they belong to two different NACE code (60.21 and 60.23).
1 1 1 1 0 Number of enterprises
A count of the nondormant number of enterprises registered to the population concerned in the business statistics register. This variable refers to all enterprises producing either a market or nonmarket output.
1211 0 Turnover
Turnover comprises the totals invoiced by the observation unit during the reference period. This corresponds to market sales of goods or services supplied to third parties.
12 12 0 Production value
The production value is defined as turnover, +/ the changes in stocks of finished products, work in progress and goods and services purchased for resale, the purchases of goods and services for resale, + capitalised production and other operating income (excluding subsidies).
12 14 0 Value added at basic prices
Value added at basic prices is calculated from the production value plus subsidies on products less the purchases of goods and services (other than those purchased for resale in the same condition) plus or minus the changes in stocks of raw materials and consumables. Value added at basic prices is calculated as follows: Turnover Purchases of goods and services +/ Change in stocks of goods and services + Capitalised production + Operating subsidies linked to products.
12 15 0 Value added at factor cost
Value added at factor cost is calculated by adjusting value added at basic prices for operating subsidies linked to production and duties and taxes linked to production. Value added at factor cost is calculated as follows: Value added at basic prices + Operating subsidies linked to production Duties and taxes linked to production.
12 17 0 Gross operating surplus
Gross operating surplus is the surplus generated by operating activities after the labour factor input has been recompensed. It can be calculated from the value added at factor cost less the
personnel costs. It is the balance available to the unit which allows it to recompense the providers of own funds and debt, to pay taxes and eventually to finance all or a part of its investment.
13 31 0 Personnel costs
Personnel costs are defined as the total remuneration, in cash or in kind, payable by an employer to an employee in return for work done by the latter during the reference period. Personnel costs also include taxes and employees' social security contributions retained by the unit as well as the employer's compulsory and voluntary social contributions. Personnel costs can be calculated as follows: Wages and salaries + Social security costs
16 13 0 Number of employees
This heading is defined as a count of the number of employees. Employees are defined as all persons who, by agreement, work for another resident institutional unit and receive remuneration.
Self-employed person
Selfemployed persons are defined as persons who are the sole owners, or joint owners, of the unincorporated enterprise in which they work.
Self-employment rate
The selfemployment rate equals the number of selfemployed persons divided by the number of persons employed.
16 110 Number of persons employed
This covers all persons both employed and selfemployed.
91 11 0 Per capita productivity
This is "Value added at factor cost" / "Number of persons employed".
91 12 0 Wage adjusted labour productivity
This is gross value added per unit personnel cost: ("Value added at factor cost" / "Personnel costs") χ ("Number of employees" / "Number of persons employed").
91 21 0 Unit labour cost
This is labour costs per employee: "Personnel costs" / "Number of employees".
92 11 0 Gross operating rate
It is calculated as: "Gross operating surplus" / "Turnover".
92 11 3 investment rate
The investment rate is calculated as: "¡nvestment'Vvalue added at factor cost".
Please find more information on the web: http://forum.europa.eu.int/Public/irc/dsis/b methods/info/data/new/coded/en/all busi ness.htm
Further information:
> Databases
New Cronos
Domain: SBS, REGIO, MILIEU
To obtain information or to order publications, databases and special sets of data, please contact the Data Shop network:
B E L G I Q U E / B E L G I Ë D A N M A R K D E U T S C H L A N D E S P A N A F R A N C E I T A L I A - R o m a Eurostat Data Shop
Bruxelles/Bnjssel Planistat Belgique 124 Rue du Commerce Handelsstraat 124
B-1000 BRUXELLES / BRUSSEL Tel. (32-2) 234 67 50 Fax (32-2) 234 67 51 E-Mail: datashop@planistat.be
DANMARKS STATISTIK Bibliotek og Information Eurostat Data Shop Sejrogade 11 DK-2100 KØBENHAVN 0 Tel. (45-39) 17 30 30 Fax (45-39) 17 30 03 E-Mail: bib@dst.dk
STATISTISCHES BUNDESAMT Eurostat Data Shop Berlin Otto-Braun-Straße 70-72 D-10178 BERLIN Tel. (49-30) 23 24 64 27/28 Fax (49-30) 23 24 64 30 E-Mail:
datashop@statistik-bund.de
INE Eurostat Data Shop Paseo de la Castellana, 183 Oficina 009
Entrada por Estèbanez Calderón E-28046 MADRID
Tel. (34-91 )583 91 67 Fax (34-91) 579 71 20 E-Mail: datashop.eurostat@ine.es
INSEE Info Service Eurostat Data Shop 195, rue de Bercy Tour Gamma A F-75582 PARIS CEDEX 12 Tel. (33-1)53 17 88 44 Fax (33-1) 53 17 88 22 E-Mail: datashop@insee.fr
ISTAT
Centro di Informazione Statìstica Sede di Roma, Eurostat Data Shop Via Cesare Balbo, 11 a 1-00184 ROMA Tel. (39-06) 46 73 31 02/06 Fax (39-06) 46 73 31 01/07 E-Mail: dipdiff@istat.it
I T A L I A - M i l a n o L U X E M B O U R G N E D E R L A N D N O R G E P O R T U G A L S C H W E I Z / S U I S S E / S V I Z Z E R A ISTAT
Ufficio Regionale per la Lombardia Eurostat Data Shop
Via Fieno 3 1-20123 MILANO Tel. (39-02) 8061 32460 Fax (39-02) 8061 32304 E-mail: mileuro@tjn.it
S U O M I / F I N L A N D
Eurostat Data Shop Luxembourg BP453
L-2014 LUXEMBOURG 4, rue A Weicker L-2721 LUXEMBOURG Tel.(352)43 35 22 51 Fax (352) 43 35 22 221 E-Mail: dslux@eurostatdatashop.lu
STATISTICS NETHERLANDS Eurostat Data Shop-Voorourg pò box 4000
2270 JM VOORBURG Nederland Tel. (31-70) 337 49 00 Fax (31-70) 337 59 84 E-Mail: datashop@cbs.nl
Statistics Norway Library and Information Centre Eurostat Data Shop Kongens gate 6 P. b. 8131.dep. N-0033 OSLO Tel. (47-22) 86 46 43
Fax (47-22) 86 45 04
E-Mail: datashop@ssb.no
Eurostat Data Shop Lisboa INE/Serviço de Difusão Av. António José de Almeida, 2 P-1000-043 LISBOA Tel. (351-21)842 6100 Fax (351-21) 842 63 64 E-Mail: data.shop@ine.pt
Statistisches Amt des Kantons Zürich, Eurostat Data Shop Bleicherweg 5
CH-8090 Zürich Tel. (41-1)2251212 Fax (41-1) 225 12 99 E-Mail: datashop@zh.ch Internetadresse: http://www.zh.ch/statjstik S V E R I G E U N I T E D K I N G D O M U N I T E D K I N G D O M U N I T E D S T A T E S O F A M E R I C A
Eurostat Data Shop Helsinki Tilastokjrjasto
Postiosoite: PL 2B
Käyntiosoite: Työpajakatu 13 B, 2 krs FIN-00022 Tilastokeskus Tel. (358-9)17 34 22 21 Fax (358-9) 17 34 22 79
S-fXKÜ datashcç tilaslokesJtusfgclastokesiius fi Internetadresse:
M&lhnm tilastokeskus.fi/ttAWdatashcp fumi
STATISTICS SWEDEN Information service Eurostat Data Shop Karlavägen 100-Box 24 300 S-104 51 STOCKHOLM Tel. (46-8)50 69 48 01 Fax (46-8) 50 69 48 99 E-Mail: infoservice@scb.se URL: http://www.scb.se/info/datashop/ eudatashop.asp
Eurostat Data Shop Enquiries & advice and publications
Office for National Statistics Customers & Electronic Services Unit 1 Drummond Gate - B1/05 UK-LONDON SW1V2QQ Tel. (44-207) 533 56 76 Fax (44-1633) 812 762 E-Mat eurostatdatashop@ons.gov.uk
Eurostat Data Shop Electronic Data Extractions, Enquiries & advice - R.CADE Unit 1L Mountioy Research Centre University of Durham UK - DURHAM DH1 3SW Tel: (44-191) 374 7350 Fax: (44-191) 384 4971 E-Mail: r<ade@dur.acuk URL: httpj/www-rcade.dur.ac.uk
HAVER ANALYTICS Eurostat Data Shop 60 East 42nd Street Suite 3310
USA-NEW YORK, NY 10165 Tel. (1-212) 986 93 00 Fax (1-212) 986 69 81 E-Mail: eurodata@haver.com Media Support Eurostat (for professional journalists only).
Bech Building Office A3/48 ■ L-2920 Luxembourg ■ Tel (352) 4301 33408 · Fax (352) 4301 32649 · e-mail: eurostat-mediasupport@cec.eu.int
For information on methodology
Aurora Ortega Sánchez, Eurostat/D2, L2920 Luxembourg, tel. (352) 4301 32032, email: aurora.ortegasanchezi@cec.eu.int, Peter Lindmark, Olivier Bouille, Roland Erixon
ORIGINAL: English
Please visit our web site at www.europa.eu.int/comm/eurostat/ for further information!
A list of worldwide sales outlets is available at the Office for Official Publications of the European Communities.
2 rue Mercier- L-2985 Luxembourg Tel. (352) 2929 42118 Fax (352) 2929 42709 Internet Address http://eur-op.eu.int/fr/general/s-ad.htm e-mail: info.info@cec.eu.int
BELGIQUE/BELGIË - DANMARK - DEUTSCHLAND - GREECE/ELLADA - ESPAÑA - FRANCE - IRELAND - ITALIA - LUXEMBOURG - NEDERLAND - ÖSTERREICH PORTUGAL - SUOMI/FINLAND - SVERIGE - UNITED KINGDOM - ISLAND - NORGE - SCHWEIZ/SUISSE/SVIZZERA - BALGARIJA - C E S K A REPUBLIKA - CYPRUS EESTI - HRVATSKA - MAGYARORSZAG - MALTA - POLSKA - ROMANIA - RUSSIA - SLOVAKIA - SLOVENIA - TÜRKIYE - AUSTRALIA - CANADA - EGYPT - INDIA ISRAEL - JAPAN - MALAYSIA - PHILIPPINES - SOUTH KOREA - THAILAND - UNITED STATES OF AMERICA
Order form
I would like to subscribe to Statistics in focus (from 1.1.2000 to 31.12.2000): (for the Data Shop and sales office addresses see above)
D Formula 1 : All 9 themes (approximately 140 issues)
Π Paper: EUR 360 Π PDF: EUR 264 Π Paper + PDF: EUR 432
Language required: Π DE Π EN Π FR
□ Formula 2: One or more of the following seven themes:
Π Theme 1 'General statistics'
Π Paper: EUR 42 Π PDF: EUR 30 D Combined: EUR 54 □ Theme 2 'Economy and finance'
Π Theme 3 'Population and social conditions' □ Theme 4 'Industry, trade and services □ Theme 5 'Agriculture and fisheries'
O Theme 6 'External trade'
Π Theme 8'Environment and energy
Π Paper: EUR 84 Π PDF: EUR 60 □ Combined: EUR 114 Language required: □ DE Π EN ö FR
Q Please send me a free copy of 'Eurostat MiniGuide' (catalogue containing a selection of Eurostat products and services) Language required: Π DE Π EN Π FR
Q I would like a free subscription to 'Statistical References', the information letter on Eurostat products and services
Language required: Π DE □ EN □ FR
Π Mr Π Mrs D Ms
(Please use block capitals)
Surname: Company: Function: . Address: Post code: Country: Tel.: Email:
Forename: Department:
Town:
Fax:
Payment on receipt of invoice, preferably by: Π Bank transfer
D Visa □ Eurocard
Card No: Expires on:.
Please confirm your ¡ntraCommunity VAT number:
If no number is entered, VAT will be automatically applied. Subsequent reimbursement will not be possible.