DISSERTATION ON
A CRITICAL AND COMPREHENSIVE ANALYSIS
OF TRAUMATIC POSTERIOR FOSSA EXTRA
DURAL HAEMATOMAS
M.Ch. Degree Examination
Branch II Neurosurgery
THE TAMILNADU DR.M.G.R. MEDICAL UNIVERSITY
CHENNAI
This is to certify that the dissertation entitled "A CRITICAL AND
COMPREHENSIVE ANALYSIS OF TRAUMATIC POSTERIOR
FOSSA EXTRA DURAL HAEMATOMAS" was done under our
supervision and is the bonafide work of Dr.K.V.KARTHIKEYAN. It is
submitted in partial fulfillment for the M.Ch Neuro surgery Examination.
Prof.KALAVATHY PONNIRAIVAN, B.Sc., M.D. The Dean
Madras Medical College & Government General Hospital, Chennai - 600 003.
Prof.R.NANDAKUMAR, M.S., M.Ch.,
Prof. of Neurosurgery Institute of Neurology
ACKNOWLEDGEMENT
I immensely thank Prof. R.NANDAKUMAR, Professor of
Neurosurgery in allowing me to conduct this study. I thank him for his expert
guidance. He was a constant source of encouragement throughout the study and
ensured the successful completion of the study.
I thank THE DEAN, Government General Hospital for permitting me to
use the case material for the study.
I Acknowledge Prof.A.R.JAGATHRAMAN, Prof. N. KARTHIKEYAN,
Prof. A. KALIAPERUMAL, Prof.R.ARUN KUMAR, Additional Professors
of Neurosurgery, Govt. General Hospital, Prof. K.DEIVEEGAN, Professor
of Neurosurgery ,Govt Stanley Medical College, Prof.V.G.RAMESH,
Professor of Neurosurgery,Chengelpet Medical college,(Retd)
Prof. M.MOHAN SAMPATH KUMAR, and (Retd) Prof. K.R.SURESH
BAPU, for their help and encouragement during the study period.
I thank all the Assistant Professors of Neurosurgery and fellow post
graduates, Institute of Neurology, Government General Hospital in helping me
to complete the study.
I thank the Staff, Institute of Neurology and Government General
Hospital, Chennai and all others who have helped in completing the study.
CHAPTER NO.
TITLES PAGE NO.
1. AIM OF THE STUDY 1
2. INTRODUCTION 2
3. REVIEW OF LITERATURE 3
4. STUDY MATERIALS AND METHODS 6
5. PROFORMA AND MASTER CHART 10
6. RESULTS AND ANALYSIS OF RESULTS 15
7. DISCUSSION 45
8. CONCLUSION 49
AIM OF THE STUDY
To conduct a critical and a comprehensive analysis of Traumatic
Posterior fossa extra-dural haematomas with special reference to management
INTRODUCTION
Posterior fossa injury is relatively uncommon and accounts for less than
3% of all head injuries. Among traumatic posterior fossa injuries EDH is the
most common, accounting for 10% of all EDHs.
In Pre CT era, Posterior Fossa Extra-dural Haematomas ( PFEDH )
were rarely diagnosed in alive patients. It was very difficult to diagnose based
on clinical picture alone .It is unfortunate since it is an easily preventable cause
of mortality.
From the early days, these lesions had a very high morbidity and
mortality rates. Improvement in diagnostic methods, management protocols:
and treatment modalities have resulted in substantial reduction in mortality and
morbidity and improvement in outcome.
This study was undertaken to achieve these goals in the management of
REVIEW OF LITERATURE
There are many retrospective analysis conducted by pioneering authors
on the presentation of PFEDH, radiological characteristics, guidelines and
protocols for surgical and conservative management for PFEDH.
Article by Mahajan et al (12) - 1983; studied retrospectively, nineteen
surgically treated PFEDH patients with relevance to clinical characteristics and
final outcome. He observed a mortality rate of 15%. He concluded that
admission GCS and associated intra cranial injuries determine higher
mortality rate. He documented good recovery in patients with admission GCS
of 13 to 15
In an another study in India by Mohanty et al (13)-1995, conducted on
24 surgically treated PFEDH .He reported higher incidence of PFEDH in
CHILDREN - 11%., compared to ADULTS - 3%. He concluded that PFEDH
had better outcome than supra-tentorial EDH, in both pediatric and adult age
group. This above finding is not reported in any other study conducted on
PFEDH.
A Large study by Lui et al (11) -1983 , based on surgically treated
PFEDH patients, concluded that mortality was inversely related to
pre-operative GCS and directly related to the age of the patient. Presence of other
Another study of 73 surgically and non-surgically managed PFEDH,
conducted by Bozbuga et al(1)-1999 reviewed surgical decision making based
on CT criterias. He concluded that all the patients with presence of mass effect
in CT over ventricular system should be treated surgically, a criteria published
in almost all studies about PFEDH. Sub-acute clinical presentation resulted in
lesser morbidity and mortality when compared with acute presentation.
Karasawa et al (8)-1997, in a class III study evaluated surgically treated
patients with presence or absence of hydrocephalus and its impact on the final
outcome. He concluded that bilateral lesions and clot thickness more than 15
mm were associated with higher mortality rate. He also documented that
presence of hydrocephalus and temporary placement of Extra ventricular
drainage did not significantly alter the mortality and morbidity of the patients.
Pozatti et al. (12)-1982 study comprising of 32 surgically and non -
surgically treated patients concluded that presence of associated intra-cranial
lesions correlated with poor outcome when compared with pure PFEDH.
Brambilla et al (3)-1983 in his study on surgically treated PFEDH
patients concluded that Brainstem and Basal ganglia injury resulted in higher
mortality. A similar study by Ciurea et al (4)-1993 observed the same
conclusion
Holzschuch and Schunknecht et al (7)-1989 evaluated the clinical and
radiologic characteristics with outcome and concluded that all patients with
clinical signs of occipital trauma should be subjected to CT SCAN Brain in
order to diagnose or rule out PFEDH as early as possible to prevent morbidity
Koc et al. (10) -1998. concluded in his study that lesion size ,
presence of co-existing intra cranial lesions and increasing age were not
associated with prognosis. But the major drawback of this study was that all the
patients were not evaluated with CT.
Thus it is found on reviewing the literature, that there are no
controlled, prospective clinical trials , using surgical versus non-surgical
management of PFEDH. The available data support rapid evacuation of
PFEDH that i) show evidence of mass effect or (ii) result in progressive
neurological dysfunction. The published data so far support expectant
management with the serial imaging for those cases in which there is
neurological stability and no radiological evidence for mass effect.
Hence this study concentrates on latter group and attempts to device a
management plan in the group of PFEDH with no mass effect, and or no
clinical deterioration. In addition, this study analyses the effects of various
variables like shallow posterior fossa, associated injuries, volume of EDH,
presence or absence of occipital fracture, location of fracture, GCS etc in
STUDY MATERIALS AND METHODS
This study was conducted on all the patients admitted with the diagnosis
of PFEDH between May 2003 and July 2006 at the Madras Institute of
Neurology, Madras medical college and Government General hospital,
Chennai. As per above criteria a total number of 69 patients were enrolled in
this study.
Exclusion Criterias:
1. Patients who died before surgery.
2. Patients who were initially admitted in another hospital and then later referred here were excluded due to lack of exact information
regarding clinical condition of the patients.
3. Patients who were not willing for surgery when indicated .
4. Patients who could not be operated because of poor hemodynamic status.
5. Patients who did not complete the entire management protocol in this hospital
6. Associated intracranial head injury, which required surgery other than PFEDH were excluded from this study.
A total of 15 patients were excluded from this study. The remaining 54
patients were enrolled in this study.
A Proforma was formulated to conduct this study and all the patients
enrolled in the study had their necessary parameters filled up in the proforma.
The proforma contained all the necessary informations required for conducting
the study.
All the patients admitted were critically evaluated for their post
resuscitation GCS, age, sex, presence or absence of FND, presence or absence
of other associated injuries. A complete neurological examination was
conducted wherever possible.
All the patients were subjected to X ray of skull AP and Lateral view
and Towne's view .All the patients underwent CT brain with 5 mm PF
thickness slices with bone window. All the patients had X ray cervical spine
and the relevant investigation of the required area was done based on the
associated injuries presnt
All the necessary investigations were repeated as and when necessary
including CT scan Brain based on clinical progress and clinical condition of the
patients.
Based on CT images location of the clot, volume of the clot (ml),
presence or absence of mass effect on 4th ventricle with or without dilatation of
ventricles, occipital bone injuries including fracture and other intracranial
After evaluation , the patients were divided into three groups namely,
Group I Initial surgical management
Group II Conservative management
Group III Initially planned for conservative then treated with surgery
Group I had 14 patients
Group II had 32 patients
Group III had 8 patients
All patients who required surgery (Group I) were assessed for
anaesthetic fitness based on hemodynamic status and blood parameters. They
were subjected to surgery as early as possible. A standard sub occipital burr
hole craniectomy and clot evacuation was performed on relevant area and side.
All the information obtained during surgery were noted in the proforma.
All the patients in Group II were planned for conservative management
and periodic assessment of GCS, development of fresh FND ,B.P assessment,
bradycardia and respiratory abnormality were done.
Routine repeat CT was taken at 6 hours after injury or whenever a new
Based on the above information a master chart was prepared. A critical
statistical analysis of the master chart was done using (i) Chi-square test,
(ii) One way Anova. (iii) Post Hoc test. (iv) Paired T test (v) Independent T test
PROFORMA AND MASTER CHART
PROFORMA
Name Date & Time of injury
Age Date & time of admission
Sex Date of surgery (if done)
I.P. No
M.I.N. No
On admission On deterioration on discharge
GCS
No. of CT scans done :
CT findings CT -1 CT -2
1. Date
2. Volume in ml
3. Presence or absence of ventricular
system dysfunction
4. +/- of Occipital bone injury
Presence or absence of shallow PF
Presence or absence of high cervical injury
MASTER CHART
SURGERY GROUP - GROUP I
No . Ag e Se x GC S CT/EDH Volume (ml) Ass. Injury
Mass effect on Ventricular System
Focal Deficit Due to EDH
High Cervical Injury
+/- of shallow PF
+/- of
Occipital # Mortality
1. 11 F 7 12 – – B.S. (+) – – +
2. 28 M 6 17 – + B.S. (+) – + +
3. 41 M 5 16 – + B.S. (+) – + +
4. 16 M 13 12 – – – – – +
5. 64 M 5 24 + + B.S. (+) + – + +
6. 40 M 14 13 – – C.S. (+) – – +
7. 25 F 4 22 + + B.S. (+) + + + +
8. 36 M 9 13 – + C.S. (+) – + +
9. 18 F 11 12 – + C.S. (+) – – +
10. 8 M 12 14 – + C.S. (+) – – +
11. 32 F 8 12 – + C.S. (+) – – +
12. 51 F 10 11 – – C.S. (+) – + +
13. 4 F 15 10 – + – – – +
14. 21 F 10 12 – – C.S. (+) – + +
CONSERVATIVE GROUP - GROUP II
No
. Age Sex GCS Volume (ml)CT/EDH InjuryAss. Ventricular System Mass effect on Focal Deficit Due to EDH High Cervical Injury shallow PF+/- of Occipital #+/- of Mortality
1. 62 M 4 3 + + B.S. + – + +
2. 3 M 12 3 – – – – + –
3. 24 F 15 6 – – – – + –
4. 18 F 13 5 – – – – + –
5. 6 M 8 4 + – – – – –
6. 9 M 6 3 – – B.S (+) – – –
7. 33 M 14 5 – – – – + +
8. 24 F 10 4 – – – – – +
9. 44 M 15 6 – – – – – +
10. 1½ F 13 3 – – – – – +
11. 37 M 15 7 – – – + + +
12. 11 M 14 7 – – – – – +
13. 40 F 7 6 + – – – + +
14. 13 M 15 6 – – – – – +
15. 48 M 11 7 – – – – + +
16. 4 M 14 8 – – – – – +
17. 53 F 13 7 + – – – + +
No
. Age Sex GCS Volume (ml)CT/EDH InjuryAss. Ventricular System Mass effect on Focal Deficit Due to EDH High Cervical Injury shallow PF+/- of Occipital #+/- of Mortality
18. 30 M 5 7 + – – + – +
19. 42 M 15 6 – – – – + +
20. 60 F 9 4 – – – – – +
21. 21 M 14 6 – – – – + +
22. 49 F 13 6 – – – – – +
23. 23 F 14 7 – – – – + +
24. 35 F 15 7 – – – – – +
25. 50 M 14 6 + – – – – +
26. 19 F 5 6 + – – – – +
27. 57 M 13 4 – – – – + +
28. 39 F 15 7 – – – + – +
29. 51 M 12 5 – – – – + +
30. 7 F 13 4 – – – – – +
31. 40 F 14 5 – – – – + +
32. 27 M 8 4 + – – – – +
INITIAL CONSERVATIVE THEN SURGERY - GROUP III
No
. Age Sex
GCS Volume
AT
Adm After Det 1 st Ct
2nd CT
Associate Injury
Mass effect on
Ventricular System Focal Deficit
Before After Before After
High Cervical
Injury
+/- of
shallow PF occipital+/- of Mortality
1. 16 M 10 8 5 14 – – + – CS+ – – +
2. 6 F 14 14 6 12 – – + – CS+ – + +
3. 60 M 9 8 7 13 – – + – CS+ – + +
4. 23 F 13 4 6 17 – – + – CS+ + – + +
5. 38 M 7 7 8 18 – – + – BS+ – + +
6. 3 F 8 5 6 14 – – – – CS+ – – +
7. 78 M 7 5 4 13 – – + – BS+ – + + +
8. 43 M 9 7 6 17 – – + – BS+ – – +
RESULTS AND ANALYSIS OF RESULTS
Results
Crosstab
Count
7 14 3 24
7 18 5 30
14 32 8 54
[image:19.595.105.515.79.746.2]F M Sex Total Surgery Conservative Cons. then Surgery Group Total Table 2 : Group Vs Sex
Not Significant
Crosstab
Count
12 24 8 44
2 8 0 10
14 32 8 54
– + Associated Injury Total Surgery Conservative Cons. then Surgery Group Total
Table 3 : Group Vs Associated Injury
Not Significant
Table 1 : Group Vs Mortality
Not Significant Crossta b
Coun t
12 31 6 49
2 1 2 5
14 32 8 54
[image:19.595.109.515.179.290.2]TABLE 5 Group Vs FND
Table 5a. Chi - Square Tests
Table 4 : Group Vs Initial Volume
0
8
8
44
17
54
Count 5 3 1 8 4 49 1 0 1
0 1
4 32 8 54
– + Ventricular System Dysfunction Total
Surgery Conser-vative Cons. thenSurgery Group
Total
Not Significant
Count
2 3
0 8 40
1
2 2 0 14
1
4 32 8 54
– + Focal
Deficit
Total
Surgery Conser- vative
Cons.then Surgery Group
[image:20.595.105.522.148.238.2]Total Table 5. Group Vs FND
Chi-Square Tests
35.310a 2 .000
35.360 2 .000
54 Pearson Chi-Square
Likelihood Ratio N of Valid Cases
Value df
Asymp. Sig. (2-sided)
2 cells (33.3%) have expected count less than 5. The minimum expected count is 2.07.
a.
[image:20.595.117.514.513.670.2]Crosstab
Count
12 28 7 47
2 4 1 7
14 32 8 54
[image:21.595.111.517.102.716.2]– + High Cervical Injury Total Surgery Conservative Cons. then Surgery Group Total
Table 6 - Group Vs Cervical Spine Injury
Not Significant
Crosstab
Count
8 18 4 30
6 14 4 24
14 32 8 54
[image:21.595.104.516.123.246.2]– + +/- of shallow PF Total Surgery Conservative Cons. then Surgery Group Total
Table 7 - Groups Vs Shallow PF
Not Significant
Crosstab
Count
0 5 0 5
14 27 8 49
14 32 8 54
– + +/- of occipital
Total Surgery Conservative Cons. then Surgery Group Total Table 8 - Group Vs Occipital Bone Injury
Table 9 - Group Comparison of Age / GCS / Volume
Age - Not significant GCS - Significant Volume - Significant
ANOVA
139.526 2 69.763 .188 .830 18968.349 51 371.928
19107.875 53
79.041 2 39.521 3.505 .037 575.107 51 11.277
654.148 53
793.416 2 396.708 67.727 .000 298.732 51 5.857
1092.148 53 Between Groups Within Groups Total Between Groups Within Groups Total Between Groups Within Groups Total Age GCS Volume Sum of
Squares df Mean Square F Sig.
Table 10 - ANOVA table for Group Comparison
28.2
149.2 17.0618 30.641 18.2174 33.375 26.4464 1 3.5 34 11. 81 3.4 31 9.6 3 2.6 15 14.
29 4.140 5.44 1.458 6.00 1.195
Age GCS Volume Mean Std. Deviation Mean Std.
Table 11 A - Positive list for Group Comparison
Dependent Variable (I) Group (J) Group Significant
Age Surgery Conservative
-Cons. then surgery
-Conservative Surgery
-Cons. then Surgery
-Cons. then Surgery Surgery
-Cons. then Surgery
-GCS Surgery Conservative +
Cons. then surgery
-Conservative Surgery +
Cons. then Surgery
-Cons. then Surgery Surgery
-Cons. then Surgery
-Volume Surgery Conservative +
Cons. then surgery +
Conservative Surgery +
Cons. then Surgery
-Cons. then Surgery Surgery +
Cons. then Surgery
Table 12 - Pre and Post Deterioration value comparison
Mean Significance
Pair GCS 9.63
1 GCS After 7.25 +
Pair Volume 6.00
2 Volume After 14.75 +
Table 13 - Post Deterioration Comparison in between Groups Descrip tives 9. 21 3.5 34 11. 81 3.4 31 7. 25 3.1 05 14.
29 4.140 5.44 1.458 14.75 2.252
GCS After Volume After
Me
an Std. Deviatio n
Me
an Std. Deviatio n
Me
an Std. Deviatio n
Surgery (n = 14) Conservative (n = 32) Cons. then (n = 8)Surgery
ANOVA
162.694 2 81.347 6.976 .002 594.732 51 11.661
757.426 53
1061.101 2 530.551 83.453 .000 324.232 51 6.357
1385.333 53 Between Groups Within Groups Total Between Groups Within Groups Total GCS After Volume After Sum of
Squares df Mean Square F Sig.
Table 13 A - ANOVA
Table 14 - Post Hoc Test for comparison Among Groups
Dependent Variable (I) Group (J) Group Significant
GCS After Surgery Conservative
-Cons. then surgery
-Conservative Surgery
-Cons. then Surgery +
Cons. then Surgery Surgery
-Cons. then Surgery +
Volume After Surgery Conservative +
Cons. then surgery
-Conservative Surgery +
Cons. then Surgery +
Cons. then Surgery Surgery
-Cons. then Surgery +
Table 15 - Ventricular Dysfunction Vs Mortality
Count
Groups
Surgery Conservative Cons. then
Surgery Total Sig
Ventricular - 8 31 1 37 +
After + 9 1 7 17 +
Total 14 32 8 54 +
Table 15a - Chi - Square Tests
Value df Sig
Pearson Chi -Square 30.551a 2 .000 +
Likelihood Ratio 34.096 2 .000 +
N of Valid Cases 54
[image:26.595.108.512.440.591.2]Crosstab
Count
2 30 0 32
12 2 8 22
14 32 8 54
– + Focal Deficit After
Total
Surgery Conservative
Cons. then Surgery Group
[image:27.595.108.521.174.309.2] [image:27.595.107.512.430.610.2]Total Table 16 - FND Vs Group Comparison
Table 16a - Chi - Square Tests
Value df Sig
Pearson Chi -Square 39.133a 2 .000 +
Likelihood Ratio 46.551 2 .000 +
N of Valid Cases 54
Crosstab
Count
42 2 44
7 3 10
49 5 54
– + Associated Injury
Total
- +
Mortality
[image:28.595.107.512.203.306.2]Total Table 17 Associated Injury and Mortality
Table 17a - Chi - Square Tests
Value df Sig
Pearson Chi -Square 6.284b 1 +
Continuity Correction 3.619 1 +
Likelihood Ratio 4.828 1 +
Fisher's Exact Test N of
Valid Cases 54
+
a. Computed only for a 2x2 table
[image:28.595.128.493.402.569.2]Crosstab
Count
42 2 44
7 3 10
49 5 54
[image:29.595.104.522.155.261.2]– + Ventricular System Dysfunction Total - + Mortality Total
Table 18 - Ventricular dysfunction Vs Mortality
Chi-Square Tests
6.284b 1 .012
3.619 1 .057
4.828 1 .028
.039 .039 54
Pearson Chi-Square Continuity Correctiona
Likelihood Ratio Fisher's Exact Test N of Valid Cases
Value df Asymp. Sig. (2-sided) Exact Sig. (2-sided) Exact Sig. (1-sided)
Computed only for a 2x2 table a.
2 cells (50.0%) have expected count less than 5. The minimum expected count is . 93.
b.
Table 18 A
Crosstab
Count
38 2 40
11 3 14
49 5 54
[image:30.595.108.510.160.242.2]– + Focal Deficit Total - + Mortality Total Table 19 - FND Vs Mortality
Chi-Square Tests
3.331b 1 .068
1.663 1 .197
2.888 1 .089
.103 .103 54
Pearson Chi-Square Continuity Correctiona
Likelihood Ratio Fisher's Exact Test N of Valid Cases
Value df Asymp. Sig. (2-sided) Exact Sig. (2-sided) Exact Sig. (1-sided)
Computed only for a 2x2 table a.
2 cells (50.0%) have expected count less than 5. The minimum expected count is 1. 30.
b.
Table 19 A
Crosstab
Count
46 1 47
3 4 7
49 5 54
[image:31.595.98.515.146.263.2]– + High Cervical Injury Total - + Mortality Total Table 20 - High Cervical Injury Vs Mortality
Chi-Square Tests
21.948b 1 .000
15.888 1 .000 14.078 1 .000
.001 .001 54
Pearson Chi-Square Continuity Correctiona
Likelihood Ratio Fisher's Exact Test N of Valid Cases
Value df Asymp. Sig. (2-sided) Exact Sig. (2-sided) Exact Sig. (1-sided)
Computed only for a 2x2 table a.
2 cells (50.0%) have expected count less than 5. The minimum expected count is . 65.
b.
Table 20 A
Chi-Square Tests
.044b 1 .834
.000 1 1.000
.044 1 .833
1.000 .607 54
Pearson Chi-Square Continuity Correctiona
Likelihood Ratio Fisher's Exact Test N of Valid Cases
Value df Asymp. Sig. (2-sided) Exact Sig. (2-sided) Exact Sig. (1-sided)
Computed only for a 2x2 table a.
2 cells (50.0%) have expected count less than 5. The minimum expected count is 2. 22.
b.
Table 21 A
Not Significant
Crosstab
Count
27 3 30
22 2 24
49 5 54
– + +/- of shallow PF
Total
- +
Mortality
[image:32.595.99.512.121.612.2]Total Table 21
+/- of shallow PF Vs Mortality
Crosstab
Count
5 0 5
44 5 49
49 5 54
– + +/- of occipital
Total
- +
Mortality
Total
Table 22 +/- of occipital # Vs Mortality
Chi-Square Tests
.562b 1 .453
.000 1 1.000
1.022 1 .312
1.000 .603 54
Pearson Chi-Square Continuity Correctiona
Likelihood Ratio Fisher's Exact Test N of Valid Cases
Value df Asymp. Sig. (2-sided) Exact Sig. (2-sided) Exact Sig. (1-sided)
Computed only for a 2x2 table a.
3 cells (75.0%) have expected count less than 5. The minimum expected count is . 46.
b.
Table 22 A
[image:33.595.113.491.185.290.2]Ventricular System Dysfunction * Group Crosstabulation
Count
5 31 8 44
9 1 0 10
14 32 8 54
– + Ventricular System Dysfunction Total
Surgery Conservative
Cons. then Surgery Group
[image:34.595.109.499.220.334.2]Total
Table 23 - Ventricular System Dysfunction Vs Group
Chi-Square Tests
26.278a 2 .000
24.601 2 .000
54 Pearson Chi-Square
Likelihood Ratio N of Valid Cases
Value df
Asymp. Sig. (2-sided)
2 cells (33.3%) have expected count less than 5. The minimum expected count is 1.48.
a.
Table 23 A
Group Statistics
28.378 17.3387 50.400 24.8857 7.41 3.476 11.80 10.305 11.24 3.224 6.60 3.782 11.08 3.396 4.40 .548 8.43 4.233 15.80 8.349 Age
Volume GCS GCS After Volume After
Mean Std. Deviation Mean Std. Deviation Alive (n = 49) Died (n = 5)
[image:35.595.137.483.200.354.2]Mortality
Table 24 - Associate of Injury Vs mortality
Independent Samples Test
-2.601 52 .012
-2.128 52 .038
3.025 52 .004
4.357 52 .000
-3.355 52 .001
Age Volume GCS GCS After Volume After
t df Sig. (2-tailed) t-test for Equality of Means
Table 24 A
Sex * Mortality Crosstabulation
Count
22 2 24
27 3 30
49 5 54
F M Sex
Total
Alive Died
Mortality
Total Table 25 Sex Vs Mortality
Descriptives
11.62 3.203 10.07 3.693 11.76 3.492 9.11 3.296 11.38 3.572 9.33 3.922 11.65 3.622 8.78 3.528 6.62 3.548 8.73 5.244 8.00 3.317 7.67 6.595 7.69 4.270 10.07 5.561 9.24 4.521 9.33 6.764 GCS
GCS After Volume Volume After
[image:36.842.268.575.127.264.2]Mean Std. Deviation Mean Std. Deviation Mean Std. Deviation Mean Std. Deviation < 15 (n = 13) 15 - 30 (n = 15) 30 - 50 (n = 17) > 50 (n=9)
Table 26 One way ANOVA
Not Significant
ANOVA
58.190 3 19.397 1.627 .195 595.958 50 11.919
654.148 53
79.578 3 26.526 1.957 .133 677.848 50 13.557
757.426 53
32.138 3 10.713 .505 .680 1060.010 50 21.200
1092.148 53
40.572 3 13.524 .503 .682 1344.761 50 26.895
1385.333 53 Between Groups Within Groups Total Between Groups Within Groups Total Between Groups Within Groups Total Between Groups Within Groups Total GCS GCS After Volume Volume After Sum of
Squares df Mean Square F Sig.
Correlations 1 -.331* . .014 54 54 -.331* 1 .014 . 54 54 Pearson Correlation Sig. (2-tailed) N Pearson Correlation Sig. (2-tailed) N GCS Volume GCS Volume
Correlation is significant at the 0.05 level (2-tailed). *.
Age * Mortality Crosstabulation
Count
13 0 13
13 2 15
17 0 17
6 3 9
49 5 54
< 15 15 - 30 30 - 50 > 50 Age
Total
Alive Died Mortality
[image:38.595.186.431.193.300.2]Total
Table 27 Age Group Vs Mortality
Significant
Chi-Square Tests
9.566a 3 .023
10.080 3 .018
3.217 1 .073
54 Pearson Chi-Square
Likelihood Ratio Linear-by-Linear Association N of Valid Cases
Value df
Asymp. Sig. (2-sided)
4 cells (50.0%) have expected count less than 5. The minimum expected count is .83.
a.
ANALYSIS OF RESULTS
Group I Evaluation of the parameters for the 14 patients revealed
the following details
1 Age Group:
< 15 - 3
15 - 30 - 5
30 - 50 - 4
>50 - 2
2. Sex:
Male - 8
Female - 7
3. GCS
3 - 8 - 6
9 - 12 - 5
4. Volume : All the patients with a volume of more than 10 ml were
subjected to surgery.
5. Associated injury was present only in 2 patients.
6. Ventricular system dysfunction was present in 9 out of 14 patients.
7. All the patients had FND either of Brain stem or cerebellar signs
8. High cervical spine injury was seen in 2 patients
9. Equal distribution of shallow PF was seen in this group
10. All the patients had occipital injury and the fracture was running over
the transverse sinus.
11. Two out of the 14 patients died.
Group II
34 patients in this group were analysed with their parameters and it revealed,
1. Age Group
< 15 - 8
15 - 30 - 8
30 - 50 - 11
2. Sex
Male - 18
Female - 14
3. GCS
3 - 8 - 8
9 - 12 - 5
13-15 - 19
4. All the patients with volume of < 10 ml were treated conservatively
irrespective of other parameter
5. 8 of these patients had associated injuries
6. Occipital bone injury was seen in 27 patients
7. Mortality noted is 2
8. No patients had ventricular system dysfunction or FND
Group III 8 patients in this group evaluated and showed ,
1. Age Group
< 15 - 2
15 - 30 - 2
30 - 50 - 2
>50 - 2
2. Sex
Male - 5
Female - 3
3. GCS (After deterioration)
3 - 8 - 7
9 - 12 - Nil
4. Volume : any post deterioration value of more than 10 ml
5. Almost all patients had ventricular dysfunction and FND
6. Only one mortality occurred in this group
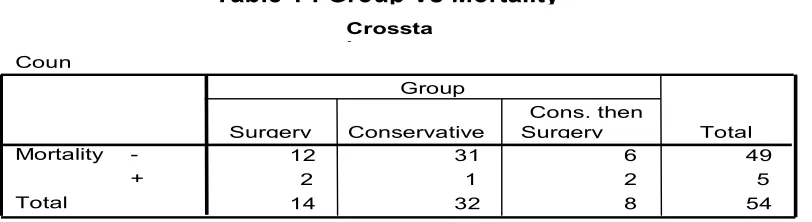
Table 1 Group Vs Mortality
It implies that out of 5 deaths Group I, II, III had 14%,3%,25% of deaths
respectively which is not significant.
Table 2 Groups Vs Sex
All groups had equal sex distribution which again is not significant
Table 3 Group Vs Associated injury
8 Patients in Group I and, 2 patients in Group II had associated injuries
which is not a significant value.
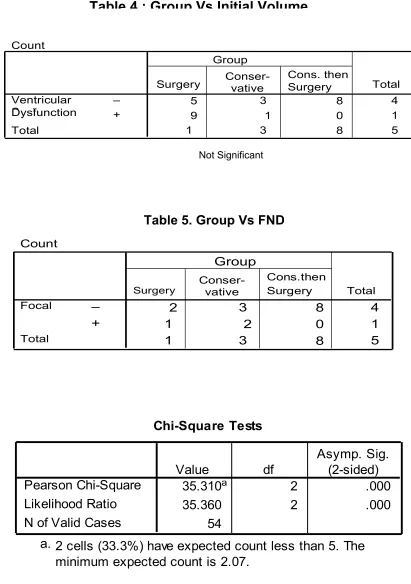
Table 4 Group vs mass effect on ventricles
Patients who underwent early surgery (Group I) had maximum number
of associated ventricular dysfunction. But later 7 out of 8 patients in Group III
had the same finding after deterioration which is significant.
Table 5 Group Vs FND
Out of 22 patients who had FND (in the form of either brain stem signs
only 2 patients in group II had FND. Table 5a indicates significant association
between these two factors.
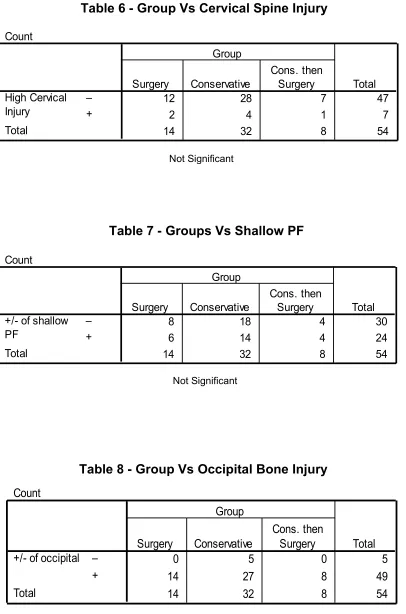
Table 6 Group Vs Cervical spine injury
Shows out of 7 patients who had this injury group II had maximum of
4 patients which is not a significant association.
Table 7 Group Vs + / - of shallow PF
This shows presence of shallow PF is equally distributed in all Groups.
This also is not a significant association.
Table 8 Group Vs Occipital bone injury
49 out of 54 patients had associated occipital bone injury and in all
groups it is equally distributed. The one important finding is that all the patients
who underwent surgery had occipital bone injury which invariably crossed
transverse sinus.
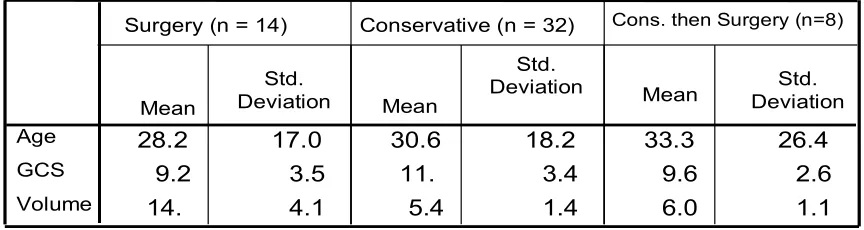
Table 9 Group comparison with Age, GCS & Volume
There was not much of difference in the mean age distribution among
the three groups. Whereas mean initial GCS and mean initial volume
Table 10 ANOVA table for Group comparison
Comparison of mean age, GCS and volume between the groups and
within the group showed age has no significant comparison. But GCS and
volume differ significantly .
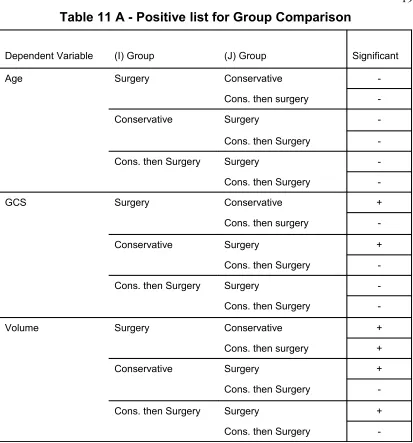
Table 11 On evaluating further table 11 shows, based on GCS ,significant
difference was noted in Group I and II. Also the analysis based on volume
Group I significantly differs from both the other groups.
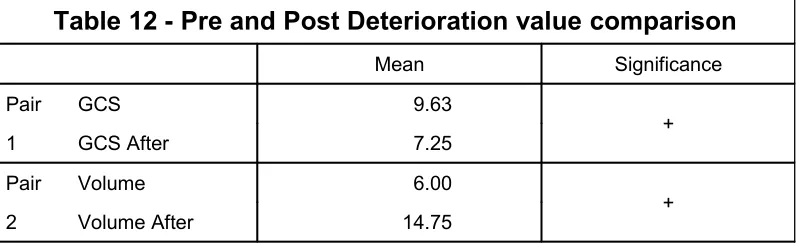
Table 12 Before and after deterioration comparison in Group III
In group III patients, initial GCS and initial volume when compared
with that of post deterioration values, the difference for both the parameters
were significant. In this volume had more significance than GCS.
Table 13 & 13a A Post deterioration comparison between the groups
When the post deterioration values for GCS and volume were compared
with that of group I and II, there was significant difference among these
groups for both the parameters. Mean GCS was 7.25 in patients who were
operated after deterioration. Whereas mean GCS of 9.21 was noted in patients
who were taken up for surgery as initial mode of management. The result
concluded was patients who had an initial GCS of less than that of 12 in Group
III had significant chance of deterioration when compared to patients, who had
more than 12 GCS in the same group. When clot volume was analysed in
Group III patients, patients who had volume of more than 5.54 had higher a
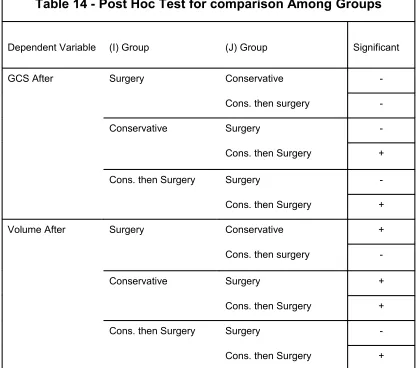
Table 14 Post Hoc test for comparison among groups
When post deterioration values of GCS and volume were compared
among the groups, it showed a significantly lower GCS in Group III than those
of Group II. Whereas volume values of Group II patients were significantly
lower than other groups.
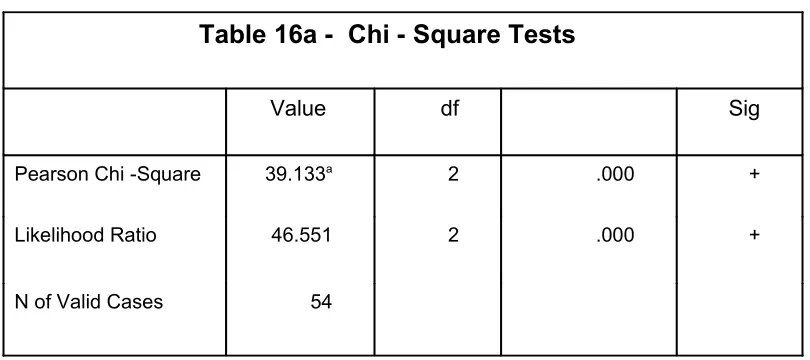
Table 15 , 15 a , 16 , 16a ,23 & 23A
All these tables imply that after deterioration, patients in Group III had
both FND and ventricular system dysfunction appearing as a new finding in all
most all patients. The difference was highly significant for both the parameters.
Because Group III patients had twice the percentage of mortality than Group I
patients.
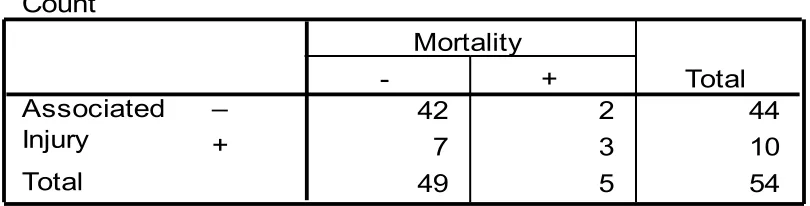
Table 17, 18, 19
Shows 60% of the patients who died in this study had ventricular
dysfunction, associated injury or FND. These parameters were highly
significant either independently or as a combination. Only 25% of the
survived patients had these association.
Table 20
Shows that 80% of the patients who died in this study had high cervical
injury whereas only 7% was seen among the survived patients. The above
spine injury and FND were associated with higher mortality when present
along with PFEDH.
Table 21, 21A
Presence or absence of shallow PF did not affect the mortality rate.
Table 22, 22A
Presence or absence of occipital bone injury did not affect mortality
rate.
Table 24 implies the following findings,
i. Based on age, patients who were above 50 years of age experienced
higher mortality rate than with age less than 28 year. This finding is
independent of other parameters.
ii. Based on GCS, patients who had an initial GCS of less than 6.6 had
higher mortality and an initial GCS more than 11.24 had lower mortality
rates.
iii. Based on volume, patients who had an initial volume of more than 12
mm had higher mortality rate where as volume of less than 7.4 ml had
better survival rate.
The conclusion made was, patients with initial volume of more than
7.41 ml (irrespective of GCS) and patient who had initial GCS of 11.24. When
deterioration these patients had significantly higher mortality rate when
compared to other patients in the same group.
All the findings in this table were highly significant and independent of
other factors.
As per Table 27 : 30% of the patients above 50 years of age
experienced mortality in this study which constitutes them as high risk age
DISCUSSION
Analysing the results with reference to each parameters separately result
in the following informations.
1. The incidence of PFEDH did not vary among the various age groups and sex in this study.
2. There was no direct correlation between the size of PF and the EDH incidence .In other words it does not appear that shallow posterior
fossa or cranio-vertebral junction anamolies show a predisposition
towards development of PFEDH.
3. There was no direct correlation between cervical spine abnormality and injury with PFEDH incidence. But presence of cervical spine
injury consistently resulted in poor outcome .This is probably
because of the independent cervical cord injury resulting in
respiratory and circulatory insufficiency
4. Radiological evidence of occipital bone injury extending above or beyond venous sinuses had a higher clot volume necessitating
surgical decompression and evacuation. This is an important
observation , particularly in those situations where only X ray of
skull was available ( in rural areas),since this calls for vigorous
continuous further investigation and close observation.
6. Patients who presented with FND either on admission or developed at a later stage invariably had higher clot volume necessitating
surgical decompression and evacuation.
7. Associated cervical spine injury had no influence on management but significantly constitute to poor prognosis.
8. Clot volume of PFEDH is the single most significant indicator in the management options.
9. Patients presenting with mass effect in CT because of clot, invariably required surgical decompression and had significantly poor out
come especially in group I and III.
10. All patients in Group 1 had a clot volume of ten ml and above. This is in continuity with the existing literature. Group III patients had
initial clot volume between 7.5 ml and 10 ml.( i.e. the group which
was initially put on conservative therapy and subsequently
deteriorated).
Thus it is seen from our study that the safe volume for PFEDH is 7.5 ml
rather than the usually accepted 10 ml, because all these patients who
deteriorated and underwent surgery had poor outcome, when compared to
conservatively managed Group or even compared to the Group which
underwent direct surgery.
In order to obviate the errors possible when one relies on absolute
volume of EDH ( because of inherent difference in the size of posterior fossa
in different individuals ) and because the clot volume is the single, most
independent parameter in deciding surgical and non-surgical management
options , it will be useful if a critical volume index be determined. This index
can then be used as a guideline , irrespective of skull size . This index will be
particularly useful in those situations where the clot is not producing mass
effect.
This can be calculated by,
CVI for PFEDH =PosteriorClotfossavolumevolume
We have found out the average posterior fossa volume in adults and
children from literature (from the article by SGOUROS et al in JNS, vol 105,
2006), and also independently measured it using normal child and adult skull.
This study relies upon the value of the above mentioned literature because of
the non availability of the diagnostic software for measuring posterior fossa
volume in CT scan. For applying this index for practical purpose needs to be
confirmed with larger studies.
Thus we found that
CVI for normal adult is 0.036.
If the index is more than 0.036 , then that is an absolute independent
Regarding pediatric PFEDH and CVI further work needs to be done to
find out the absolute volume of posterior fossa and critical volume of clot as
an independent marker of surgical intervention. But mathematically we found
that the critical volume of the clot for pediatric age group is 6.1 ml.. But one
has to take into consideration, the non closure of suture and malleability of the
skull while calculating the absolute volume. Larger studies are needed for
CONCLUSION
1. Sex, posterior fossa volume, occipital bone injury had no impact on final outcome.
2. Elderly patients had poor out come irrespective of volume and GCS.
3. Presence of associated injury and high cervical injury though did not influence the management, but constitute significantly to poor
outcome.
4. Mass effect on 4 th ventricle or dilatation of ventricles and FND invariably required surgery and most of the patient usually had poor
outcome.
5. Patient with GCS less than 7 had poor outcome irrespective of the group they are in
6. All the patient with GCS more than 11 had better outcome.
7. In conservative group patients with GCS of 8 to 11 constitute a high risk group for deterioration and poor outcome, if not subjected to
surgery as an initial mode of management.
8. Clot volume of more than 12 ml had poor outcome irrespective of other factors.
10. In conservative group patients with clot volume of more than or equal to 7.4 ml for adult and 6.1 ml for children had higher chance of
deterioration and subsequently had poor outcome if not subjected to
surgery as an initial mode of management.
11. CVI for adult is 0.036
A adult patient with CVI of more than 0.036 deteriorate and
subsequently had poor outcome if not subjected to surgery as an initial
management.
On concluding, Patients in the conservative group who have
1. Age more than 50 years
2. Initial GCS of 8 to 12
3. Initial clot volume more than 7.4 ml
4. CVI more than 0.036
Should undergo surgery as an initial management option in order to
REFERENCES
1. Bozbuga M, Izgi N, Polat G, GurelI: Posterior fossa epidural hematomas Observations on a series of 73 cases. Neurosurg Rev 22:34-40, 1999.
2. Brain Trauma Foundation, American Association of Neurological Surgeons, Joint Section on Neurotrauma and Critical Care: Guidelines for the management of severe traumatic brain injury. J. Neurotrauma
17:457-462, 2000.
3. Brambilla G, Rainoldi F, Gipponi D, Paoletti P: Extradural haematoma of the posterior fossa: A report of eight cases and a review of the literature. Acta Neurochir (Wien) 80:24-29, 1986.
4. Ciurea AV, Nuteanu L, Simioneseu N, Georgesea S: Posterior fossa extra-dural hematomas in children: Report of nine cases. Childs Nerv Syst 9:224-228, 1993.
5. d' Avella D, Servadei F, Scerrati M, Tomei G, Brambilla G, Angileri FF, Massaro F, Cristofori L, Tartara F, Pozzati E, Bruni P, Delfini R, Tomasello F: Traumatic intracerebellar hemorrhages: A clinico-radiological analysis of 81 cases. Neurosurgery 50:16-25, 2002.
6. Ersahin Y, Mutluer S: Posterior fossa extradural hematomas in children.
Pediatric Neurosurg 119:31-33, 1993.
7. Holzschuh M. Schuknecht B:Traumatic epidural haematomas of the posterior fossa: 20 new cases and a review of the literature since 1961.
8. Karasawa H, Furuya H, Naito H, Sugiyama K, Ueno J, Kin H: Acute hypdrocephalus in posterior fossa injury. J Neurosurg 86:629-632, 1997.
9. Kawakami Y, Tamkya T, Tanimoto T, Shimamura Y, Hattori S, Ueda T, Ishida T: Nonsurgical treatment of posterior fossa epidural hematoma.
Pediatr Neurol 6:112-18, 1990.
10. Koc RK, Pasaoglu A, Menku A, Oktem S, Meral M: Extradural hematoma of the posterior cranial fossa. Neurosurg Rev 21:52-57, 1998.
11. Lui T, Lee S, Chang C, Cheng W: Epidural hematomas in the posterior cranial fossa.. J Trauma 34:211-215, 1993.
12. Mahajan R, Sharma B, Khosla V, Tewari M, Mathuriya S, Pathak a, KakV: Posterior fossa extradural haematoma - Experience of nineteen cases. Ann Acad Med Singapore 22:410-413, 1993.
13. Mohanty A, Kolluri V, Subbakrishna D, Satish S, Mouli B, Das B: Prognosis of extradural Haematomas in children. Pediatr Neurosurg
23:57-63, 1995.
14. Neubauer UJ: Extradural haematoma of the posterior fossa. Twelve years experiences with CT-scan. Acta Neurochir (Wien) 87:105-111, 1987.
16. Pang D, Horton J, Herron J, Wilberger JJ, Vries J: Nonsurgical management of extradural hematomas in children. J Neurosurg
59:958-971, 1983.
17. Pozzati E, Grossi C, Padovani R: Traumatic intracerebellar hematomas. J Neurosurg 56:691-694, 1982.
18. Pozzati E, TenettiF, Cavallo M, Acciarri N: Extradural hematomas of the posterior cranial fossa. Observations on a series of 32 consecutive cases treated after the introduction of computed tomography scanning.
Surg Neurol 32:300-303, 1989.
19. Prusty GK, Mohanty A: Posterior fossa extradural haematoma. J Indian Med Assoc 93:255-258, 1995.
20. Rivano C, Altomonte M, Capuzzo T, Borzone M: Traumatic posterior fossa extradural hematomas. A report of 22 new cases surgically treated and a review of the literature. Zentralbl Neurochir 52:77-82, 1991.
21. Roda J, Gimenez D, Perez-I ligueras A, Blazquez M, Perez-Alvarez M: Posterior fossa epidural hematomas: A review and synopsis. Surg Neurol 19:419-424, 1983.
22. Sripairojkul B, Saeheng S, Ratanalert S, Pheunpathom N, Sriplung H: Traumatic hematomas of the posterior cranial fossa. J Med Assoc Thai
81:153-159, 1998.
23. St John JN, French BN: Traumatic hematomas of the posterior fossa. A clinicopathological spectrum. Surg Neurol 25:457-466, 1986.
25. Vrankovic DJ, Splavski B, Hecimovic I, Kristek B: Acute traumatic hematomas of the posterior fossa: Experience with eleven cases. Neurol Croat 43:21-30, 1994.
26. Wang EC, Lim AY, Yeo TT: Traumatic posterior fossa extradural haematomas (PFEDH). Singapore Med J 39:107-111, 1998.
27. Welch K, Strand R: Traumatic parturitional intracranial hemorrhage.
Dev Med Child Neurol 28:156-164, 1986.
28. Wong CW: The CT criteria for conservative treatment - but under close clinical observation - of posterior fossa epidural haematomas. Acta Neurochir (Wien) 126:124-127, 1994.
29. Zuccarello M, Andrioli G, Fiore D, Longatti P, Pardatscher K, Zampieri P: Traumatic posterior fossa haemorrhage in children. Acta Neurochir (Wien) 62:79-85, 1982.
30. Zuccarello M, Pardatscher K, Andrioli GC, Fiore DL, Iavicoli R, Cervellini P: Epidural hematomas of the posterior cranial fossa.