DYSLIPIDEMIA IN CHRONIC KIDNEY DISEASE
CORRELATION TO STAGES OF CHRONIC KIDNEY
DISEASE - AN EVALUATION
DISSERATION SUBMITTED
FORM.D. DEGREE EXAMINATION
BRANCH I – GENERAL MEDICINE
TIRUNELVELI MEDICAL COLLEGE HOSPITAL THE TAMILNADU DR.M.G.R. MEDICAL UNIVERSITY
CERTIFICATE
This is to certify that this dissertation entitled “DYSLIPIDEMIA IN CHRONIC KIDNEY DISEASE– CORRELATION TO STAGES OF CHRONIC KIDNEY DISEASE - AN EVALUATION” is a bonafide record of work done by Dr. SHAFIQUE.A under my guidance and supervision in Tirunelveli Medical College Hospital during
the period of his Post Graduate Study for M.D. (General Medicine) from
2007 – 2010.
Dr.M.R.Vairamuthuraju M.D.,
Additional Professor of Medicine
Department of Medicine
Tirunelveli Medical College Hospital
Tirunelveli.
Dr.J. Kaniraj Peter M.D.,
Professor and Head of the Department
Department of Medicine
Tirunelveli Medical College Hospital
Tirunelveli.
The Dean
Tirunelveli Medical College
ACKNOWLEDGEMENT
I am extremely thankful to our beloved Dean, Dr. A. Kanagaraj.
M.D., for granting me permission to carry out this study in Tirunelveli
medical college.
It is an immense pleasure to acknowledge Dr J. Kaniraj Peter
M.D., Professor and head of the department, Department of Medicine,
who has given the moral support, philosophical guidance and
ever-available help to carry out this study.
With deepest appreciation and gratitude, I thank
Dr.M.R.Vairamuthuraju M.D. My Unit Chief & Additional
professor of medicine and Dr. V. Ramasubramanian. MD.,DM.,
Professor of nephrology, & H.O.D of Nephrology, Tirunelveli Medical
College ,my guide and mentor to carry out this study.
I thank, Professor and staff belonging to the Department of
Pathology for their materialistic support for this study.
I also thank Dr. A. Prince Prabakaran M.D., Dr. A. Ravi M.D.,
and Dr. R. Selvasekaran M.D .,DM., assistant professors, for their moral
support.
Finally with almighty god and with the cooperation of the patients,
TABLE OF CONTENTS
S.No. Title
Page
1 INTRODUCTION 1
2 AIM OF THE STUDY 3
3 MATERIALS AND METHODS 5
4 BACKGROUND OF THE STUDY 19
5 REVIEW OF LITERATURE 20
6 OBSERVATIONS AND RESULTS 50
7 DISCUSSION 66
8 CONCLUSION 69
9 BIBLIOGRAPHY
10 PROFORMA
INTRODUCTION
Cardiovascular disease is a major cause of mortality in patients with
mild to moderate kidney disease and end stage renal disease[ESRD]. The
principal reason to evaluate dyslipidemias in patients with chronic
kidney disease is to detect abnormalities that may be treated to reduce
the incidence of cardiovascular disease.
Since chronic Kidney disease is a progressive disease, the various
lipid abnormalities vary from CKD stages 1- 5 . So it is prudent to look
into various lipid abnormalities attributed to each stages of kidney
disease.
In our hospital, there are many patients admitted last year
fulfilling the criteria for chronic kidney disease and treated as inpatient
or outpatient.
At present the medical treatment for kidney disease is improving
and patients long term survival is improving. Peritoneal dialysis,
hemodialysis and transplantation have revolutioned the prognosis of
Although there is still controversy whether CKD represents an
independent risk factor for incident cardiovascular disease,
accumulating evidence over the last decade marks out cardiovascular
disease as major cause of mortality in patients with mild to moderate
CKD or ESRD.
Dyslipidemia has been established as a well known traditional risk
factor for cardiovascular disease in the General Population and large
scale observational studies have shown that patients with impaired
renal function exhibit significant alterations in lipoprotein metabolism ,
which in their most advanced form may result in the development of
severe Dyslipidemia.
The Study mainly focuses on the lipid abnormalities attributed to
AIM OF THE STUDY
1. To analyze the lipid abnormalities in Patients with Non Diabetic Chronic Kidney Disease.
2. To find the correlation in various stages of Chronic Kidney
disease with Lipid abnormalities.
3. To find which lipid abnormalities is more common in the study
group.
Inclusion criteria for case selection :
¾ All newly detected Non diabetic Chronic kidney disease from Sep
2008 to Sep 2009.
¾ Age Group 15-65yrs.
¾ Elevated Renal Parameters with Urea : Creatinine ratio <20 .
¾ Stable creatinine values taken 4 days apart with variation less than
20 %.
¾ Ultrasonographic evidence of Chronic Kidney Disease with kidney
size less or equal to 9cm .
¾ Normal Values of LDL< 100mg/dl,HDL <40 [M]<50[F]mg/dl;
T. Chol<200mg/dl,TGL-150 mg/dl has been taken cut- off range
Exclusion criteria for the case selection :
1. Patients with known h/o diabetes mellitus and patients with
Diabetic kidney disease , with elevated random blood sugar values
of >200mg% were excluded.
2. Ischemic heart disease on treatment already were excluded.
3. Severe Comorbid conditions like pneumonia, alcoholic Liver
disease and hypotension .
4. Those who are taking Beta blocker and thiazide diuretics at time
of study were excluded.
5. Patients with H/o intake of anti cholestrelomic agents.
6. H/O cigarette smoking.
7. Patients with the features of hypothyroidism and obstructive Liver
disease.
MATERIALS AND METHODS
This study was conducted in Tirunelveli medical college . Patients
are selected from all Medical wards. By applying the inclusion and
exclusion criteria, we selected 50 patients for our study among them.
A detailed history was taken for the following symptoms
suggestive of chronic kidney disease.
¾ General- Fatigue, Weakness, Pruritus, Bone pain.
¾ G.I. tract- Anorexia, Nausea, Vomiting.
¾ Urinary- Nocturia, Polyuria, Oliguria.
¾ CNS-Numbness, Muscle cramps, Irritability, Hiccough, Seizures
and Insomnia.
¾ CVS- Edema, Difficulty in breathing, Chest pain and Giddiness.
An enquiry for a previous history of diabetes mellitus,
hypertension, pulmononary tuberculosis, jaundice, renal disease and drug
intake was made.
The patients were examined clinically for the presence of
l.Anemia
2.Edema
3.Hypertension.
5.Lung signs.
6.Asterixis and other CNS signs.
7.Abdominal Bruit and ascites and
8.Changes in the Optic fundi:
The following investigations were done
¾ Urine -Albumin
¾ Sugar
¾ Deposits
¾ Culture sensitivity
Blood- Urea, sugar
Serum- Creatinine, electrolytes.
TC,DC,ESR, HB, Platelet count.
XRay chest PA and abdomen[whenever necessary] Abdominal
Abdominal Ultrasonogram: This was done in all cases
Screening for the Ischemic Kidney disease were done with the
help of Electrocardiogram and the patients who were all taking the anti
ischemic therapy were excluded, because this treatment alters the serum
lipid levels.
Similarly Beta blockers - raises the serum LDL level without
altering the HDL level.
Thiazide diuretics - raises the triglyceride level and reduce the
We took the blood sample for lipid profile analysis in fasting state
in patients with Chronic Kidney Disease who fulfills the following
criteria.
Fasting lipid profile is taken because eating raises plasma
triglycerides, carried mostly in chylomicrons and very low density
lipoprotein [VLDL] and as result, total cholesterol levels also increase.
The Postprandial increase in cholesterol and triglycerides are variable,
depending on the type of food ingested. ln addition, substantial
variability in postprandial lipid levels is attributable to inherited and
acquired difference between individuals.
Methods used to estimate HDL, Total cholesterol and Triglycerides: Total Cholesterol- Enzymatic method:
Principle : cholesterol esters converted to cholesterol and fatty
acids by cholesterol esterase.
Cholesterol + O2→ choleston-3one +h2o2.
2h2o2+phenolic compound → quinonemine.
The intensity of colured complex produced is directly
proportional to the concentration of cholesterol content which is
measured at 505nm with green filter.
Preparation of working reagent: Dissolve contents of bottle
labeled 1 cholesterol with quantity of 2 cholesterol suggested on the
Mix standard and sample and incubate for 10mts at 37degree.
Read absorbance of standard and test at 505nm.
Test result: interpretated as
Cholesterol concentration = absorbance of test/absorbance of
standard ×200.
HDL cholesterol- Immunoinhibition method:
This reagent is intended for in-vitro quantitative determination of
HDL cholesterol in human serum.
Reagent named as R1,R2 and R3.
Rl contains goods buffer,4AAP,POD,ascorbate oxidase.
R2 contains Goods buffer, CHE,CO,F-DAOS
R3 contains calibrator
Methodology:
Anti human Beta -lipoprotein antibody in reagent 1 binds to
lipoproteins other than HDL. The antigen-antibody complexes formed
block enzyme reactions when R2 is added. Cholesterol esterase and
cholesterol oxidase in R2 react only with HDL-C. Hydrogen peroxide
produced by the enzyme reactions with HDL-C yields a blue coloured
complex upon oxidase condenstation with F-DAOS in the presence of
peroxidase.The intensity of the blue colour complex formed at 593nm is
Triglyceride Estimation :Enzymatic [GPO/Trinder]. Reagent composition :
Reagent 1 TGL Mono reagent.
LGO611 2×20ml : Pipes Buffer
LGO 621 2×50ml : 4-chlorophenol
LGO 631 5 ×100ml : Magnesium ion
ATP
Lipase Peroxidase
Glycerol kinase
4-aminoantipyrine
Glycerol-3-po4 oxidase
Reagent 2 TG standard 200mg/dl
LGO 612 l×2.5ml
LGO 622 l×2.5ml
LGO 632 2×2.0ml.
Principle: The estimation of TGL involves the following enzymatic reaction.
Triglyceride +LPL → Glycerol +FFA
Glycerol + ATP → Glycerol -3-phosphatase +ATP
Glycerol -3 phosphate +02 →DHAP + h2o.
Absorbance of the quinoneimine dye measured at 505nm is
directly proportional to TGL concentrations.
Analysing the sensitivity and specificity of the investigation what
we used in this study, We used Plasma urea, serum creatinine, creatinine
clearance and USG abdomen were the necessary investigation to satisfy
the criteria for the chronic kidney disease.
1) Creatinine Clearance:
The staging of chronic kidney disease been done by measuring
creatinine clearance for a minute.
The renal clearance of the creatinine is the urine creatinine
excretion divided by the area under the plasma creatinine concentration
- time curve for the period in which the urine was sampled. The
creatinine clearance rate more closely resembles the GFR20,15.
The reliability is greatly diminished by
1. Variability of the tubular secretion of creatinine .
2. Inability of most patients to collect the urine properly for 24hrs.
3. Prolonged storage of the urine that falsely rise the urine creatinine
by 20% 17,19,21.
In order to obviate the well known difficulties in obtaining a
complete Urine collection and to have a quick estimate of the GFR when
estimate the GFR via the creatinine clearance predicted from the plasma
creatinine, body weight, age and gender.
In this study we used The Cockcroft & Gault [1996] formula for estimating predicted creatinine clearance for staging CKD patient29.
Creatinine Clearance for men in ml/mt =[140-Age] × Body wt /
S.creat ×72
Age in years
Weight in kgs
Serum creatinine in mg/100ml,for women 85% of the values for men.
2. Equation from the modification of diet in renal disease
study[MDRD]. Estimated GFR (mlmin/1.73m2) = 1.86× (Per) -1.154×
(age )-.2O3
Multiply by 0.742 for women.
Multiply by 1.21 for African Americans.
Estimated GFR[eGFR] using the CKD- EPI formula:
The CKD-EPI (Chronic Kidney Disease Epidemiology Collaboration)
formula was published in May 2009. It was developed in an effort to create a
formula more precise than the MDRD formula, especially when actual GFR
is >60 ml/min per 1.73 m2.18
Researchers pooled data from multiple studies to develop and validate
this new equation. They randomly divided 10 studies which included 8254
16 additional studies, which included 3896 participants, were used for
external validation.
The CKD-EPI equation performed better than the MDRD
(Modification of Diet in Renal Disease Study) equation, especially at higher
GFR, with less bias and greater accuracy. When looking at NHANES
(National Health and Nutrition Examination Survey) data, the median
estimated GFR was 94.5 ml/min per 1.73 m2 vs. 85.0 ml/min per 1.73 m2,
and the prevalence of chronic kidney disease was 11.5% versus 13.1%.
The CKD-EPI equation, expressed as a single equation, is:
GFR = 141 X min(Scr/K,l)α X max(Scr/K, l)-1.209 X 0.993Age X 1.018 [if female] X 1.159 [if black]17
Where Scr is serum creatinine (mg/dl), K is 0.7 for females and 0.9 for
males, α is -0.329 for females and -0.411 for males, min indicates the
minimum of Scr/ic or 1, and max indicates the maximum of Scr/K or 1.
This formula was developed by Levey et al.
Estimated GFR[eGFR] using the Mayo quadratic formula :
Another estimation tool to calculate GFR is the Mayo Quadratic
formula. This formula was developed by Rule et in an attempt to better
estimate GFR in patients with preserved kidney function. It is well
recognized that the MDRD formula tends to underestimate GFR in patients
The other formulas & nomograms in use are 1 Edward & Whyte (1959) formula
Creatinine Clearance for men in ml/mt /1.73m2 = 94.3/sr.creat - 1.8 For women - 85% of the value for men.
2. Jellifes formula 'A'(1971)
Creat Clearance for men in ml/mt/1.73m2 = 100/sr.creat -12. For
women = 80/sr.creat -7.
3. Jellifes formula'B'(1973)
Creatinine Clearance for men in ml/mt/1.73m2=
[98-16(age-20)/20/sr.creat.
4. Hull (1981) formula.
Creatinine clearance for men in ml/mt/70kg =
145-age(yrs)/sr.ceat.-3.
For women = 0.85(145-Age in yrs)/Sr.creat(mg/dl)28.
The formula of Cockcroft & gault formula was quoted in over 70
publications n 1991 and displayed in the 1991 Canadian compendium of
Pharmaceuticals and specialties as the method of estimating renal
functions21.
There are enough published studies in the last 20yrs to reach
functions from the serum creatinine using Cockcroft and gault
formula17,29.
Waller et al in 1991 suggested that the predicted creatinine
clearance provides a simpler alternatives to the measured clearance for
determining the GFR.25
Advantages :
¾ Timed urine collection is avoided
¾ Results are available instantly.
¾ Cost is reduced to less than half of that of the measured Creat
clearance29.
Limitations and possible source of error in this methods :
Age : In children the influence of sex on muscle mass is less important.
The concentration in serum may rise but the creat clearance adjusted to the
body surface area may remain unchanged.
Body Morphology :
Difference between the predicted and the measured creatinine clearance
clearance are seen in very obese , pregnant women and in those with marked
muscle wasting.
Lack of stable renal function :
It means that renal function should not have changed greatly over the
last 4 days. Unstable renal functions is the most frequent problem in the
critical ill, hospitalized patients.
Creatinine assay:
Drugs like salicylate, cotrimoxazole and cimetidine can inhibit tubular
secretion of creatinine and thereby increase the serum creatinine
concentration without a change in the glomerular function.Ingestion of
cooked meat and sternuous exercise may increase the serum creatinine
concentration22,23.
Creatinine secretion:
The mean ratio of the clearance of Tc-DTPA to the measured creatinine
clearance was used 1:24 and was 1:13 with the predicted creatinine clearance
was 13ml/mt for the measured creatinine clearance and 4ml/mt for the
predicted method very little than the regular 24hrs measured method18.
1) Plasma Urea :
Plasma urea is poor measure of the GFR . Urea production is variable
largely depends on the protein intake. Thus the kidneys excrete most of the
urea. It can be readily reabsorbed in the tubules .In conditions like low
impermeable to urea.In conditions with low effective intravascular volume
having high ADH level, the urea reabsorption can be substantial14.
Substances interfering with the urea estimation- falsely high level are
aminosalicylic acid level, bilurubin,lipemia,dextran,uric acid ,free
hemoglobin12,13.
Falsely low level are Vit C, levodopa and lipids .
Serum Creatinine:
It is very insensitive to even substantial decline in GFR. GFR
measured by most accurate technique may be reduced upto 50% before
serum creatinine becomes elevated. It is insensitive because
1. Sr. Creat with muscle mass
Serum Creat value in young &normal individual indicated The
normal GFR. The same level in the elderly individual could indicate a
twofold reduction in GFR.
2. Proportional tubular secretion of serum creatinine increases with
the decreasing GFR.
3. With the declining kidney function extra renal degradation of the
creatinine increases18.
Methods used to measure Serum creatinine:
¾ Original folin-wu method- using jaffe reaction
¾ Method of Hare- using Lloyd reagent
¾ The direct Alkaline Pictrate method.
A number of normal plasma constituents can interfere with
creatinine measurement. They are glucose, pyruvate, acetoacetate, uric
acid, ascorbic acid and plasma proteins. These normal constituents cause
Jaffes calorimetric assay to yield high value. These interfering
chromogens increase the creatinine value by about 20% 23,24.
One study has shown that in normal individuals the contributions
of the nonchromogens in serum creatinine is about 14% and in CKD
patient non chromogen contribution in creatinine is about 5 %.19
Several modifications in Jaffes reaction have done to remove the
interfering chromogens. Fuller earth and ion exchange resins used to
remove the non- chromogens.
These methods are replaced by the costlier and convenient auto
analyzer technique. These technique perpetuates the creatinine from
nonchromogens. In our study we utilized the Auto analyzer method26.
Ultrasonogram abdomen :
The Ultrasonogram features considered evident of chronic renal
failure were
1.Small contracted kidney as evidenced by kidney size equal or less
than 9 cm.
3.Increased echogenicity based upon which the renal parenchymal
disease was graded as follows
Grade 0- normal.
Grade 1- Echogenicity of the renal cortex equal to that of the
liver.
Grade 2- Echogenicity of the renal cortex more than that of the
liver, but less than that of the renal sinus fat.
Grade 3- Echogenicity of the renal cortex approaching that of the
renal sinus fat.
Statistical Analysis :
The Study Subjects were described in terms of percentages and
mean values according to their sex and age. The other required analysis
and inter group variability were made by the respective test of
significance with the usage of the statistical package S.P.S.S. (13.0) at 57
level of significance (p=0.05)
BACKGROUND OF THE STUDY
In Tirunelveli Medical College, Lipid analysis is done in fasting
state mainly for patients having risk of poor cardiovascular outcome.
Experimental and clinical studies have suggested a correlation
between the progression of renal disease and dyslipidemia. High Plasma
cholesterol, LDL and Triglyceride level and low HDL level have been
demonstrated to be independent risk factors for progression of renal
disease from CKD stages 1-5 in humans.
We conducted this study to evaluate the lipid abnormalities in
various stages of chronic kidney disease on the background of these
references.
We used Cock-Croft & Gault (1976) formula to calculate the
predicted creatinine clearance which is a rough estimation of G.F.R. in
REVIEW OF LITERATURE
CHRONIC KIDNEY DISEASE
Introduction :The prevalence of chronic kidney disease (CKD) in India is estimated
at 7572 per million and end stage Kidney disease at 757per million
population, with a staggering financial and social burden. To reduce this
burden and improve patient outcome ,Chronic Kidney disease should be
detected and treated before the onset of kidney failure through investigation
and prompt treatment of CKD3.
Definition of the chronic kidney disease:
A. Kidney damage for 3 months or longer, as defined by structural or
functional abnormalities of the kidney, with or without decreased
glomerular filtration rate manifest by either
1. Pathological abnormalities,
2. Markers of kidney damage, including abnormalities in the
composition of the blood or urine or abnormalities in the imaging
studies.
B. Glomerular filtration rate less than 60ml per minute per 1.73
The Prevalence of chronic kidney disease has increased by 16% from
the previous decade. The increasing incidence of diabetes mellitus,
Hypertension (high blood pressure), obesity and aging population have led
to this increase in kidney disease.
Chronic kidney disease is when one suffers from gradual and
usually permanent loss of kidney function over time. This happens
gradually over time, usually months to years.
Kidney failure occurs when the kidneys partly or completely lose their
ability to carry out normal functions5.
This is dangerous because water, waste, and toxic substances build up
that normally are removed from the body by the kidneys.
It also causes other problems such as anemia, high blood pressure,
acidosis (excessive acidity of body fluids), disorders of cholesterol and fatty
acids, and bone disease in the body by impairing hormone production by the
CAUSES OF CHRONIC KIDNEY DISEASE
Major causes :
Type 1 and Type 2 Diabetes Mellitus Hypertension.1
Other causes :
¾ Glomerulonephritis
¾ Lupus nephritis - Post infectious
¾ Polycystic Kidney Disease.
¾ Tubulo Interstitial Nephropathy
¾ Reflux nephropathy
¾ Hemolytic uremic syndrome/TTP
¾ Vasculitis-Wegeners granulomatosis, Polyarteritis nodosa.
¾ Analgesic nephropathy.
¾ Ischemic nephropathy[atherosclerosis]
¾ Obstructive uropathy5
Rare causes :
HIV infection, Sickle cell disease, heroin abuse, kidney stones,
amyloidosis and cancer.
Risk Factors For CKD: ¾ Ethnicity
¾ Smoking
¾ Heavy consumption of the non- narcotic analgesics.
¾ Family history of CVD.
¾ Increased renin angiotensinogen activity
¾ Thrombogenic factors- antiplatelet agent.
Clue to diagnosis of Chronic disease by analyzing History of the patient
l.Review of symptoms :
Symptoms during urination : usually suggests disorders of urinary
tract such as Infections, obstructions or stones.
Recent Infections :
Suggests post-infectious glomerulonephritis or HIV associated
nephropathy.
Skin rashes or arthritis :
Suggests connective tissue disorder like SLE or cryoglobilunemia.
Risk factors for parenteraly transmitted disease :may suggests HIV ,
Hep B , Hep C or associated kidney disease.
2.Chronic diseases :
Heart failure , Cirrhosis, or gastroindestinal fluid losses -usualy
suggests reduced kidney perfusion.
Diabetes - starts as microalbminuria then clinical proteinuria and
Hypertension - Hypertensive nephrosclerosis characterized by severly
elevated blood pressure followed by end organ damage Recent worsening
of hypertension in background of diffuse atherosclerosis indicates large
vessel disease. Recent onset of severe HT in young females suggests
fibromuscular dysplasia48.
3.Past Medical History :
Findings from Past routine exam – indicates proteinuria or HT
during childhood, during pregnancy, schooling.
Past urological evaluation - gives details regarding radiological
abnormalities associated with kidney disease.
4. Family history of Kidney Disease :
Every generation, equal susceptibility to male and female- indicates
autosomal dominant disease like polycystic kidney disease.
Every generation, male susceptibility- indicates sex linked
recessive disorder like Alports syndrome.
Less frequent than every generation - indicates autosomal recessive
disease like medullary cystic disease or Autosomal recessive Polycystic
Types and Examples of Risk factors for chronic Kidney diseases1.
Definition Examples
Susceptibility
factors
Increase susceptibility to
kidney damage
Older age, family history
Initiation
factors
Directly initiate kidney
damage
DM. High BP, autoimmune
disease, systemic infection.
UTI, urinary stone, drug
toxicity
Progression
factors
Cause worsening kidney
damage and faster decline
in kidney function after
initiation of kidney
damage .
Higher level of proteinuria;
High BP, poor glycemic
STAGES OF CHRONIC KIDNEY DISEASE10 :
Stage Description GFR
ml per m2
Prevalence in
(%)
Action
- At increased risk >60ml(CKD
risk factors)
- CKD risk
reduction
1 Kidney damage
with normal or
increased GFR
>90 5,900,000(3.3) Diagnosis
and treatment:
treatment of the
comorbid
condition.
Slowing
the progression
2 Kidney damage
with slightly
decreased GFR
60-89 5.300,000(3) Estimating the
progression
3 Moderately
decreased GFR
30-59 7,600,000(4.3) Evaluating and
treating the
complication
4 Severely
decreased GFR
15-29 400,000(0.2) Preparation for
kidney
replacement
therapy
5 Kidney failure < 15 300,000 Kidney
Prevalence of GFR Categories in Adults Age Group (yr)
GFR
mL/min/1.73 m 20-39 40-59 60-69 570
>90 86.0% 55.7% 38.5% 25.5%
60-89 13.7% 42.7% 53.8% 48.5%
30-59 a 1.8% 7.1% 24.6%
15-29 a a a 1.3%
N (millions): 82 55 20 20
GFR estimated from serum creatinine using MDRD Study equation
based on age, gender, race and calibration for serum creatinine. Data from
NHANES III (1988-1994). N = 15,000. Based on one-time assessment of
estimated GFR.
Fewer than 20 cases; data not considered reliable.
KDOQI Guidelines for Normal GFR in various age groups10 Normal GFR in Children and Young Adults
Age (Sex) Mean GFR±SD(mL/min/1.73 m*)
1 week (males and females) 4O.6 ±14.8
2—8 weeks (males and females) 65.8 ±24.8
>8 weeks (males and females) 95.7 ±21.7
2—12 years (males and females) 133O±27.O
13—21 years (males) 14O.O ±3O.O
13—21 years (females) 126.O ±22.0
Abbreviation: SD, standard deviation
Clinical situations in which creatinine clearance may be necessary
to measure GFR
1. Extremes of age and body size
2. Severe malnutrition or obesity
3. Disease of skeletal muscle.
4. Paraplegia or quadriplegia.
5. Vegetarian diet.
6. Rapidly changing kidney function
7. Prior to dosing drugs with significant toxicity, that are excreted by
kidneys.
Lipoprotein Metabolism:
Lipids circulating in Plasma are incorporated into spherical, water
soluble particles [lipoproteins]that contain a core of nonpolar lipids
[cholesterol, cholesterol ester and triglycerides] surrounded by a
monolayer composed of specific proteins, polar lipids and esterified
cholesterol and phospholipids9.
The Protein components of lipoproteins are called apoproteins.
Some of these apoproteins, such as apoprotein A-l in HDL, apoprotein
Metabolic function of Plasma Apoproteins:
Apoproteins Metabolic Role
A-l Activates LCAT
A-11 Activates hepatic lipase;may inhibit
LCAT
A-lV unknown
B-48 Transport of lipids from the gut as
chylomicrons.
B-100 Transport of lipids from the Liver as
VLDL and LDL
C-1 Activates LCAT
C-11 Activates Lipoprotein Lipase.
C-lll May inhibit activation of lipoprotein
lipase by apoC-11
D May be involved in lipid transfer
between lipoproteins.
E Recognised by hepatic apo E receptors
and cellular receptors;
Cholesterol Transfer protein Facilitates the exchange of cholesterol
esters and TGL between HDL and
Four enzymes play pivotal role in lipid metabolism: ¾ Lipoprotein Lipase
¾ Hepatic triglyceride lipase
¾ Lecithin-cholesterol acyltransferase
¾ Cholesteryl ester transfer protein32,16.
The major action of Lipoprotein lipase is to degrade TGL rich
particles in the postprandial state.
Hepatic lipase has 2 major actions : l] hydrolysis of TGL and
phospholipids of HDL2.and2]hydrolysis of TGL of VLDL and IDL.
Hepatic lipase catalyzes hydrolysis and removal of the
triglyceride content of HDL. Thus hepatic lipase deficiency can
potentially contribute to increased HDL, triglyceride content. In fact,
as described later (abnormalities of lipoprotein remnants), CRF results
in pronounced hepatic lipase deficiency in humans and experimental
animals33,34.
The enzyme LCAT, which is synthesized in the liver, catalyses the
formation of cholesterols esters in the plasma by transferring a fatty acyl
chain from phospholipids to the hydroxyl group of unesterified
cholesterol.
LCAT plays an important role in HDL-mediated cholesterol
uptake from the extrahepatic tissues and, as such, serves as a main
Thus LCAT deficiency can potentially account for diminished plasma
HDL cholesterol and impaired HDL maturation in CRF. In fact, plasma
LCAT activity is consistently diminished in patients with ESRD. This
is accompanied by a significant elevation of plasma-free cholesterol
and a marked reduction in plasma esterified cholesterol concentration,
providing functional evidence for diminished LCAT-dependent
cholesterol esterification33,34.
The specific transfer protein, CETP, facilitate exchange of
cholesterol esters and TGL between HDL and VLDL and LDL
CETP mediates transfer of cholesterol ester from HDL to IDL in
exchange for triglycerides. Thus a potential increase in plasma CETP
can contribute to the CRF-associated reduction in HDL cholesterol
ester and elevation of HDL triglycerides. In fact, according to a recent
study, more than 34% of hemodialysis-dependent patients were found
to have high plasma CETP levels. The mechanism responsible for the
reported elevation of CETP in ESRD patients is unknown and requires
future investigation. The effect of CRF is amplified by proteinuria,
which has been shown to increase synthesis and markedly raise plasma
concentration of CETP. Thus plasma CETP is expectedly elevated in
patients with heavy proteinuria and mild to severe renal
Metabolism of Very Low density Lipoproteins:
The Liver is the main site of VLDL synthesis . VLDL particles transport
endogenous TGL from the liver to peripheral tissues. The Intravascular
hydrolysis of VLDL, TGL depends on the activity of Lipoprotein Lipase. LDL
is the major product of VLDL metabolism in Human plasma. Diet, freefatty
acids, plasma concentration of insulin, glucagon, and epinephrine modulate
the secretion of VLDL16
Friedewald formula to calculate LDL:
The Friedewald formula appears to be the most practical, reliable
method for determining LDL cholesterol in clinical practice:
LDL = Cholesterol - HDL- (triglycerides ÷ 5), in mg/dl, or
LDL = Cholesterol-HDL- (triglycerides÷2.19), in mmol/l32.
Two recent studies found the Friedewald formula to be reliable in
dialysis patients, although other investigators reported that the percentage
error for the formula is higher in patients with CKD compared to the general
population. No studies have examined the accuracy of the Friedewald formula
in transplant recipients, or studies in other CKD patients, eg, those with
nephrotic syndrome.
Recent data from a study in the general population suggest that the
Friedewald formula may underestimate LDL in patients with low LDL levels.
Data from the general population also suggest that the Friedewald formula is
measurement of LDL with ultra-centrifugation or immunoprecipitation
techniques is reasonably accurate when triglycerides are 400-800 mg/dl
(4.52-9.03 mmol/l), but there are no reliable techniques for determining LDL
when triglycerides are >800 mg/dl ( > 9.03 mmol/l). Fasting triglycerides
>800 mg/dl (>9.03 mmol/l) generally indicate the presence of
hyperchylomicronemia, and the role of hyperchylomicronemia in ACVD is
unknown36.
There are few studies in children, and none included children with CKD.
However, in 1 study of children from the general population, calculating LDL
using the Friedewald formula was more reliable in correctly classifying
patients with high LDL than was the direct measurement.
LDL is the major cholesterol carrying particle present in the
plasma. The liver accounts for 70% of the catabolism of LDL and
peripheral tissues account for the remaining 30%.The uptake of LDL by
receptor mediated endocytosis cholesterol biosynthesis, an enhanced rate
of intracellular cholesterol esterifications, and a reduction in the number
of High affinity LDL receptors expressed on the cell surface30.
Metabolism of High density-Lipoprotein: HDL is generated in the liver from the intravascular lipolysis of VLDL particles and
chylomicrons. The newly synthesized HDL contains predominantly
protein, free cholesterol, and phospholipids. The apoprotein content of
A-1[HDL2] and apo A-11[HDL3]. Some contains only apo A-l. The half life
of HDL is for 4-6days. Epidemological studies in the general population
documented an inverse relationship between Plasma HDL cholesterol
concentration and risk of coronary heart disease33,16.
Hepatic SRB-1 is the primary pathway for disposal of
HDL-borne cholesterol ester and triglycerides. Therefore, potential
dysregulation of this protein can impact HDL metabolism. Heavy
glomerular proteinuria has been shown to significantly reduce hepatic
SRB-1 protein expression in experimental animals. In contrast, CRF
per se, without heavy proteinuria, induced by nephrectomy, does not
significantly change SRB-1 mRNA or protein abundance in the liver.
However, concomitant heavy proteinuria and renal insufficiency may
affect SRB-1 expression and hence, HDL-mediated reverse cholesterol
transport16.
HDL-mediated cholesterol uptake from the extrahepatic tissues
depends on deesterification of cholesterol esters contained in the
intracellular vesicles and the resultant release of free cholesterol. This
process is opposed by ACAT, which is the main enzyme for
intracellular esterification of cholesterol. Therefore, a relative
increase in ACAT activity can potentially limit HDL-mediated
cholesterol uptake and, hence, contribute to the reduction in plasma
of CRF on ACAT expression and activity in the extrahepatic tissues is
not known, CRF has been recently shown to markedly raise hepatic
ACAT-2 mRNA and protein abundance, as well as total ACAT
activity33,16.
The potential contribution of ACAT to the CRF-induced
dysregulation of HDL metabolism was illustrated by a recent study
which revealed that pharmacological inhibition of ACAT results in a
dramatic shift in plasma cholesterol from apoB-containing
lipoproteins to HDL with virtually no change in plasma total
cholesterol in CRF animals. Interestingly, the improvement in the
lipid profile with an ACAT inhibitor was accompanied by a
significantly higher creatinine clearance in the treated than the
untreated animals. This phenomenon may be due to amelioration of
dyslipidemia and enhanced HDL-mediated reverse cholesterol
transport, leading to attenuation of glomerulosclerosis.
Abnormalities of Lipoprotein metabolism in Chronic Kidney disease.
The dyslipidemia found in CKD patients is usually secondary to
their renal disease. The family history provide link to genetic component.
Some lipid abnormalities are demonstrable in patients with renal disease
The most frequent constellation of lipid abnormalities in CKD
comprises a decrease in HDL- cholesterol, an increase in VLDL andIDL
cholesterol, as well as normal LDL- cholesterol [reflects a redistribution
of cholesterol from HDL to VLDL and IDL]. The ratios of Total
cholesterol /HDL cholesterol and LDL cholesterol /HDL cholesterol are
usually increased16,33 .
The reduced level of HDL reflects reduction of both HDL 2 and
HDL 3 subfractions. In CKD, a defect in cholesterol transport, probably
due to diminished LCAT activity and increased activity of CETP, have
been documented. The recently proposed index of NON HDL
cholesterol, reflecting the sum of LDL and VLDL particles appears to be
more sensitive and is a superior predictor of cardiovascular risk.
Hypertriglyceridemia is commonly found in CKD and is the result
of both increased synthesis of TGL and VLDL apo B-100 apoprotein in
the liver and decreased catabolism of VLDL. Increased TGL and VLDL
apo B 100 synthesis in the liver were documented in animal experiments
and in CKD patients.
Quantitative changes in Plasma Lipid Profile:
1. Moderate elevation of Plasma TGL concentrations.
2. Low plasma HDL-cholesterol concentrations.
3. High Plasma VLDL and IDL- cholesterol
The activity of lipoprotein lipase in plasma and in adipose tissue is
decreased in animal experiments and in patients with CKD, even when
the plasma TGL is normal. The activity of lipoprotein lipase is
influenced by apolipoprotein isoforms, apoprotein C -11 activates and
apoprotein C-lll inhibits lipoprotein lipase activity. A decreased ratio
of apo C-ll and apo C-lll is observed even in early stages of CKD.
Reduced activity of lipoprotein lipase explains the disturbed first step in
the breakdown of both chylomicrons and of VLDL . Because of reduced
activity of hepatic TGL lipase, the clearance of partially metabolised
lipoproteins and chylomicrons is disturbed as well7.
Aporprotein abnormalities in CKD:
The concentrations of apo A-l and apo A-ll are decreased. In
hemodialysis patients it has been documented that decreased apo A1
levels are due to an increased rate of catabolism, whereas reduced apo
A-ll levels are primarily due to decreased rate of production. These
apoprotein abnormalities are more marked in patients with advanced
renal insufficiency and in patients with hypertriglyceridemia. The apo B concentrations are usually normal in early stages of CKD and are minimally elevated, at best in patients with advanced renal insufficiency. The ratio of apoA-l/C-111 and apo A-l/B are reduced, and the ratio of apoC-lll/apoE is increased. Similar abnormalities of apo
Qualitative Lipoprotein changes in CKD:
Post ribosomal modification of apolipoproteins by oxidation,
glycation and carbamylation. Oxidation does not reduce the affinity of
oxidized LDL to the scavenger receptors and oxidized LDL uptake by
the macrophage scavenger receptor is increased favouring foam cells.
Oxidised LDL exhibits additional atherogenic properties including
cytotoxicity and stimulation of thrombotic as well as inflammatory
events.HDL protects against the oxidation of LDL. In hemodilayis patient
the capacity of HDL patients to prevent LDL oxidation is reduced. The
acute phase response changes the HDL composition , transforming HDL
from an antioxidant to a pro-oxidant lipoprotein. The reported
alterations include an increase in apolipoprotein and serum amyloid A
and a decrease paraxonase activity and Platelet activating factor. Serum
paraxonase activity reduced in patients with CKD.
IDL, an intermediate of VLDL catabolism accumulates in CKD
patients. The IDL concentration is a predictor of severity or progression
of atherosclerosis.
LDL particles are heterogenous in size and density. No correlation
was found between LDL concentration and LDL size. Small dense LDL
accumulate even in early stages of CKD, when total plasma cholesterol
Several theories have been proposed regarding the link between
small dense LDL and atherogenicity. l] Their decreased affinity to the
LDL receptor combined with their clearance with the scavenger
receptor. 2]Their increased susceptibility to oxidation and glycation.
3]Their increased transcapillary escape because of smaller particle size16. In CKD patients, Clearance of Chylomicrons is severly impaired.lt
has been postulated that postprandial persistence of chylomicrons in the
circulation causes endothelial damage and promotes atherosclerosis.
This abnormality may contribute to hypertriglyceridemia in CKD5,7.
LP[a] lipoprotein is a plasma lipoprotein , which contains a protein
component called apo[a]. In the general population Lp[a] in high
concentration associated with increased cardiovascular risk. ln patients
with CKD, prospective studies on the influence of plasma Lp[a]
concentrations on atherosclerotic complications have yielded conflicting
results9.
Progression of renal disease in relation to dyslipidemia:
Hyperlipidemia can potentially accelerate progression of renal
disease by several mechanisms. First, reabsorption of fatty acids,
phospholipids, and cholesterol contained in the filtered proteins
(albumin and lipoproteins) by tubular epithelial cells can stimulate
tubulointerstitial inflammation, foam cell formation, and tissue
mesangium can promote matrix production and glomerulosclerosis.
In this context, native and oxidized lipoproteins, particularly LDL,
stimulate production of matrix proteins by cultured mesangial cells
and promote generation of proinflammatory cytokines, which can
lead to recruitment and activation of circulating and resident
macrophages. In addition, impaired HDL-mediated reverse
cholesterol transport can further contribute to tissue injury by
limiting the unloading of the excess cellular cholesterol and
phospholipid burden. In fact, low plasma HDL has been identified as
an independent risk factor for progression of renal disease. Moreover,
hereditary LCAT deficiency, which is associated with a marked
reduction in HDL cholesterol and impaired HDL-mediated reverse
cholesterol transport, results in progressive renal disease. It is of note
that both chronic renal insufficiency and nephrotic syndrome lead to
acquired LCAT deficiency and impaired HDL metabolism. Correction
of these abnormalities by ACAT inhibitor administration has been
shown to reduce proteinuria and retard progression of renal disease in
experimental animals43,44.
In addition to the animal studies, a number of clinical studies
have provided evidence for the potential contribution of dyslipidemia
in progression to renal disease. For instance, the Physicians Health
of renal function among individuals with mildly elevated baseline
serum creatinine who had elevated serum cholesterol and/or reduced
HDL cholesterol concentrations. Similarly, the Modification of Diet in
Renal Disease (MDRD) study identified low plasma HDL cholesterol as
an independent risk factor for progression of renal disease. Together,
these observations have prompted a limited number of clinical trials
exploring the effect of lipid-lowering agents in humans with chronic
kidney disease (CKD).
Changes in proteinuria, GFR, and treatment of CKD may alter
lipoprotein levels. Therefore, it is prudent to evaluate dyslipidemias
more often than is recommended in the general population. Lipoprotein
levels may change during the first 3 months of hemodialysis, peritoneal
dialysis, and kidney transplantation. On the other hand, waiting 3
months to measure the first lipid profile may needlessly delay effective
treatment for patients who present with dyslipidemia35. For patients whose lipid profile is normal at presentation, it is reasonable to repeat
the lipid profile 3 months later, to confirm that the initial values were
not low due to malnutrition or systemic disease. During the course of
kidney disease treatment, lipid levels may change. Therefore, the Work
Group recommends measuring subsequent levels at least annually.
Reasons to repeat lipid measurements after 2-3 months include changes
lipid-lowering agents, immunosuppressive agents that affect lipids (eg,
prednisone, cyclosporine, or sirolimus) or other changes that may affect
plasma lipids39.
Dyslipidemia in adolescents
Young adults (20-40 years old) with Stage 5 CKD have at least a
10-fold higher risk for CVD mortality compared to the general
population. There are limited data on ACVD in children with CKD.
However, CVD accounts for approximately 23% of deaths in children
and adults <30 years old who started treatment for stage 5 CKD as
children. Recent data from the Pathobiological Determinants of
Atherosclerosis in Youth (PDAY) study provide compelling evidence in
the general pediatric population, that initial fatty streaks seen in
adolescents develop into atheromatous plaques in young adults.
Moreover, this atherosclerotic process is believed to be accelerated in
uremia, thus putting children with Stage 5 CKD at high risk for
developing ACVD. Indeed, studies of arteries from children with Stage 5
CKD have demonstrated early ACVD changes10.
Dyslipidemia in Acute Medical conditions :
Some acute medical conditions may transiently alter plasma lipid
levels . For example, severe infections, surgery and acute myocardial
infarction are often associated with lower-than-normal lipid levels. Other
levels. In general, it is best to wait until acute conditions that may alter lipid
levels have resolved before assessing dyslipidemias for possible ACVD risk.
It should be noted, however, that the lipid profile is not significantly altered
within the first 24 hours after a myocardial infarction, and a lipid profile can
be measured during this time31.
Acute condition
Total cholesterol
LDL HDL Triglycerides
Myocardial infarction ↓ ↓ ↓ NC
Stroke ↓ ↓ NC NC
Bacterial sepsis &surgery. ↓ ↓ ↓ ↑
Acute pancreatitis. ↑ NC NC ↑
Tranplant acute rejection ↓ ↓ NC ↓NC
Transplant CMV infection ↓ ↓ NC ↓
Abbreviation, LDL-Low density lipoprotein, HDL-High density
lipoprotein, NC-No change, CMV- Cytomegalovirus.
Fasting:
Eating raises plasma triglycerides, carried mostly in chylomicrons
and very low-density lipoprotein (VLDL), and, as a result, total
cholesterol levels also increase. The post-prandial increases in
triglycerides and cholesterol are quite variable, depending on the type of
levels is attributable to inherited and acquired differences between
individuals. Although these differences affect the risk for ACVD, the
relationship between post-prandial lipid levels and ACVD is not as well
established as the relationship between fasting lipid levels and ACVD.3 Practical considerations may make non-fasting measurements the only
alternative for some patients. While fasting lipid profiles are best, it is
better to obtain non-fasting lipid profiles than to forgo evaluation
altogether. If the lipid profile obtained in a non-fasting patient is normal,
then no further assessment is needed at that time. However, an abnormal
lipid profile in a non-fasting patient is an indication to obtain a fasting
lipid profile44,49.
Urine protein excretion, especially if >3 g per 24 hours, can also cause or contribute to dyslipidemias. Therefore, CKD patients who still
produce urine should have protein excretion measured, if this has not
been done recently. In some cases, the underlying cause(s) of the
proteinuria can be treated and effectively reversed. In other cases,
angiotensin II converting enzyme inhibitors or angiotensin II receptor
blockers may help reduce protein excretion, and may thereby improve the
lipid profile in some patients. Clinical hypothyroidism can cause
dyslipidemia, and even subclinical hypothyroidism may cause mild
changes. Some of the signs and symptoms of hypothyroidism may
hypothyroidism more difficult in patients with CKD. Glucose intolerance
can also cause dyslipidemias. Therefore, patients with dyslipidemia and
CKD (but without known diabetes) should be assessed with fasting blood
glucose and possibly glycosylated hemoglobin. Glycemic control can
improve lipid profiles32.
Causes of Secondary Lipedemia:
Nephrotic syndrome, hypothyroidism ,diabetes ,excessive alcohol
ingestion, and chronic liver disease Medications that can cause
dyslipidemias include 13-cis-retinoic acid, anticonvulsants, highly active
anti-retroviral therapy, beta-blockers, diuretics, androgens/anabolic
steroids, oral contraceptives, corticosteroids, cyclosporine, and sirolimus .
The assessment of these secondary causes with history, physical
examination, and appropriate laboratory testing is recommended for any
patient with dyslipidemia, since effective correction of these disorders
may improve the lipid profile10.
Other causes of secondary lipidemia in adolescent and young adults :
Lipodystrophy; Idiopathic hypercalcemia glycogen storage
diseases; cystine storage disease; Gaucher disease; Juvenile Tay-Sachs
disease; Niemann-Pick Disease; sphingolipidoses; obstructive liver
disease such as biliary atresia; biliary cirrhosis; intrahepatic cholestasis;
nephrotic syndrome; anorexia nervosa; progeria; systemic lupus
conditions are fortunately rare, and require referral to appropriate tertiary
care specialists5.
Uses of Statins in Early stage of Kidney disease :
Although the pattern of dyslipidemia with low HDL and elevated
triglycerides would be a classic indication for fibrates, fibrates have not
been popular in the renal community. This is mainly because most
fibrates or their active metabolites accumulate in renal failure and
occasionally cause rhabdomyolysis. Alternative interventions, such as
dietary changes or switching to polyunsaturated fatty acids, carry a
considerable risk of malnutrition or are difficult to implement. The
nephrologist is thus left with cholesterol-lowering drugs, such as statins
or ezetimibe. Potential indications for statins in patients with renal
disease might be to assist in the reduction of proteinuria or to reduce the
rate of loss of glomerular filtration (progression) apart from the goal to
reduce cardiovascular events37,51.
Meta-analyses of participants with cardiovascular disease in
randomized controlled studies with statins who had impaired renal
function and/or proteinuria show a modest, though statistically significant
reduction in the loss of eGFR with statins (except in patients with diabetic
nephropathy or glomerulonephritis) as well as a modest, significant
More convincing are findings concerning the effect of statins on
cardiovascular endpoints in patients with the initial stages of CKD (CKD
stage 2 or early CKD stage 3). The effect of statins has been analyzed in
several subgroups of patients with elevated serum creatinine who
participated in prospective intervention trials on the effect of statins in
patients with high cardiovascular risk. Post hoc analyses in these
subgroups with impaired GFR suggest that the benefit is at least as high,
if not higher, in patients with CKD compared with patients without CKD.
A similar effect was observed in the subgroup of patients with diabetic
kidney disease. Significant benefit with respect to lowering
cardiovascular events is seen in patients with CKD (stage 2 and stage 3)
based on serum creatinine concentration and eGFR. In the Cholesterol
and Recurrent Events (CARE) study, this was restricted to patients with
GFR <40 ml/min with or without proteinuria37.
Use of Statins in Late Stage of Kidney disease :
Currently, there is a complete lack of controlled information on the
effects of statin treatment on outcome in patients with advanced CKD
(stage 4). In the past, information on use of statins in dialysis patients had
also not been uniform. In an observational study, based on U.S. Renal
Data System data, Seliger et al found better survival in a small subgroup
of statin users (n= 362) compared with nonstatin users (n = 3354). More
patients (n = 143) followed over 20 mo, Holmberg et al. found that
Atorvastatin had no significant effect on primary cardiac endpoint in
patients on dialysis whereas an effect was seen in individuals with
pre-end-stage renal disease, potentially suggesting that one may be too late
when starting statin treatment if the patient is ready for dialysis51.
The cumulative incidence of primary composite cardiovascular
endpoints comprising death from cardiac causes, fatal stroke, nonfatal
myocardial infarction, or nonfatal stroke was not significantly lower over
an average observation period of 4 yr (relative risk reduction 8%, 0.77 to
1.10, not significant). There was a positive result, however, for the
secondary endpoint of all combined cardiovascular events (205 versus
246 cases in Atorvastatin versus placebo-treated patients, relative risk -
0.82, P = 0.03). It remains unclear whether these data in diabetic patients
can be generalized or extrapolated to nondiabetic patients. This will be
clarified by two ongoing trials (a study to evaluate the use of
Rosuvastatin in subjects on regular dialysis: an assessment of survival
and cardiovascular events [AURORA] and Study of Heart and Renal
Protection [SHARP])38,53.
Even in early stages of CKD, the cardiovascular risk is
dramatically increased. In our opinion, the data from post hoc analyses of
past statin trials on subcohorts of patients in the early stages of CKD
administration of statins. It is our opinion that statins are indicated in
these patients based on these above post hoc analyses. It has even been
argued that CKD should be considered a coronary heart disease
equivalent, although the magnitude of excess cardiovascular risk in early
OBSERVATIONS & RESULTS
Results:Evaluation of the study clients:
The study subjects were evaluated according to their demographic,
physiological and bio-chemical characteristics related to chronic kidney
[image:54.595.86.515.334.460.2]disease.
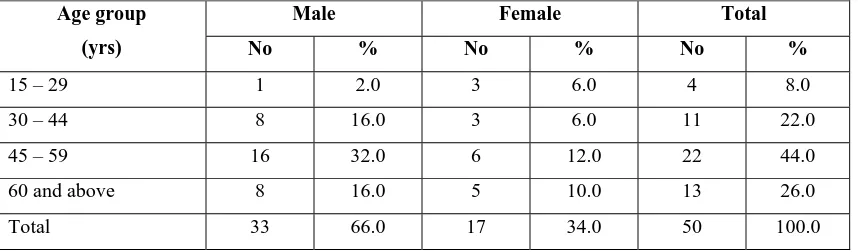
Table -1 Percentage distribution of sex wise study subjects according to their age.
Male Female Total Age group
(yrs) No % No % No %
15 – 29 1 2.0 3 6.0 4 8.0 30 – 44 8 16.0 3 6.0 11 22.0 45 – 59 16 32.0 6 12.0 22 44.0 60 and above 8 16.0 5 10.0 13 26.0
Total 33 66.0 17 34.0 50 100.0
The above table -1 shows that 44% of C.K.D. patients were in the
age group between 45-59. Among them the male and female contribution
were 22% and 12% respectively. The mean age of the total subsets was
49.8 13.5yrs. The mean ages of male and female subjects were 50.9 +
12 and 47.7 ± 16.2 years respectively. The observed difference of mean
ages between the sexes was not statistically significant (P>0.05).
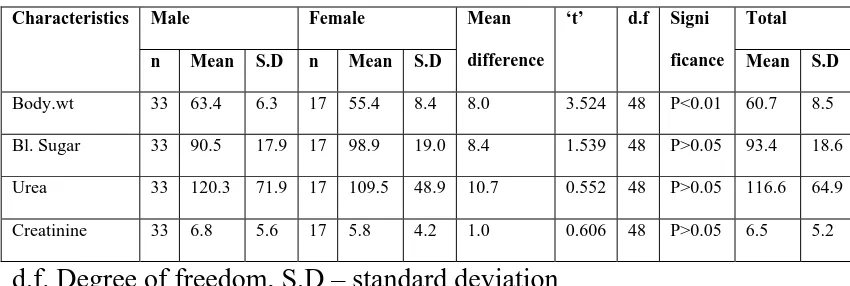
Table -2 Sex wise Evaluation of physiological and biochemical characteristics of study participants.
Male Female Total
Characteristics
n Mean S.D n Mean S.D Mean
difference
‘t’ d.f Signi
ficance Mean S.D
Body.wt 33 63.4 6.3 17 55.4 8.4 8.0 3.524 48 P<0.01 60.7 8.5 Bl. Sugar 33 90.5 17.9 17 98.9 19.0 8.4 1.539 48 P>0.05 93.4 18.6 Urea 33 120.3 71.9 17 109.5 48.9 10.7 0.552 48 P>0.05 116.6 64.9 Creatinine 33 6.8 5.6 17 5.8 4.2 1.0 0.606 48 P>0.05 6.5 5.2
d.f. Degree of freedom, S.D – standard deviation
The above table -2 evaluates the study participants according to
their body weight, Bl sugar, urea and creatinine. Except body weight, the
other variables like Bl. Sugar, urea and creatinine were not significantly
different between the sexes (P>0.05). The mean body weights of male
and female were 63.4 ± 6.3 kg and 55.4 ± 8.4kg. The difference was
statistically highly significant (P<0.01). The total C.K.D. patients mean
body weight was 60.7 8.5kgs. The mean Bl. Sugar was 93.4 ± ±
18.6mg/dl. The mean urea and creatinine were 116.6 ± 64.7 and 6.5 ±
Table -3Sex wise percentage distribution of hypertensive changes in fundus.
Male Female Total
Funds
changes No % No %
Significance
No %
Normal 7 31.8 3 33.3 P>0.05 10 32.3 Grade I 9 40.9 3 33.3 P>0.05 12 38.7
Grade II 6 27.3 3 33.3 P>0.05 9 29.0 Grade III Nil - Nil -
Papilledema Nil - Nil -
Total 22 100.0 9 100.0 31 100.0
The above table -3 explains the fundus changes of hypertensive
patients and found that there was no significant difference was observed
between the sexes. Among the hypertensive patients 32.3% was observed
as normal. Grade I was 38.7% and Grade II was 29%.
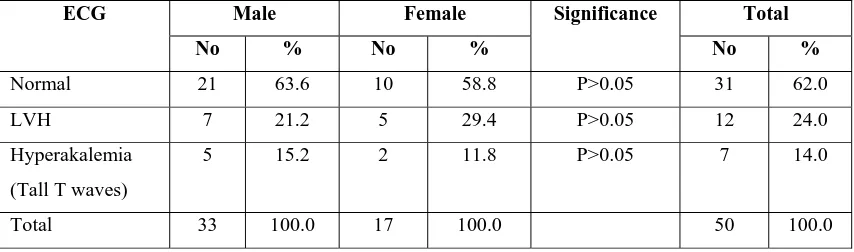
Table -4 Percentage distribution of E.C.G. classification according to their sex.
Male Female Total
ECG
No % No %
Significance
No %
Normal 21 63.6 10 58.8 P>0.05 31 62.0 LVH 7 21.2 5 29.4 P>0.05 12 24.0 Hyperakalemia
(Tall T waves)
5 15.2 2 11.8 P>0.05 7 14.0
Total 33 100.0 17 100.0 50 100.0
The table -4 illustrates the E.C.G. results of the study subjects and
there was no significant difference between the sexes. (P>0.05). The total
normal cases were 6.2%. The LVH and hyperkalemic changes were 24%
[image:57.595.85.512.518.644.2]Table -5 Sex wise classification and analysis of creatinine clearance among the study subjects.
Male Female Total
Creatinine
clearance No % No %
Significance
No %
<10 12 36.4 6 35.3 P>0.05 18 36.0 10 – 20 4 12.1 6 35.3 P>0.05 10 20.0
20 – 30 8 24.2 4 23.5 P>0.05 12 24.0 30 – 40 9 27.3 1 5.9 P<0.05 10 20.0 40 and above Nil - Nil Nil - Nil Nil
Total 33 100.0 17 100.0 - 50 100.0
From the evaluation of creatinine clearance shown in the table -5
explains that there was no significant difference between the sexes in
respect of level of creatinine clearance except the 4th category (30 – 40) Among the male patients 12 (36.4%) were having creatinine clearance
<10 as maximum. Among the female in each category of <10 and 10 -20
were having 6 (35.3%) as maximum. The male mean creatinine clearance
was 19.5 11.2 and the same of the female was 15.5 ± 8.9. The difference
of mean between the sexes was not statistically significant (t = 1.296, d.f
= 48 and P>0.05). The total mean of clearance of total 50 patients was
18.1 ± 10.5.
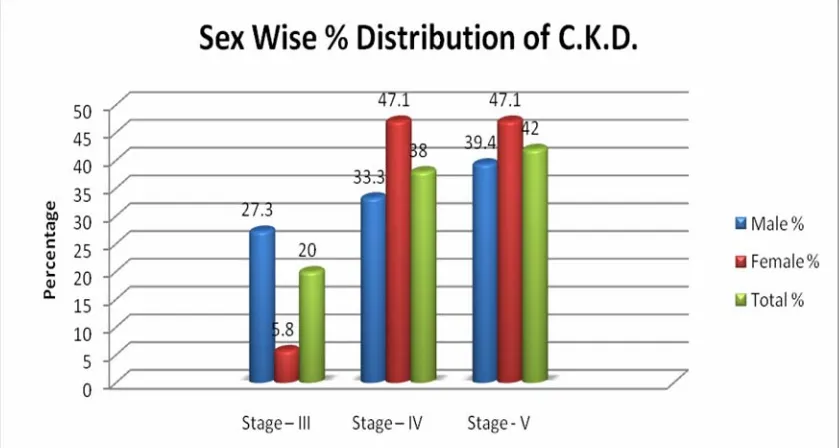
Table -6 Sex wise percentage distribution of staging of kidney diseases.
Male Female Total
Stages of
Kidney disease No % No %
Significance
No %
Stage – III 9 27.3 1 5.8 P<0.05 10 20.0 Stage – IV 11 33.3 8 47.1 P>0.05 19 38.0 Stage - V 13 39.4 8 47.1 P>0.05 21 42.0
Total 33 100.0 17 100.0 50 100.0
The above table -6 shows the stages of sex wise relation of C.K.D.
patients. Since there were no study group belong to stage I and stage II
they were not included in the table. Among the stage III cases the males
(27.3%) were greater than the females significantly (P<0.05). But in the
other two stages the sex differences were not statistically significant
(P>0.05). Among the total cases, the stage V was greater than other 2
Table – 7 Percentage distribution of lipid abnormalities in the serum sexwise distribution.
Male n=33 Female n=17 Total n=50 Category
No % No %
Significance
No % Raise in TGL 12 36.4 6 35.3 P>0.05 18 36.0 Raise in LDL 18 54.5 8 47.1 P>0.05 26 52.0 Raise in
T.Chl
5 15.2 4 23.5 P>0.05 9 18.0 Decrease in
HDL
22 66.7 13 76.5 P>0.05 35 70.0
The above lipid abnormalities among the sex variable of C.K.D
were furnished in the above table -7. The results of the above analysis
reveal that there was no significant elevation among the sexes were
noticed in all lipid elevation namely TGL, LDL and T. cholerterol. The
decrease of HDL among the sexes were also not significant. Among the
total cases 36% have elevated TGL, 34% have elevated LDL and 18%
have T.Cholesterol. In respect of decrease in HDL among the total cases
Table -8 Stage wise and sex wise elevated TGL classification of study subjects.
Male Female Total
Stages
No % No %
Significance
No %
III 2 16.7 0 0 - 2 20.0
IV 4 33.3 3 50.0 P>0.05 7 38.0
V 6 50.0 3 50.0 - 9 42.0
Total 12 100.0 16 100.0 - 18 100.0
The stage wise and sex wise relation of elevated TGL showed in
the table -8 reveals that there was no significant elevation was observed
between the sexes (P>0.05) in all stages. The percentage elevated TGL is
Table – 9 stage wise and sex wise elevated L.D.L. among the study subjects.
Male Female Total
Stages
No % No %
Significance
No %
III 4 22.2 0 0 - 4 15.4 IV 4 22.2 4 50.0 P>0.05 8 30.8 V 10 55.6 4 50.0 P>0.05 14 53.8 Total 18 100.0 8 100.0 - 26 100.0
The above table -9 evaluates the elevated level of LDL among the
study subjects and according to their sex. The elevated level of LDL
between male and female was not significant (P>0.05) in all stages. The
percentage elevation in LDL is greatest in stage V CKD than other
Table -10 Decreased level HDL among the study subjects according totheir sex and stage.
Male Female Total
Stages
No % No %
Significance
No %
III 5 22.7 1 7.7 P>0.05 6 17.1
IV 8 36.4 7 53.8 P>0.05 15 42.9
V 9 40.9 5 38.5 P>0.05 14 40.0
Total 22 100.0 13 100.0 - 35 100.0
The above, table -10 reveals the decreased level of HDL among the
study in relation to male and females sex and found they are of
statistically not significant (P>0.05). Further the percentage decrease in
[image:63.595.65.534.433.664.2]Table-11 Analysis and assessment of sex wise and stage wise LDL level in CKD cases.
Male Female Total
Stage
n Mean S.D n Mean S.D Mean
difference
‘t’ d.f Signi
ficance
Mean S.D
III 9 100.6 37.1 1 59.0 0.0 41.6 3.363 8 P<0.01 96.4 37.4
IV 11 103.7 56.4 8 124.6 54.8 20.9 0.806 17 P>0.05 112.5 55.2
V 13 118.3 31.9 8 106.9 49.8 11.4 0.643 19 P>0.05 114.0 38.9
Total 33 108.6 42.2 17 112.4 51.7 3.8 0.280 48 P>0.05 109.9 45.2
The analysis shown in the above table -11 reveals that the mean
LDL levels of male and female in IIIrd stage were 100.6 ± 37.1 and 59+0
respectively. The difference was statistically highly significant (P<0.01).
In other 2 stages the mean LDL values of male and female were
statistically not significant (P>0.05). The total mean LDL of male was
108.6 ± 42.2 and the same of the female was 112.4 ± 51.7. The total