“PREDICTION OF NEW-ONSET ATRIAL FIBRILLATION BY ATRIAL TISSUE DOPPLER IMAGING - A NOVEL METHOD TO MEASURE TOTAL ATRIAL CONDUCTION TIME”
Dissertation submitted for
D.M. DEGREE EXAMINATION
BRANCH II – CARDIOLOGY
MADRAS MEDICAL COLLEGE
AND
GOVERNMENT GENERAL HOSPITAL
CHENNAI – 600 003
CERTIFICATE
This is to certify that the dissertation entitled “PREDICTION OF NEW-ONSET
ATRIAL FIBRILLATION BY ATRIAL TISSUE DOPPLER IMAGING - A NOVEL METHOD TO MEASURE TOTAL ATRIAL CONDUCTION TIME” is the bonafide original work of DR.C.R.MADHU PRABHUDOSS in partial fulfillment of the requirements for D.M. Branch-II (CARDIOLOGY) examination of THE TAMILNADU DR.M.G.R. MEDICAL UNIVERSITY to be held in August 2010. The period of post-graduate study and training was from July 2007 to July 2010.
THEDEAN PROF.GEETHA SUBRAMANIAN M.D., D.M, FIAE, FISE, FCSI, FISC. MADRAS MEDICAL COLLEGE & PROFESSOR AND HEAD OF THE
GOVERNMENT GENERAL HOSPITAL DEPARTMENT OF CARDIOLOGY
CHENNAI - 600 003. MADRAS MEDICAL COLLEGE &
DECLARATION
I DR.C.R.MADHU PRABHUDOSS, solemnly declare that this dissertation entitled, “PREDICTION OF NEW-ONSET ATRIAL FIBRILLATION BY ATRIAL
TISSUE DOPPLER IMAGING - A NOVEL METHOD TO MEASURE TOTAL ATRIAL CONDUCTION TIME”is a bonafide work done by me at the department of Cardiology, Madras Medical College and Government General Hospital during the period 2007 – 2010 under the guidance and supervision of the Professor and Head of the department of Cardiology of Madras Medical College and Government General Hospital, Professor Geetha Subramanian M.D.D.M,FIAE, FISE, FCSI, FISC. This dissertation is submitted to The Tamil Nadu Dr.M.G.R Medical University, towards partial fulfillment of requirement for the award of D.M. Degree (Branch-II) in Cardiology.
Place : Chennai Date: 26-05-2010
ACKNOWLEDGEMENTS
A great many people made this work possible. I thank my Dean for allowing me to conduct this study.
My warmest respects and sincere gratitude to our beloved Prof Geetha Subramanian Professor and Head of the Department of Cardiology, Government General Hospital, Chennai. But for his constant guidance this study would not have been possible.
I am indebted to Prof. Geetha Subramanian, Prof. B.Ramamurthy, Prof.M.Somasundaram, Prof. P.Arunachalam and Prof. V.E.Dhandapani without
whom, much of this work would not have been possible.
I acknowledge Dr M.A.Rajasekar for the many useful comments he made during this project.
In addition, I am grateful to, Dr.G.Gnanavelu, Dr.S.Venkatesan, Dr.G.Ravishankar,
Dr.JustinPaul, Dr.C.Elangovan Dr.S.Raghothaman and Dr.G.Prathapkumar for
tracing all those waveforms and guidance.
Contents
Page
1. INTRODUCTION 6
2. AIM OF THE STUDY 7 3. REVIEW OF LITERATURE 8
4. MATERIAL AND METHODS 49
5. RESULTS AND DATA ANALYSIS 53
6. DISCUSSION 59
7. LIMITATIONS 67
8. CONCLUSION 68
9. BIBLIOGRAPHY 69
10. GLOSSARY & ACRONYMS 71
11. ANNEXURE - PROFORMA 72
INTRODUCTION
Atrial fibrillation constitutes the commonest cardiac rhythm disorder and is the major determinant of Outcome in valvular, myocardial, and ischemic heart disorders. There is no simple tool available to predict the onset this arrhythmia.
Electrophysiological parameters are too complex and can not be obtained in bedside.
Tissue Doppler analysis of atrial muscle gives us an opportunity to measure the critical total atrial conduction time non invasively.
AIM
REVIEW OF LITERATURE HISTORY OF ECHOCARDIOGRAPHY
detecting enemy submarines using sound, which culminated in the development of sonar. Sokolov described a method for using reflected sound to detect metal flaws in 1929. In 1942, Floyd Firestone, an American engineer, began to apply this technique and received a patent. It is this flaw detection technique that ultimately was used in medicine.
An Austrian, Karl Dussik, was probably the first to apply ultrasound for medical diagnosis in 1941. He initially attempted to outline the ventricles of the brain. His approach used transmission ultrasound rather than reflected ultrasound. After World War II, many of the technologies developed during that war, including sonar, were applied for peaceful and medical uses. In 1950, W. D. Keidel, a German investigator, used ultrasound to examine the heart. His technique was to transmit ultrasonic waves through the heart and record the effect of ultrasound on the other side of the chest. The purpose of his work was to try to determine cardiac volumes. The first effort to use pulse-reflected ultrasound, as described by Firestone, to examine the heart was initiated by Dr. Helmut Hertz of Sweden. He was familiar with Firestone's observations and in 1953 obtained a commercial ultrasonoscope, which was being used for nondestructive testing. He then collaborated with Dr. Inge Edler who was a practicing cardiologist in Lund, Sweden. The two of them began to use this commercial ultrasonoscope to examine the heart. This collaboration is commonly accepted as the beginning of clinical echocardiography as we know it today.
valve. However, they did not recognize the source of this echo for several years and originally attributed the signal to the anterior left atrial wall. Only after some autopsy investigations did they recognize the echo's true origin. Edler went on to perform a number of ultrasonic studies of the heart. Many of the cardiac echoes currently used were first described by him. However, the principal clinical application of echocardiography developed by Edler was the detection of mitral stenosis. He noted that there was a difference between the pattern of motion of the anterior mitral leaflet in patients who did or did not have mitral stenosis. Thus, the early studies published in the mid-1950s and early 1960s primarily dealt with the detection of this disorder.
Despite their initial efforts at using ultrasound to examine the heart, neither Edler nor Hertz really anticipated that this technique would flourish. Helmut Hertz was primarily interested in being able to record the ultrasonic signals. In the process, he developed ink jet technology and only spent a few years in the field of cardiac ultrasound. He devoted most of the rest of his career to ink jet technology, for which he held many important patents. He also advised Siemens Corporation, who provided their first ultrasonic instrument, that they should not enter the field of cardiac ultrasound because he personally did not feel that there was a great future in this area (Effert, personal communication, 1996). Edler too did not develop any further techniques in cardiac ultrasound. He retired in 1976 and until then was primarily concerned with the application of echocardiography for mitral stenosis and, to a lesser extent, mitral regurgitation. He never became involved with any of the newer techniques for pericardial effusion or ventricular function.
DOPPLER TISSUE IMAGING9
parameters opposite those needed to accurately detect red blood cell motion. Because tissue has a greater reflectivity and slower motion, instrumentation filters are set to exclude high velocities and low-intensity reflectors. With this technique, either the myocardium or fibrous skeleton of the heart can be targeted and weaker reflections from the higher velocity blood cells relatively excluded.
and in poor-quality images, there may be substantial bleeding of the color signal from the tissue into the blood pool.
The initial attempts at color encoding and Doppler tissue imaging used standard Doppler shifts of velocity. The Doppler signal in the power or energy domain can also be encoded. The power domain refers to the registration of the intensity or amplitude of the reflected Doppler shifts rather than just their velocity. In theory, this format may be of benefit because of its higher signal-to-noise ratio and has been used fairly extensively in contrast echocardiography.
Complete saturation of the image with color signal has seen little clinical acceptance because of the limitations of frame rate and saturation with an adequate signal-to-noise ratio. It should be recognized that the original source signal is actually pulsed Doppler information, acquired from a wide area of interest and targeted to tissue motion. A greater degree of acceptance has been seen by displaying the spectral signal of velocity and extracting quantitative information from localized areas using this technique. Analogous to the use of a sample volume in blood flow imaging, a sample volume can be placed within the myocardium or mitral or tricuspid anulus and the direction and velocity of the myocardium at that point in space accurately determined.
secondarily be employed for determining velocity gradients between adjacent points or more recently for strain rate imaging.
As Doppler imaging inherently detects motion and determines velocity, this is the fundamental parameter available. From this displacement of the tissue, the distance traveled can be determined as the product of velocity and time. More complex derivatives of the velocity determination include the calculation of the velocity gradient between two points and strain or strain rate imaging, which are measures of tissue deformation. The simplest calculation that can be derived from two-point analysis is the absolute difference in velocities. This has had clinical applicability in determining the gradient between endocardial and epicardial velocities, which may be a more sensitive indicator of myocardial ischemia than an absolute decrease in velocity across the entire myocardial wall.
Displacement, strain, and strain rate can be displayed in several formats. The easiest to understand is a graphic output of either of these parameters over time. One or more discrete regions of interest can be identified and simultaneously graphed for comparison of displacement, strain, or strain rate at any given time point. Because these parameters are derived from tissue Doppler imaging, which has high spatial resolution, it is often beneficial to simultaneously display these values for multiple points throughout the ventricular myocardium or for all points along a continuous line drawn through the myocardium. Display of this type of information requires a different format than a simple x/y graph as is appropriate for a single point. M-mode display in which time is conventionally displayed on the x axis, distance around the ventricle on the y axis, and the value of displacement, strain, or strain rate in color. This is analogous to the display of Doppler velocity data in a color M-mode but obviously incorporates the third dimension of location within the heart. Numerous studies have demonstrated that Doppler imaging derived myocardial gradients as well as strain and strain rate provide a higher resolution evaluation of myocardial mechanics than evaluation of wall motion, myocardial thickening, or tissue velocities alone.
greater than those produced by blood. Therefore, Doppler ultrasound instruments high frame rate. A special function key needs to be selected to activate TDI. After TDI has been selected, the subsequent operation is identical to that used to perform regular pulsed wave Doppler echocardiography, except that the TDI gain needs to be lowered from the regular gain setting used for blood flow Doppler recordings and the velocity scale needs to be adjusted to a lower aliasing velocity (about 20-30 cm/s or even lower) to optimize TDI signals. Some ultrasound units adjust these variables automatically when the TDI function is selected. Also, TDI can be displayed in the color mode, just as in color imaging of blood flow. Tissue velocities are color-coded by autocorrelation: red for tissue moving toward the transducer and blue for tissue moving away from the transducer. Movement and velocities of cardiac structures are regulated by the underlying systolic function and diastolic function of the heart. Isaaz and colleagues were able to obtain a pulsed Doppler profile of the left ventricular (LV) posterior wall. This was expanded by McDicken and colleagues (who developed a prototype of color Doppler velocity display of myocardial wall dynamics). Currently, TDI is an integral part of an echocardiography examination in the areas discussed in the following sections.
ASSESSMENT OF MYOCARDIAL RELAXATION8
heart with normal myocardial relaxation, Ea increases with an increasing transmitral gradient, increasing preload, exercise, and dobutamine infusion . However, when myocardial relaxation is impaired because of aging or a disease process, Ea is affected less or even unchanged by preload or transmitral gradient. Velocities of longitudinal mitral anulus motion are best obtained from apical views. Although various locations of the mitral anulus can be interrogated with TDI, the two most frequently used locations are the septal (or medial) and lateral mitral anulus. Usually, Ea from the lateral anulus is higher (normally >15 cm/s) than that from the medial anulus (normally >10 cm/s). In our laboratory, mitral anulus velocities are usually, but not always, obtained from the septal anulus. Regional myocardial dysfunction or valvular surgery involving the mitral anulus may affect mitral anulus velocities. A localized disease process, such as lateral myocardial infarction, can result in mitral anulus velocities being lower at the lateral anulus than at the septal anulus.
Table 1
Comparison of two-dimensional (2D) gray scale and tissue doppler imaging (TDI)
TDI
Variable 2D Gray Scale Color Doppler
Pulsed Doppler Temporal resolution 30-50 frames/s (but 400
frames/s possible) 20-90 frames/s >150 frames/s possible) >250 frames/s Spatial resolution 1 ×1 mm (may be less) Typically 2 × 2 mm 1 ×1 mm
Angle dependency No Yes Yes
Applicability to all myocardium
++ +++ +++
Intramural function No Yes No
Attenuation
Late diastolic velocity (Aa ) of the mitral anulus8 at the time of atrial contraction increases during early diastolic dysfunction, as is the case for the mitral inflow A wave, but decreases as atrial function deteriorates. Aa has been correlated with left atrial (LA) function.
ESTIMATION OF LEFT VENTRICULAR FILLING PRESSURE8
Because PCWP can be estimated reliably with E/Ea, estimation of PCWP with exercise is feasible (which is helpful is assessing patients who have exertional dyspnea).
EVALUATION OF REGIONAL AND GLOBAL SYSTOLIC FUNCTION
The extent of systolic movement of the mitral anulus correlates with LV systolic function and stroke volume. Normally, the systolic velocity (Sa) of the mitral anulus is more than 6 cm/s. Although TDI of the mitral anulus reflects the global systolic and diastolic function of the LV, segmental or regional function can be assessed by performing TDI of various LV segments by placing the sample volume (2-5 mm) in the region of interest. The size of the sample volume depends on the location and intensity of the signal and is usually between 2 and 5 mm. Further clinical experience with this variable will determine if Sa can replace other more commonly used systolic variables.
TISSUE VELOCITY GRADIENT
reperfusion of an occluded coronary artery, measurement of the tissue velocity gradient can be useful in patients with an acute myocardial infarction. To record or display the myocardial velocity gradient, the direction of myocardial contractility needs to be aligned in parallel with the direction of the ultrasound beam. Therefore, imaging views are limited to the parasternal windows to image anterior or posterior walls.
CARDIAC TIME INTERVALS
A limitation of measuring cardiac time intervals by pulsed wave Doppler echocardiography is nonsimultaneity because different cardiac cycles are usually needed to measure various intervals which in turn are used together. One solution is to have the capability of obtaining multiple pulsed wave Doppler recordings simultaneously. Another creative means to measure cardiac intervals from a single cardiac cycle is to use tissue Doppler anatomic color M-mode from the anterior mitral leaflet. From this technique, isovolumic contraction time, isovolumic relaxation time, and LV ejection time can be measured reliably from a single cardiac cycle
Mechanical dyssynchrony is measured by time intervals between peak ejection systolic velocities or peak strain of multiple myocardial segments, as discussed below.
EVALUATION OF THICK WALLS
PROGNOSTICATION
Because E/Ea can estimate LV filling pressures and patients with increased filling pressures have higher rates of morbidity and mortality, it is expected that a high E/Ea predicts a poor outcome. E/Ea more than 15 was found to be associated with increased mortality of patients with acute myocardial infarction . By itself, Ea is also a good predictor for clinical outcome. In various clinical conditions, patients who have an Ea less than 5 cm/s are more likely to have a much higher mortality than those with an Ea more than 5 cm/s.
STRAIN AND STRAIN RATE IMAGING
Where Va - Vb is the instantaneous velocity difference at points a and b, and d is the distance between the two points.
Strain (ε) is the percentage change in length during myocardial contraction and relaxation and is expressed as a percentage:
ε = (L1- L0 ) / L0 = ∆L / L0
where L0 is the original length, L1 is the final length, and ∆L is the change in length. Strain can be derived echocardiographically by the following:
ε =
∫
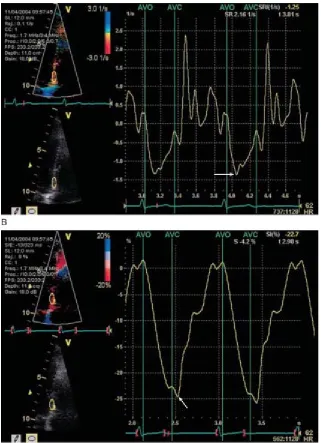
tto SR.dtFIGURE 1A, Recording of tissue velocity. The sample volume was placed at the basal portion of the inferior septum. Peak systolic velocity (Sm) was slightly more than 6cm/sec, early diastolic velocity (Em) was 10cm/sec, and late diastolic velocity (Am) was 6cm/sec.
B, Recording of strain rate, which represents the rate of deformation; the peak negative strain rate (arrow) was -1.3/sec.
[image:26.612.89.410.69.512.2]Tissue tracking, also known as displacement, is similar to strain, except it is the integral of the tissue velocity over a given time. It represents the distance a region of interest moves relative to its original location.
In the normal heart, longitudinal strain rate values are similar from the base to the apex, unlike tissue velocity, which is higher at the base than at the apex. Every effort is made to ensure that the direction of tissue movement is less than 30 degrees from the direction of the beam, but this is technically challenging in the apical segments as the angle becomes wider. The narrow-sector angle approach on an individual wall obviates some of the above problems, which precludes concurrent comparison of contralateral segments.
Strain imaging is similar to measuring the myocardial velocity gradient, which is limited to analyzing the myocardium that contracts in the direction that is parallel with the ultrasound beam. However, better spatial resolution and a higher frame rate (up to 200 frames/s) in strain rate imaging allow simultaneous calculation of the strain rate of the myocardium within a selected sector, which can be color coded. A curved cursor can be placed along the entire circumference of the LV to analyze regional strain rate. However, accurate measurements of strain rate depend on properly aligning the ultrasound beam so it is parallel with the direction of myocardial motion.
SPECKLE TRACKING ECHOCARDIOGRAPHY
throughout the cardiac cycle. This allows assessment of LV rotational motion, often referred to as torsion or twist. The spiral shape of the LV myocardial fibers results in a complex three-dimensional (3D) torsion mechanism for systolic contraction and untwisting for diastolic relaxation. The LV myocardium consists of two layers. The subendocardial layer wraps around the LV cavity in the direction of a right-handed helix, and the subepicardial layer wraps around in the direction of a left-handed helix. When viewed from the LV apex, apical rotation is counterclockwise and basal rotation is clockwise during systole. An analogy for LV contraction is the motion of wringing out a wet towel with your hands. As the two hands twist the ends of the towel in opposite directions Speckle tracking is an alternative method for quantification of LV systolic, and potentially diastolic, function. It also is another method for measuring strain using 2D images instead of the TDI method described above. Speckle tracking does not have the limitation of angle dependence that TDI-derived strain measurements have.
TISSUE DOPPLER IMAGING (TDI) AND STRAIN IMAGING OF LEFT ATRIUM3
quantifies regional tissue motion velocity whereas strain and strain rate represent the extent of local tissue deformation and its rate, respectively. These novel technologies have been validated for the assessment of both global and regional
LV function and have recently been applied to the evaluation of regional LA function. From an electromechanical perspective, echocardiographic parameters that assess LA mechanical function may provide a greater understanding of atrial performance and its relationship with ventricular function.
Assessment of left atrial and appendage function by tissue Doppler imaging 3.
Left atrial appendage (LAA) 3 is a highly contractile structure with a pattern of contractions totally different from that of the LA main body. It is more compliant and therefore plays an important role in the LA reservoir function, especially during
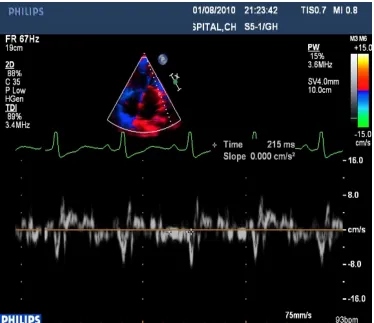
FIGURE 3 Myocardial performance of left atrial appendage. The sample volume was placed at the septal wall of left atrial appendage where the pulsed tissue Doppler imaging was recorded in transoesophageal echocardiography. The profile is normally triphasic, which includes the initial upward velocity before the P-wave on electrocardiogram, followed by another upward velocity with higher amplitude after the P-wave
(late systolic wave, LSW) and the negative velocity (late diastolic wave, LDW).
manifestation of AF. Therefore, prediction and prevention of AF and its complications is essential. There has been an increase in the number of admissions to hospital for AF in recent years, demonstrating the need for primary prevention of new-onset AF. To enable primary prevention strategies, we have to identify which patients are at increased risk for the development of AF. Observational population studies resulted in the discovery of clinical and echocardiographic parameters that are associated with the development of AF. However, the currently available risk stratification parameters have limited predictive value in the individual patient. Age or underlying heart disease may result in atrial dilatation or a depressed intra-atrial conduction. This will lead to an increased total atrial conduction time (TACT) 1 and facilitate AF. Recently, we validated a new non-invasive echocardiographic method to determine the TACT, using transthoracic tissue Doppler imaging of the atria (the PA-TDI interval). We demonstrated that PA-TDI is an easy, fast and reliable method to estimate the TACT.
ECG( II )
15 S’
10
PA-TDI PA-TDI 5
TDI 0
5 E’
10 A’
15
FIGURE 4
In the apical four-chamber view1, the pulsed-wave tissue Doppler sample was placed on the lateral wall of the left atrium just above the mitral annulus. The PA-TDI interval, defined as the time-interval from initiation of the electrocardiographic P wave
ATRIAL FIBRILLATION
ELECTROCARDIOGRAPHIC RECOGNITION.
Atrial fibrillation is an arrhythmia characterized by seemingly disorganized atrial depolarizations without effective atrial contraction. It was once thought that all atrial fibrillation was caused by a single mechanism of multiple wavelets propagating in random fashion throughout the atria. It is now apparent that there are likely several mechanisms and that there may be some organization to atrial fibrillation. For example, in many patients, atrial fibrillation is caused by a focal discharge at rapid rates and fibrillatory conduction (heterogeneous conduction caused by rapidity of activation) through the atria. Nonetheless, all these potential mechanisms of atrial fibrillation have a common appearance on the ECG. During atrial fibrillation, electrical activity of the atrium can be detected on the ECG as small, irregular baseline undulations of variable amplitude and morphology, called f waves, at a rate of 350 to 600 beats/min. At times, small, fine, rapid f waves can occur and are detectable only by right atrial leads or by intracavitary or esophageal electrodes. The ventricular response is grossly irregular (irregularly irregular) and, in an untreated patient with normal AV conduction, is usually between 100 and 160 beats/min.
represent total atrial activity but depict only the larger vectors generated by the multiple wavelets of depolarization that occur at any given moment.
Each recorded f wave is not conducted through the AV junction, so a rapid ventricular response comparable to the atrial rate does not occur. Many atrial impulses are concealed (not recorded in the ECG) because of a collision of wave fronts, or they are blocked in the AV junction without reaching the ventricles (i.e., concealed conduction, which accounts for the irregular ventricular rhythm). The refractory period and conductivity of the AV node are determinants of the ventricular rate. When the ventricular rate is very rapid or very slow, it may appear to be more regular. Even though conversion of atrial fibrillation to atrial flutter is accompanied by slowing of the atrial rate, an increase in the ventricular response can result, because more atrial impulses are transmitted to the ventricle as a result of less concealed conduction. Also, it is easier to slow the ventricular rate during atrial fibrillation than during atrial flutter with drugs such as digitalis, calcium antagonists, and beta blockers, because the increased concealed conduction makes it easier to produce an AV block.
CLASSIFICATION11
frequency of recurrences. Thus, a designation of first detected episode of AF is made on the initial diagnosis. When the patient has experienced two or more episodes, atrial AF is classified as recurrent. After the termination of an episode of AF, the rhythm can be classified as paroxysmal or persistent. Paroxysmal AF is characterized by self-terminating episodes that generally last <7 days (most <24 hours), whereas persistent AF generally lasts >7 days and often requires electrical or pharmacologic cardioversion. AF is classified as permanent when it has failed cardioversion or when further attempts to terminate the arrhythmia are deemed futile. It might be more appropriate to use the term established rather than permanent, because these patients can undergo successful ablation to restore and maintain sinus rhythm precluding the concept of permanent. Although this classification scheme is generally useful, the pattern of AF may change in response to treatment. Thus, AF that has been persistent may become paroxysmal during pharmacologic therapy with antiarrhythmic medications.
CLINICAL FEATURES 7.
obesity has been found as an additional risk factor for developing atrial fibrillation. Four important aspects of atrial fibrillation are treatable contributing factors, control of the ventricular rate, prevention of recurrences, and prevention of thromboembolic episodes. Occult or manifest thyrotoxicosis should be considered in patients with recent-onset atrial fibrillation. Atrial fibrillation can be intermittent or chronic and may be influenced by autonomic activity. Atrial fibrillation, whether it is persistent or intermittent, predisposes to stroke. Symptoms as a result of atrial fibrillation are determined by multiple factors, including the underlying cardiac status, the rapidity and irregularity of ventricular rate, and loss of atrial contraction. Physical findings include a slight variation in intensity of the first heart sound, absence of ‘a’ waves in the jugular venous pulse, and an irregularly irregular ventricular rhythm. Often, with fast ventricular rates, a significant pulse deficit appears (i.e., the auscultated apical rate is faster than the rate palpated at the wrist, pulse deficit, because each contraction is not sufficiently strong to open the aortic valve or transmit an arterial pressure wave through the peripheral artery). If the ventricular rhythm becomes regular in patients with atrial fibrillation, conversion to sinus rhythm, atrial tachycardia, or atrial flutter with a constant ratio of conducted beats or the development of junctional tachycardia or VT should be suspected.
EMBOLIZATION AND ANTICOAGULATION 7.
in patients with nonvalvular atrial fibrillation is five to seven times greater than that in controls without atrial fibrillation. Overall, 20 to 25 percent of ischemic strokes are caused by cardiogenic emboli. Many studies have evaluated the risk of stroke in patients with atrial fibrillation and the benefits of anticoagulation and antiplatelet therapy. Patients with mitral stenosis and atrial fibrillation have a 4 to 6 percent incidence of embolism per year. Risk factors that predict stroke in patients with nonvalvular atrial fibrillation include a history of previous stroke or transient ischemic attack (relative risk, 2.5), diabetes (relative risk, 1.7), history of hypertension (relative risk, 1.6), and increasing age (relative risk, 1.4 for each decade). Patients with any of these risk factors have an annual stroke risk of at least 4 percent if untreated. Patients whose only stroke risk factor is congestive heart failure or coronary artery disease have stroke rates approximately three times higher than patients without any risk factors. Left ventricular (LV) dysfunction and a
left atrial size larger than 2.5cm/m2 on echocardiographic examination are associated with thromboembolism. Patients younger than 60 to 65 years of age who have a normal echocardiogram and no risk factors have an extremely low risk for stroke (1 percent per year). Therefore, the risk of stroke in patients with lone atrial fibrillation—that is, idiopathic atrial fibrillation in the absence of any structural heart disease or any of the risk factors discussed previously—is relatively low. A scoring system to predict risk of stroke accounting for all these clinical risks has been proposed from an analysis of the Framingham Heart Study.
percent risk reduction in women). Aspirin, 325 mg/day, produced a risk reduction of 44 percent. The annual rate of major hemorrhage was 1 percent for the control group, 1 percent for the aspirin group, and 1.3 percent for the warfarin group. No difference in stroke risk occurs between paroxysmal (intermittent) atrial fibrillation and sustained (chronic) atrial fibrillation. Anti-coagulation therapy is ap-proximately 50 percent more effective than aspirin therapy for the prevention of ischemic stroke in patients with atrial fibrillation.
significant valvular heart disease, hypertension, diabetes, age older than 65 years, left atrial enlargement, coronary artery disease, or congestive heart failure) should be treated with warfarin anticoagulation to achieve an international normalized ratio (INR) of 2.0 to 3.0 for stroke prevention if the individual is a good candidate for oral anticoagulation. Patients with contraindications to anticoagulation and unreliable individuals should be considered for aspirin treatment. Patients with atrial fibrillation who do not have any of the preceding risk factors have a low stroke risk (2 percent/year or less) and can be protected from stroke with aspirin. In patients older than 75 years, anticoagulation should be used with caution and monitored carefully to keep the INR less than 3.0 because of the risk of intracranial hemorrhage.
window not requiring monitoring, like warfarin. Left atrial occlusion, surgically or with a catheter-based system, is also being evaluated as a method for stroke prevention.
MANAGEMENT 7.
symptomatic from uncontrolled ventricular rates or from atrial fibrillation itself (i.e., loss of AV synchrony and atrial contraction) and risk for side effects from drugs. It can sometimes be difficult to determine whether a patient's symptoms are caused by rapid ventricular rates or the loss of atrial contraction. As a general rule, asymptomatic patients found to have atrial fibrillation on a routine ECG are not likely to require rhythm control, and rate control is usually sufficient. Ambulatory monitoring correlating the patient's ventricular response and rhythm to symptoms and exercise testing can be useful to this end. Trials of aggressive rate control or, conversely, cardioversion and maintenance of sinus rhythm are sometimes necessary to make this determination. Intolerance to medications or excessive risk in one strategy may necessitate switching strategies. As stated earlier, a rhythm control strategy should not be an alternative to anticoagulation therapy to reduce stroke risk. Many elderly patients tolerate atrial fibrillation well
without therapy, because the ventricular rate is slow as a result of concomitant AV nodal disease. These patients often have associated sick sinus syndrome, and the development of atrial fibrillation represents a cure of sorts. Such patients may demonstrate serious supraventricular and ventricular arrhythmias or asystole after cardioversion, so the likelihood of establishing and maintaining sinus rhythm should be weighed against the risks of cardioversion or other forms of therapy.
ACUTE MANAGEMENT 7.
months in only 30 to 50 percent. Patients with atrial fibrillation of less than 12 months' duration have a greater chance of maintaining sinus rhythm after cardioversion. For patients who do not require emergent cardioversion, chemical cardioversion with IV antiarrhythmic drugs is effective in 35 to 75 percent of patients, depending on the population studied. Although procainamide has been used extensively for years, no well-controlled studies have been performed to determine its efficacy. Outside the United States, IV flecainide has been used with good results. IV amiodarone appears to be less effective, with no difference in conversion rates from placebo. IV ibutilide is also effective in about 35 to 75 percent of patients, depending on the population studied. In the absence of decompensation, the patient can be treated with drugs such as digitalis, beta blockers, or calcium antagonists to maintain a resting apical rate of 60 to 80 beats/min that does not exceed 100 beats/min after slight exercise. The combined use of digitalis and a beta blocker or calcium antagonist can be helpful in slowing the ventricular rate.
Digitalis may be more effective if associated LV dysfunction is present; without such dysfunction, a beta blocker may be preferable to control the ventricular rate.
LONG-TERM MANAGEMENT 7
can be useful to confirm adequate rate control during activity. In some patients with frequent recurrence and rapid ventricular rates not controlled by drugs or in
maintaining sinus rhythm, with up to an 80 percent efficacy. Before electrical cardioversion, an antiarrhythmic agent is often administered for a few days to help prevent relapse of atrial fibrillation, as well as to convert some patients to sinus
PATIENTS AND METHODS INCLUSION CRITERIA
159 Patients who came to our cardiology out patient department between April 2008 and March 2010 were randomly selected and included in the study.
EXCLUSION CRITERIA
Patients with history of AF, atrial flutter, atrial tachycardia, age <18 years, previous pacemaker implantation or an implantable cardioverter-defibrillator were excluded from the study.
The following parameters were studied
Age
Sex
Occupation
Socioeconomic status
Diabetes
Hypertension
Coronary artery disease
Rheumatic heart disease
Underlying disease like chronic obstructive pulmonary disease (COPD), thromboembolic events, heart failure, myopathies etc were studied.
Medication use ( beta blockers, verapamil, diuretics, anti arrhythmic etc)
ECG
2. P-wave duration 3. PR interval
4. QRS duration (ms))
Tissue Doppler imaging
1. PA-TDI interval - (The time from the initiation of the P wave on the ECG (lead II) to the peak of A' wave on the lateral left atrial tissue Doppler tracing obtained in apical 4-chamber view) was measured
2. Maximal A’ –wave velocity (cm/s)( lateral left atrial tissue Doppler tracing)
Dimensions ( Echo cardiography) 1. Aorta diameter(mm) 2. Left atrial dimension(mm)
3. Left ventricular end diastolic diameter(mm) 4. Left ventricular end systolic diameter(mm) 5. Inter ventricular septum width (mm) 6. Posterior wall width(mm)
7. Left ventricular mass(gm) 8. End diastolic volume(ml) 9. End systolic volume(ml) 10.Caval vein(mm)
2. Hypokinesia
Mitral valve Doppler assessments 1. Maximal E – wave velocity (m/s)
2. E – wave deceleration time (ms) 3. Maximal A – wave velocity (m/s) 4. E/A ratio
Valvular disorders were studied.
TOTAL ATRIAL CONDUCTION TIME (TACT):
TACT is the time elapsed between the initiation of atrial depolarisation and the last depolarisation of the same activation front and it incorporates both conduction slowing and atrial dilatation
FIGURE 5 Shows the measurement of PA-TDI interval by tissue Doppler imaging
The measurements were made using Philips IE 33 ECHO Machine.
Patients were followed up in the review OPD once in 2 months and rhythm Recorded by taking ECG.
If any doubt holter recordings were done.
Patients were advised to report to us whenever there is palpitation or other signs PA-TDI interval (the time from the initiation of the P wave on the
[image:53.612.90.464.70.393.2]STATISTICAL ANALYSIS
Continuous variables are reported as mean (SD) and categorical variables as observed number of patients (%).
Cox regression univariate analysis used to compare patients who developed and not developed AF.
Fisher’ s exact test used to measure p value.
RESULTS
The average age of the patients was 52.2 yrs,
Male to female ratio was 1.5:1,
Most of them belonged to low socioeconomic status,
20 patients (12 %) developed new-onset AF.
TABLE -2 PATIENT CHARACTERISTICS WERE SHOWN BELOW SI NO CHARACTERISTICS ALL PATIENTS (N=159) NO AF DURING FOLLOW-UP (N=139) AF DURING FOLLOW-UP (N=20) P VALUE
1 HYPERTENSION 95(60%) 87(63%) 8(40%) 0.0857
2 CAD 16(10%) 15(11%) 1(5%) 0.6954
3 DIABETES 20(13%) 18(13%) 2(10%) 1.0
4 THROMBOEMBOLIC EVENTS
8(5%) 7(5%) 1(5%) 1.0
5 RHD 70(44%) 60(43%) 10(50%) 0.6335
6 HEART FAILURE 14(8%) 10(7%) 4(20%) 0.0795
7 COPD 60(38%) 56(37%) 4(20%) 0.0899
8 MYOPATHIES 10(6%) 8(6%) 2(10%) 0.6156
1. The above table shows patient characteristics with predominantly hypertension, rheumatic heart disease, and chronic obstructive pulmonary disese(COPD). 2. Among the patients with myopathies (total no of patients-10), restrictive
cardiomyopathy were-2, hypertropic obstructive cardiomyopathy-2, dilated cardiomyopathy were 6.
4. Age, diabetes, hypertension, Coronary artery disease (CAD), thromboembolic events, Rheumatic heart disease( RHD ), Heart failure, Chronic obstructive pulmonary disease (COPD), myopathies and medication use were comparable between the groups which developed & not developed atrial fibrillation.
5. Maximal A’ –wave velocity (cm/s) (lateral left atrial tissue Doppler tracing) were Rheumatic heart disease (total no of patients-70),mean maximal A’-wave velocity is 8.4 cm/s, restrictive cardiomyopathy(total no of patients -2)-7.1 cm/s, systemic hypertension(total no of patients -95) – 8.9 cm/s, hypertropic
obstructive cardiomyopathy(total no of patients -2)-7.5 cm/s, dilated
cardiomyopathy (total no of patients-6)-7.4 cm/s, patients who had systemic thromboembolism(total no of patients-8)-9.3 cm/s, chronic obstructive pulmonary disease(total no of patients-60) – 9.5 cm/s.
6. Left atrial diameter(mean) measured by 2d echo were, rheumatic heart disease-4.46cm, restrictive cardiomyopathy-5.9 cm, hypertropic obstructive cardiomyopathy- 3.25cm, systemic hypertension-3.8cm, patients who had systemic thromboembolism-4.6 cm, dilated cardiomyopathy-5.25 cm.
7. Left ventricular ejection fraction (mean %) measured (m-mode) were rheumatic heart disease-55.1%, restrictive cardiomyopathy-61.5%, hypertropic obstructive cardiomyopathy-65%, dilated cardiomyopathy-31.8%, systemic hypertension-57.9%, patients who had heart failure-48%.
hypertropic obstructive cardiomyopathy mean left ventricular posterior wall thickness-11.5cm, mean interventricular septal thickness- 26.5cms.
9. Mitral valve Doppler measurements, Maximal E – wave velocity (m/s) and Maximal A – wave velocity (m/s) (mean values) were rheumatic heart disease-0.55&0.38 m/s, restrictive cardiomyopathy -1.5&0.5 m/s, hypertropic obstructive cardiomyopathy- 0.35& 0.95 m/s, dilated cardiomyopathy- 1.4&0.73 m/s, systemic hypertension-0.68&0.74 m/s, and patients who had coronary heart disease – 0.63&0.72m/s respectively.
10.E/A ratio(mean) were rheumatic heart disease -1.3, restrictive cardiomyopathy-3, hypertropic obstructive cardiomyopathy -0.7, dilated cardiomyopathy-2.0cardiomyopathy-3, systemic hypertension-0.91, and patients who had coronary heart disease – 1.01.
TABLE 3
PATIENTS WHO DEVELOPED ATRIAL FIBRILLATION (N=20)
SI NO DISEASE NO (%)
1 RHD 10 ( 50%)
2 COPD 4 (20%)
3 RESTRICTIVE CARDIOMYOPATHY 2 (10%)
4 PRIOR CHF 4 (20%)
Potential confounders were adjusted and it was found that prolonged PA-TDI was independently associated with new-onset Atrial Fibrillation (AF).
With a PA-TDI interval <136 ms (n = 22), (p < 0.05) none had AF.
With a PA-TDI interval >190 ms (n = 18), 12 (66%) had AF.
With a PA-TDI interval 136-160 ms (n = 77), 4 (5.2%) had AF.
The following diagram explains these findings.
FIGURE 6
INCIDENCE OF NEW-ONSET ATRIAL FIBRILLATION (AF) IN PATIENTS CLASSIFIED ACCORDING TO THE PA-TDI INTERVAL MEASURED AT BASELINE
0 10 20 30 40 50 60 70
<136(22) 136-160(77) 161-189(42) >190(18)
% - Y AXIS
PA-TDI Interval in ms (NO of patients)
Cox regression showed that PA-TDI was independently associated with new-onset AF (OR=1.370; 95% CI 1.032 to 1.723; p=0.028).
DISCUSSION
The hemodynamic function of the left atrium (LA) 3 primarily modulates the left ventricular (LV) filling through its three components: a reservoir component during ventricular systole, a conduit component during early ventricular diastole, and a booster pump component during late ventricular diastole. Left atrial appendage (LAA) is a highly contractile structure with a pattern of contractions totally different from that of the LA main body. It is more compliant and therefore plays an important role in the LA reservoir function, especially during increases in the LA pressure or volume
Atrial fibrillation (AF) is the most common cardiac arrhythmia associated with an at least two-fold increase in morbidity and mortality, and occurs in 0.4% of the general population, increasing to 5% in those >65 years old. With the loss of atrial booster pump function, the LA–LV pressure gradient during early LV filling is enhanced by elevation of the LA pressure to maintain stroke volume. Thus, a reduction in both LA compliance and volume has been observed with the onset of AF that further decreases cardiac function and increases the risk of thrombo-embolism.
Importance of predicting atrial fibrillation:
Atrial fibrillation 3 constitutes the commonest cardiac rhythm disorder and is the major determinant of outcome in valvular, myocardial, and ischemic heart disorders.
could be applied in patients with a high risk of developing AF. However, this hypothesis needs to be confirmed in prospective randomized trials.
Observational population1 studies such as the Framingham Heart study, the Manitoba Follow-up study and the Cardiovascular Health study reported several clinical and echocardiographic parameters that are associated with the development of new onset AF. The clinical factors associated with new-onset AF are higher age, male sex, the presence of diabetes, hypertension, congestive heart failure, valve disease and coronary artery disease.
In our study, new onset AF was more common in patients with rheumatic heart disease (50%) (especially with mitral regurgitation), chronic obstructive pulmonary disease (20%), restrictive cardiomyopathy (10%), and patients with previous history of heart failure (20%).
Atrial electrical activation2, as assessed by the PA-start interval, began at the RA and followed through the IAS, to the inferior and posterior LA walls. This is the known normal electrical activation process, as obtained by invasive electrophysiology techniques.
The atrial fibrillation cycle length (AFCL) is a critical parameter for the perpetuation and termination of AF. Currently, the total atrial activation time1, as indicated by the P-wave duration using signal-averaged (SA) electrocardiogram (ECG) (SA-ECG), is the most powerful predictor of atrial fibrillation. However, because of practical limitations, this technique is not used in clinical routine.
echocardiographic parameters for new-onset AF. There is no simple tool available to predict the onset this arrhythmia. Electrophysiological parameters are too complex and can not be obtained in bedside.
The identification of an abnormal electrical activation process could be of interest in some patients with atrial fibrillation or other supra-ventricular tachy-arrhythmias, in whom the premature atrial contraction acting as a triggering factor could be aggravated by local delayed conduction. Several studies have shown the independent prognostic value of atrial function measurements in subsets ofpatients.
Karl et al12, even as early as in 1978 in an article published by the AHA in Circulation showed that prolonged atrial conduction was a major predisposing factor for the development of Atrial flutter.
The multiple wavelet re-entry theory1 postulated the existence of multiple spatially discrete activation fronts (wavelets) resulting in re-entry at changing locations as the basis for AF. A decreased conduction velocity, leads to a shorter wavelength of the reentrant wave fronts. An increased atrial size can harbour more wave fronts of a certain size at the same time. Both will favour AF.
The change of the LA function in different phases can be assessed non-invasively by echocardiography, using conventional methods such as changes in LA area and volume, but they lack specificity.
imaging can be used to measure total atrial conduction time. A prolonged PA-TDI interval may predict the development of new-onset AF.
De Vos et al1 showed that an increased Total Atrial Conduction Time, which is the time elapsed between the initiation of atrial depolarization and the last depolarization of the same activation front, incorporates both conduction slowing and atrial dilatation, and may therefore reflect the existence of a substrate vulnerable for AF. Determination of the TACT may therefore be better than the classical predictors of AF since it might not only demonstrate the presence of underlying disease but also its severity. Thus, different LA walls with their corresponding levels from the mitral annulus can be compared and assessed, in particular by offline analysis of colour TDI, such as septal and lateral walls in an apical four-chamber view, anterior and inferior walls in a two-chamber view. The atrial myocardial velocity curve consists of three major deflections: ventricular systolic (Sa), early ventricular diastolic (Ea), and late ventricular diastolic (atrial contraction, Aa) waves. (The Aa-wave has been regarded as a direct measure of regional active atrial contraction on the longitudinal axis, which might be less load dependent. The Sa and Ea waves may represent the passive expansion and emptying components of the LA function. Approaching regional left atrial function by tissue Doppler velocity and strain imaging were described very early by Qing Zhang et al3.
In our study, TDI was done by placing a 2mm sample volume PWD at the lateral wall of the left atrium, just below the mitral annulus.
duration). Previous studies presented a similar parameter measuring the interval between the onset of the P wave on the ECG till the onset of the A’ wave of the left atrial lateral wall instead of the peak of the A’ wave (atrial electromechanical interval or AEMI). But, studies done later proved that the peak of the A’ wave is a better pointer than the onset of the wave. In our study, the peak of the A’ was used and the distance in milliseconds from the onset of the ‘p’ wave of the ECG was used.
The main new findings of this study2 are as follows:
(1) Some TVE-derived variables indirectly reflect the atrial electrical activation that follows the known activation process as revealed by invasive electrophysiology.
(2) The regional and global atrial mechanical function is explained by an upward movement of the atrial walls at the region near the A-V ring with a continuous reduction of this movement towards the upper levels of atrial walls.
(3) The atrial mechanical function is quite similar in all LA walls; however, all indices of mechanical function were higher in the RA than in the LA. The difference in the atrial velocities at different sites was attributed to an atrial free-wall motion higher than that of the bounded IAS. Furthermore, the larger pectinate muscle in the RA can perhaps generate a more pronounced and sustained longitudinal movement in the relatively low pressure system of the right ventricle.
longitudinal movement in the RA may be explained in part by the larger pectinate muscles in the RA, but also by the lower pressures in the heart's right side. To what extent circumferential contraction of the atrial muscle fibers might contribute to atrial mechanical function is unknown. Anatomically, the large amount of circumferential muscle fibers present in the vestibules of the RA and LA might imply some kind of circumferential or radial contraction of the atria.
(5) No correlations were found between 2-D- and TVE derived variables of atrial mechanical function, as was also found in a previous study by Donald et al. Although 2-D-derived variables measure volumes and volume-derived indices that might indicate some kind of atrial mechanical force, it was surprising to find no correlations between the variables obtained by the two different techniques. This might indicate that the velocities and the displacements registered from all atrial walls by TVE are less dependent on volume loading conditions than 2D derived variables and therefore could be used as reliable measurement of pure atrial mechanical contraction or inotropism. However, most of the TVE-derived variables expressing atrial mechanical function had good values of repeatability and measurement error. Assessing atrial mechanical function by measuring volumes is time consuming and depends on age, gender, and body surface area. In addition, atrial volume indices are also dependent on loading conditions and are not necessarily more reproducible than TVE-derived variables.
new-Therefore, the PATDI interval may become a useful measure for risk stratification to improve efficiency of primary prevention of AF.
In a study by De Vos et al1, they demonstrate that a short PA-TDI interval of <130 ms seems to prevent patients from developing AF. Therefore, one could hypothesize that these patients are not candidates for primary prevention. Patients with a PA-TDI interval of >165ms have a reasonable chance of developing AF and could be candidates for primary prevention using ‘‘upstream’’ cardiovascular drugs. A PA-TDI interval 190 ms makes patients very vulnerable for the development of AF. These patients could be treated with prophylactic anticoagulation.
In our study, 20 patients (12 %) developed new-onset AF. These patients had a longer PA-TDI interval than patients who remained in sinus rhythm (176ms vs. 148 ms, p < 0.05). With a PA-TDI interval <136 ms, none had AF (p < 0.05).
Other uses of measurement of total atrial conduction time:
Ischemic heart disease3:
Atrial contractile dysfunction appears early in ischemic heart disease (IHD), irrespective of previous myocardial infarction, co-existing systolic dysfunction, or severity of diastolic dysfunction. Yu et al, found that the VA’ measured at mid-level of the IAS and the lateral LA in the apical four chamber view were drastically reduced in 118 patients with IHD when compared with 100 normal subjects. A poor LV-ejection fraction and the presence of a restrictive LV filling pattern were the most important determinants of LA contractile dysfunction in IHD.
In our study, 10% of our patients had Coronary artery disease, and a significant number developed AF during follow-up.
Advanced heart failure and cardiac resynchronization therapy3:
Gabriel et al showed that the LA mechanical function can be modified by heart failure treatment, such as cardiac resynchronization therapy (CRT), which is of proven benefit to advanced heart failure patients with prolonged QRS duration.
In this study, 8% of the study patients were included as they had heart failure. 20% of those patients developed AF during follow-up. Even these patients might improve with CRT therapy.
Mitral stenosis and mitral regurgitation3:
overall LA emptying fraction and increased risk of thrombus formation. In a study by Wang et al, published in 2005, the LSW and LDW tissue velocities recorded during sinus rhythm at the lateral wall or at the tip of the LAA were markedly reduced in subjects with mitral stenosis when compared with normal subjects. Systolic velocity was further decreased in patients with spontaneous echo contrast (SEC) in the LAA than those without. In this present study, the bulk of the patients were suffering from RHD (44%) and the incidence of atrial fibrillation during follow-up was also high in those patients, in concordance with the previous studies (50% developed new onset AF).
LIMITATIONS
Study was not compared with electro physiological measurements.
For the future:
CONCLUSIONS
Tissue Doppler imaging can be used to measure total atrial conduction time.
BIBLIOGRAPHY
1. Atrial tissue Doppler imaging for prediction of new onset atrial fibrillation, C B De Vos et al, Heart 2009; 95:835–840.
2. Assessment of atrial regional and global electromechanical function by tissue velocity echocardiography: a feasibility study on healthy individuals
Quintana M, Lindell P, Saha SK, del Furia F, Lind B, Govind S, Brodin L Cardiovascular Ultrasound 2005, 3:4 (18 February 2005)
3. Approaching regional left atrial function by tissue Doppler velocity and strain imaging Qing zhang et al, Oxford Journals MedicineEP Europace Lvolume 10 supplement 3 Pp. iii62-iii69
4. Intra-Left Atrial Mechanical Delay Detected by Tissue Doppler Echocardiography Can Be a Useful Marker for Paroxysmal Atrial Fibrillation Deniz, Ali et al Echocardiography - Jnl Cardiovascular Ultrasound & Allied Techniques, Volume 26, Number 7, August 2009 , pp. 779-784(6)
5.Assessment of Atrial Conduction in Patients with Scleroderma by Tissue Doppler Echocardiography and P Wave Dispersion
Ilknur Cana, Ahmet Mesut Onatc, Kudret Aytemira, Ali Akdoganb, Kemal Uretenb, Sedat Kirazb, Ihsan Ertenlib, Necla Ozera, Lale Tokgozoglua, Ali
Cardiology 2007;108:317-321
7. Braunwald’s Heart Disease: A Textbook of Cardiovascular Medicine, 8th ed. 8. The Echo Manual, 3rd Edition Oh, Jae K.; Seward, James B.; Tajik, A. Jamil
9. Feigenbaum’s Echocardiography, 6th Edition, Feigenbaum, Harvey; Armstrong, William F.; Ryan, Thomas
10.Helle-Valle T, Crosby J, Edvardsen T, et al: New noninvasive method for assessment of left ventricular rotation: speckle tracking echocardiography. Circulation 112:3149, 2005.
11.Hurst's The Heart, 12th Edition
12. Karl et al , Circulation vol 57, no 2, february 1978
13. Assessment of regional atrial function in patients with hypertrophic cardiomyopathies using tissue Doppler imaging.
Telagh R, Hui W, Abd El Rahman M, Berger F, Lange PE, Abdul-Khaliq H. Pediatr Cardiol. 2008 Mar;29(2):301-8.
14. Clinical utility of tissue Doppler imaging in prediction of atrial fibrillation after coronary artery bypass grafting.
Benedetto U, Melina G, Roscitano A, Ciavarella GM, Tonelli E, Sinatra R. Ann Thorac Surg. 2007 Jan;83(1):83-8.
15. Pictorial representation of atrial depolarization on the basis of dipole electrocardiotopography (decarto) for diagnosis of atrial enlargement
Advances in electrocardiology 2004 (pp 644-647) author(s):l.i. titomir
GLOSSARY AND ACRONYMS
AF- Atrial fibrillation
COPD-chronic obstuctive pulmonary disease CAD- Coronary artery disease
HOCM-Hypertrophic obstructive cardiomyopathy RHD-Rheumatic Heart disease
TDI- Tissue doppler imaging
PROFORMA
Age Sex Occupation date
RISK FACTORS
Diabetes Hypertension Coronary artery disease
Rheumatic heart disease chronic obstructive pulmonary disease (COPD), thromboembolic events,
heart failure, myopathies.
Medication use
ECG
Heart rate(bpm) P-wave duration PR interval
QRS duration (ms)
Tissue Doppler imaging PA-TDI interval
Maximal A’ –wave velocity (cm/s)
Dimensions ( Echo cardiography) Aorta diameter(mm)
Left atrial dimension(mm)
End diastolic volume(ml) End systolic volume(ml) Caval vein(mm)
Left ventricular function
Left ventricular ejection fraction (%) Hypokinesia
Mitral valve Doppler assessments
Maximal E – wave velocity (m/s) E – wave deceleration time (ms) Maximal A – wave velocity (m/s) E/A ratio