PROSPECTIVE STUDY ON HAEMATOLOGICAL
AND COAGULATION CHANGES IN ACUTE
PANCREATITIS
Dissertation submitted in partial fulfilment of the
requirements for the award of the degree of
DM (MEDICAL GASTROENTEROLOGY)
BRANCH - IV
of
THE TAMILNADU Dr. M.G.R. MEDICAL UNIVERSITY,
CHENNAI, INDIA.
MADRAS MEDICAL COLLEGE,
DECLARATION
I solemnly declare that this dissertation titled “Prospective study on haematological and coagulation changes in Acute pancreatitis” is done by me in the Department of Medical Gastroenterology,Madras Medical college &
Rajiv Gandhi Government General Hospital,Chennai under the guidance and
supervision of Professor & Head of the Department ,Department of Medical
Gastroenterology,Madras Medical College & Rajiv Gandhi Government
General Hospital,Chennai.This dissertation is submitted to the Tamilnadu
Dr.MGR Medical University ,Chennai in partial fulfilment of the university
requirements for the award of the degree of DM Medical Gastroenterology.
Place : Chennai Dr.Shafique.A
Date : Postgraduate student,
Dept of Medical Gastroenterology. Madras Medical College,
CERTIFICATE
This is to certify that the dissertation entitled “PROSPECTIVE STUDY ON HAEMATOLOGICAL AND COAGULATION CHANGES IN ACUTE PANCREATITIS.” is the bonafide work done by Dr. SHAFIQUE.A,under our guidance and supervision in the Department of Medical Gastroenterology, Rajiv Gandhi Government General Hospital,
Madras Medical College, Chennai submitted as partial fulfilment for the
requirements of D.M.Degree examination Branch IV MEDICAL
GASTROENTEROLOGY,AUGUST 2013,under The Dr.M.G.R.Medical
University ,Chennai.
Dr. T. Pugazhendhi ,MD.,DM Dr. Mohammed Ali MD.,DM Additional Professor, Professor & HOD
Dept of Medical Gastroenterology, Dept of Medical Gastroenterology Madras Medical College & Madras Medical College &
Rajiv Gandhi Govt.General Hospital Rajiv Gandhi Govt general Hospital Chennai -03 Chennai -03.
Dr.V.Kanagasabai, M.D.,
The Dean,
Madras Medical College &
ACKNOWLEDGEMENT
I sincerely thank the Dean, Prof. Dr. V.KANAGASABAI M.D.,Dean, Madras Medical College and Rajiv Gandhi Government General Hospital,
Chennai-3 for having permitted me to use hospital resources for the study.
I have great pleasure in expressing my gratitude and respect to
Prof.Dr.MOHAMMED ALI M.D.D.M,Professor and Head of Department of Medical Gastroenterology, Madras Medical College ,Chennai, for his valuable
suggestions, kind guidance, constant supervision and moral support ,without
this study would not have been possible.
I have great pleasure in expressing my gratitude and respect to
Prof.Dr.T.PUGHAZHENDHI,M.D.,D.M.,Additional Professor,Department of Medical Gastroenterology, , Madras Medical College for his valuable
guidance and constructive suggestions.
I express my heartfelt gratitude to Dr.T.Usha ,Associate Professor, Department of Haematology, Madras Medical College, Chennai for her able
guidance without whom this study is not possible.
I thank my colleagues, Dr T.K.Anand, Dr.M.Radha, Dr.Arvind M.A, Dr.Hemamala, Dr.P.Senthilkumar for their help and assistance in successfully completing the study.
I express my sincere gratitude to all the patients who participated in the
study.This work would be complete if it had contributed ,even in the smallest
TABLE OF CONTENTS
S.NO TITLE PAGE NO
1 INTRODUCTION 1
2 AIM OF THE STUDY 7
3 REVIEW OF LITERATURE 8
4 MATERIALS AND METHODS 19
5 OBSERVATIONS AND RESULTS 28
6 DISCUSSION 56
7 CONCLUSION 62
BIBLIOGRAPHY
ANNEXURES
ABBREVIATIONS PROFORMA
MASTER CHART
[image:6.595.84.542.125.720.2]ABBREVIATIONS
APTT - Activated partial thromboplastin timePT - Prothrombin time
INR - International Normalised ratio
FDP - Fibrinogen Degradation Product
AP - Acute pancreatitis
APACHE - The Acute Physiology and Chronic Health evaluation
CRP - C- reactive protein
CT - Computerised Tomography
USG - Ultra sonogram
ASA - Aminosalyclic acid
ERCP - Endoscopic retrograde Cholongio pancreatography
BISAP - Blood urea nitrogen/Impaired mentalstatus/SIRS
score/Age/pleural effusion.
IL - Interleukins
CTSI - Computerised tomography severity index.
TF - Tissue factor
Vwf - Vonwillibrand factor.
SIRS - Systemic inflammatory response syndrome
DIC - Disseminated Intrvascular coagulation
PAI - Platelet activator inhibitor.
ISTH - International society on thrombosis and haemostasis.
INTRODUCTION
Acute pancreatitis was defined in the Atlanta symposium as an acute
inflammatory process involving the pancreas that further involve
peripancreatic tissues and organs remote from the pancreas. Criteria had been
defined for severity which include organ failure (Pulmonary
insufficiency,shock and renal failure) and /or complications involving locally
which include pseudocyst.pancreatic necrosis and pancreatic abscess41 .
The diagnosis of the disease requires 2 out of the following 3 features43:
1) Abdominal pain characteristic of acute pancreatitis.2) serum amylase and
/or lipase which is 3 times the upper limit of normal and 3) characteristics
findings in Imaging ( USG/CT scan).The severity of acute pancreatitis does
not correlate with the rise in level of serum lipase and amylase.Risk factors of
severity of acute pancreatitis at admission include older age,obesity and organ
failure.
Tests at admission which distinguish mild from severe acute pancreatitis
include APACHE-11 score( 8-suggestive of severe AP) and serum
haematocrit ( <44 suggests mild acute pancreatitis). A high CRP level
measured within 72hours correlates with formation of pancreatic necrosis.
Pancreatic necrosis and persistent organ failure were the most important
investigation to distinguish interstitial from necrotizing type of acute
pancreatitis is CECT abdomen and it is more sensitive and specific especially
if taken 2-3 days after the onset of illness. Mortality rate increases to >40%
when the multisystem organ failure coexistent with necrotizing type of acute
pancreatitis.
The commonest etiological factors observed in AP were Chronic
Alcohol abuse and Gallbladder stones11. They comprise about 80% of all
cases (Forsmark et al 2007). Around 10% of the cases, the cause was
unknown (Tonsi et al 2009). Some other causes of Acute pancreatitis were
hypercalcemia, hypertriglyceridemia, trauma, drugs like methyldopa,
5-ASA, L-asparginase, scorpion sting, duodenal diverticula,parasites,annular
pancreas, choledochocele, infections (coxackie,measles, mycoplasma,
leigonella, leptospira, salmonella and tuberculosis) , hereditary ,
autoimmune causes ,tumors ,endoscopic retrograde cholangiopancreatography
(ERCP) and developmental abnormalities.
The Theory behind the pathogenesis of acute Pancreatitis was proposed
as acinar cells injury, which in turn leads into pancreatic enzymes leakage
into pancreatic tissue. These enzymes get activated and initiate the process of
lipase breaks down cell membranes and tissues which in turn causes
vascular damage, oedema,, haemorrhage and necrosis.
The development of acute necrotizing pancreatitis is usually associated
with pancreatic glandular necrosis. Acinar cell apoptosis, the release of
cytokines, activation of coagulation, tissue ischemia, and tissue necrosis are
key factors in the progression of the condition38, as well as in the
development of associated extrapancreatic complications. (Steinberg &
Tenner, 1994; McKay & Buter, 2003; Pandol et al., 2007).
Atlanta classification divided acute pancreatitis into two broad
categories36,41
Mild Acute Pancreatitis:(edematous and interstitial)
It was defined as pancreatitis associated with minimal organ dysfunction
and an uneventful recovery.
Severe Acute pancreatitis:(necrotizing ) 42.
Criteria for severe acute pancreatitis included any of the following:
A Ranson’s score of 3 or more and /or an APACHE11 score of 8 or
/or gastrointestinal bleeding ) and /or local complications( pancreatic necrosis,
abscess or pseudocyst).
Predictive marker for severity37:
Clinical assessment,clinicophysiological scoring systems, imaging
techniques and biochemical markers.
There are Prognostic system criteria for assessing severity including
Atlanta severity criteria, Ranson’s criteria ,Glasgow score, APACHE11 score,
SIRS score, recent severity score like BISAP score, Panc 3 score, Japanese
severity score, Harmless acute Pancreatitis Score and artificial network scores.
Apart from these, Biochemical scores like C- reactive Protein, Procalcitonin,
Serum Amyloid A, Trypsinogen Activation Peptide, Polymorphonuclear
Granulocyte Elastase, Interleukins IL-6&MCP-1,Hematocrit and BUN 28.
In spite of all these clinical & biological markers ,There is yet no single
marker could serve as an optimal predictor of disease severity in acute
pancreatitis48.
Of the imaging methods Contrast enhanced CT scan abdomen is
currently the best imaging method recognised for assessment of severity in
acute pancreatitis. Balthazar and his co-workers formulated a new index called
as CT severity index(CTSI) which showed a good correlation with the
clinical parameters in patients with acute pancreatitis.
CT grade as per Balthazar score 35
A - normal
B - focal or diffuse enlargement of the pancreas, including
irregularities of contour and inhomogeneous attenuation;
C - pancreatic gland abnormalities in B plus peripancreatic
inflammation;
D - grade C plus a single fluid collection;
E - grade C plus 2 or more fluid collections and /or the
presence of gas in or adjacent to pancreas.
This index scores the degree of pancreatic inflammation and necrosis on
a scale with a maximum of 10points.Patients with a severity index of 0-1
exhibited no morbidity or mortality, whereas 4% morbidity rate and no
mortality rate were seen with CT severity index of 2. In contrast, patients with
Mortele et al modified the CTSI by introducing extrapancreatic
complications( Pleural effusion,ascites,vascular and GI complications)
Modified CT Severity Index34
Prognostic Indicator Points
Pancreatic inflammation
Normal pancreas 0
Intrinsic pancreatic abnormalities with/without inflammatory changes in peripancreatic fat
2
Pancreatic or peripancreatic fluid collection or peripancreatic fat necrosis
4
Pancreatic necrosis
None 0
<30% 2
>30% 4
Extrapancreatic complications
One or more of pleural effusion,ascites,vascular
complications,parenchymal complications,or gastrointestinal involvement.
2
The Haematological and coagulation parameters were assessed in the
study population and these indices are correlated with the severity of disease
AIM OF THE STUDY
To Study the Haematological and coagulation changes prospectively in
REVIEW OF LITERATURE
Haematological and coagulation abnormalities in acute pancreatitis
were noted in literature studies1.
Trapnell (1966)in his study reported falls in values of hemoglobin,
white blood cell count and haematocrit in acute pancreatitis patients9.
Innerfield, Angrist and Benjamin (1952) noted a state of
hypocoagulability, whereas other workers have observed a
hypercoagulable state. (Shinowara et al., 1963)8.
Disseminated intravascular coagulation (DIC) has been observed in
acute pancreatitis4 (Minna, Robboy and Colman, 1974; Yoshikawa, Tanaka
and Guze, 1971) and post-mortem studies also have confirmed the presence of
widespread thrombosis in a proportion of cases.(Smyth, 1940).
Desmond Murphy and Clement W.Imrie in their study showed fall in
Hemoglobin (48%) and Haematocrit (88%) of their patients. They also showed
reticulocytosis in 22% of their patients.
The fall in hemoglobin and haematocrit may be caused by a
Gastric erosions, acute peptic ulceration and bleeding into the pancreatic
tissues or a pseudo-cyst, are usually considered the major causes of a falling
hemoglobin in patients with acute pancreatitis, and this additional cause must
be kept in mind.
Leucocytosis has been observed in patients with AP and has been
related to the more severe form of the disease.
Normal Haemostasis:
Haemostasis normally involve endothelial cells and vessel wall and
soluble plasma proteins like coagulation proteins with their regulators,
cellular components in blood which included, platelets ,RBC and leukocytes21.
It also include microparticles derived from leukocytes and platelets.. This is
a physiologic process which has the capacity to produce a haemostatic plug
outside a damaged blood vessel and also controls the fluidity of blood.
Thrombosis was yet another event which takes place inside the lumen of
the vessel , consists of following events which include 22
a) accumulation of platelets,
b) activation,
c) adhesion of platelets
e) and fibrin formation preceded by TF-initiated thrombin generation.
Thrombin formation along with coagulation of blood occurring in
vascular damaging site, is induced by platelets which were adherent to vessel
wall. The haemostatic process was counter-balanced by anticoagulant
mechanisms in normal individual which ensure the regulation of haemostatic
effect. In pathological states (e.g. in systemic inflammation), the haemostatic
events escapes the control mechanism ,leading to thrombosis.
Coagulation Model :
Years before, the coagulation model was proposed which was called
“cascade model” and it was classified into intrinsic and extrinsic pathways,
and the common pathway was united at the factor X level. (Macfarlane
1964,Davie and Ratnoff 1964;) This model proposed that coagulation of
blood involves a series of calcium-dependent conversions of proenzymes to
the serine proteases .26.This event converts prothrombin into thrombin
(Dahlback 2000).
The extrinsic pathway which occurs after the vascular damage, where
in the tissue factor is exposed to the circulation which binds and transfers
factor VII to FVIIa. The TF-FVIIa forms a complex and this complex is
The intrinsic pathway involves factor XII contact activation and it
occurs only in the presence of HMWK and prekallikrein . The FXIIa is
responsible for activation of factorXI to XIa. This event further activates
factor IX to IX a. Finaly FIXa activates both factor VIIIa and factor X.
The common pathway involves both FXa and Factor Va by forming a
prothrombinase complex, thereby causing conversion of prothrombin to
thrombin which in turn converts fibrinogen to fibrin30. The contribution of
platelets was considered to be an independent mechanism in primary
hemostasis. APTT measures the intrinsic pathway whereas PT measures the
extrinsic pathway and these 2 tests were important in hemostasis .
Platelets role in acute pancreatitis:
The platelet plug intermingled with the fibrin meshwork forms the
thrombus formation . Fibrinogen and Von Willi brand factor (VWF) initiates
the adhesion of platelets of vascular injury site. These factors are important
for the propagation and amplification phases of coagulation12. These factors
provide a surface of the damaged area which lies in close proximity.The
elements for coagulation were situated in that area.Vascular damage expose
the collagen which in turn activate the platelets and formation of thrombin.
Studies have shown that in acute pancreatitis, platelets were activated , and
Evidence of increased platelet activation associated with pancreatitis has
long been established in experimental animal models. In rabbits,
administration of pancreatic fluid from patients with chronic pancreatitis
induced platelet aggregation and activation (Prinz et al., 1984). In cases of
acute pancreatitis, activated platelets along with indices ie., Platelet large cell
ratio, platelet mean volume and distribution width have also been shown to be
elevated between onset and remission of AP(Mimidis et al., 2004).
While a heightened platelet response is typical of patients with mild AP,
a decreased platelet count (due to increased consumption of platelets) is
observed in cases of severe AP49. Low plasma levels of platelets in patients
with AP are also associated with poor clinical outcome(Maeda et al., 2006).
DIC is a condition which is acquired by intravascular fibrin deposition
and microvascular thrombosis following a systemic activation of coagulation2.
Bleeding occurs due to increased consumption of coagulation factors and
platelets .The organ failure occurs due to vascular thrombosis32.
DIC is associated with conditions like malignancy, hepatic failure,
immunological/toxic reactions, vascular abnormalities and organ failure
conditions like severe acute pancreatitis. DIC is of two types6. The first type is
The former one is more dangerous as it indicates a decompensated
hemostatic system2. Sepsis and Trauma were the commonest condition leading
to DIC in 30% and 50% respectively10, which further increases the death risk
in these patients.
Studies have shown that activation of pancreatic enzymes do have role
in pathogenesis of Disseminated intravascular coagulation.5
The effects of DIC were natural anticoagulant system suppression,
fibrinolytic system suppression due to increased level of PAI-1 and there was
increase in production of fibrin2,6 .Thus all anticoagulant mechanism were
suppressed during the course of DIC6.
ISTH Diagnostic Scoring System for DIC
Risk assessment: Does the patient with underlying disorder known to be
associated with overt DIC?
• If yes proceed further
• If not, don’t use this algorithm.
Order global coagulation tests (PT, platelet count, fibrinogen, D-dimer)
Score the test results:
• Platelet count (>100 k/µL = 0, <100 k/µL = 1, <50 k/µL = 2)
• Prolonged PT (<3 sec = 0, >3 sec but <6 sec = 1, >6 sec = 2)
• Fibrinogen level (>100 mg/dL = 0, <100 mg/dL = 1)
Calculate score:
• If 5, compatible with overt DIC: Repeat score daily.
• If <5, suggestive (not affirmative) for nonovert DIC: Repeat next 1–2
days.
Coagulative disturbances in acute pancreatitis :
Accelerated fibrinolysis and consumptive coagulopathy are the known
coagulation abnormalities that can occur in severe AP and they are related to
organ failure3,7.
Perfusion and hypoxia of pancreatic organ plays vital role in formation
of pancreatic necrosis46.There are several studies which states that micro
vascular abnormalities like inadequate perfusion,shunting,vasoconstriction and
increased blood viscosity are responsible for progression of AP7. Pancreatic
tissue blood flow is another factor when it gets reduced, is a marker of severe
AP47.
Blood coagulation parameters such as activated partial thromboplastin
in patients with AP (Radenkovic et al., 2009). However, there have been no
reports of significant alterations in partial thromboplastin time (APTT) levels
in these patients. with AP 3. While these measurements suggest some early
haemostatic disturbances of AP, their usefulness in predicting patient outcome
is questionable. Clinical studies which measure other parameters (most
notably FDP and antithrombin) have demonstrated an improved specificity and
sensitivity in predicting outcome for these parameters than PT or APTT.
Sawa et al in his study have shown that Plasma TF23 had higher value
when compared with normal volunteers in severe AP, but the difference is not
statistically significant.
Plasma levels of TF in alcoholic severe AP27with pancreatic necrosis
was significantly higher than that in alcoholic severe AP without pancreatic
necrosis or that in nonalcoholic severe AP with pancreatic necrosis. These
findings suggest that an increase in plasma TF may be related to the
development of pancreatic necrosis in alcoholic severe AP44.
Markedly elevated plasma fibrinogen levels,elevated FDP levels are
consistent with intravascular coagulation although they may be interpreted as
a non-specific reaction to injury40.These changes have been noted previously
state (Shinowara et al., 1963; Hirayama et al., 1974; Mungall and Hague,
1975).
The Other possible explanations for elevated FDPs in patients with
acute pancreatitis include obstructive jaundice, liver disease, pulmonary
embolus and venous thrombosis (Merskey et al., 1966) or local haemorrhage
(Malleson, 1974).
Therapeutic approach in modulating hemostasis in AP :
Recombinant Drotrecogin alpha activated was the first biological
agent studied in improving survival in patients with severe sepsis15. Activated
Protein C was used as a cytoprotective signaling molecule involved in
apoptosis, inflammation and vascular permeability17. This was first studied in
rat model and it was shown to result in significant decreases in serum
IL-8,TNF levels and MMP-9, an enzyme which degrades extracellular matrix
components in larger range18. Coagulopathy in severe AP was characterized
by significantly prolonged APTT and PT, marked leukocytosis, and
thrombocytopenia, decreased fibrinogen levels which were not significant in
Treated versus untreated APC rats. Alsfasser et al., 2006; Chen et al., 2007 and
Yamanel et al., 2005 have shown survival benefit in various models in AP
Chen et al., 2007 in his Study have demonstrated good efficacy when
treated with high bolus APC injections and also Alsfasser et al demonstrated
infusion in hourly basis in 200645.Some studies suggested that APC doesn’t
offer any survival benefit in early phase Acute pancreatitis14. When APC was
used in lower dose of 24 ug/kg, it offers no therapeutic benefit compared with
APC bolus ie., 100 ug/kg or hourly regimen24.
Platelet activating factor (PAF) modulation had been studied in
experimental acute Pancreatitis25. In trypsin injection and sodium
taurodeoxycholate models, Platelet activating factor is released into the
bloodstream peritoneal fluid, of rats13. PAF inhibition with an antagonist
accelerate its degradation and causes decrease inflammation resulting in
reductions in pro-inflammatory cytokines .
Andersson et al., 2007 in his study describe the usage of novel FVIIa
inhibiting agent which was investigated in an intraductal taurodeoxycholate
infusion model of AP16.
Administration of and N-acetylcysteine and activesite inactivated FVII
given 90 minutes prior to AP induction causes a reduction in MPO levels in
distant organs like ileum and lungs and also reductions in plasma IL-6 levels
compared to saline which acts as controls when it occurs 6 hours after acute
Bleeker et al in 1992 demonstrated that high dose Anti Thrombin -lll
had been tried in taurocholate induced pancreatitis in rat model 20which had
shown that there was improvement in survival rate. But Anti thrombin was
found to be ineffective in improving mortality20 in critically ill acute
MATERIALS AND METHODS
Study Centre:
Department of Medical Gastroenterology, Madras Medical College
and Rajiv Gandhi Government General Hospital, Chennai
Duration of the Study:
1year
Study Design:
Prospective
Sample Size:
50 cases
Inclusion Criteria:
Patients who are admitted in Department of Medical and surgical
Gastroenterology and those patients admitted in other Medical and surgical
wards with History and investigations suggestive of Acute pancreatitis.
Exclusion Criteria:
• Patients not willing for study.
• Patients with known Haematological disorders.
• Patients with pre-existing or coexisting Chronic liver disease
• H/o surgery in recent past
• Post ERCP pancreatitis
• Post infectious pancreatitis.
Patient selection and Data collection:
50 patients with clinical features of abdominal pain characteristic of
acute pancreatitis ,serum amylase and /or lipase 3times upper limit of normal
and CT scan showing characteristic features of acute pancreatitis were chosen
and their Haematological and coagulation indices were studied prospectively
over a period of 1 year.
Methods:
Detailed clinical history of all 50 patients and thorough physical
examination of all 50 patients have been done.
Serum amylase/Lipase was done for all patients.
Liver function tests,Renal function tests,Xray chest PAview,Ultra
sonogram abdomen and contrast enhanced CT abdomen were done for all
patients to rule out various complications associated with acute pancreatitis.
Etiological workup was done for all 50patients with relevant
Patients were grouped into mild and severe pancreatitis by using
Balthazar CT scoring system and Modified CT severity index score.
Mild Pancreatitis – Balthazar CT score Grade- A,B,and C/ CT SI index 6
Severe Pancreatitis - Balthazar CT score Grade –D and E,CTSI 7
Presence of pleural effusion either unilateral or bilateral by chest
radiograph or CT scan correlates with severe pancreatitis. Haematological and
coagulation parameters are assessed for all patients .
Haematological indices :
1) Complete blood count which includes
Haemoglobin in gms%
Haematocrit in %
Total white blood cell count /cells in cu.mm
RBC count in millions/cu.mm
Differential count in %
ESR in mm/hr
Platelet count in cu.mm
Method of examining CBC :
Automated haematology analyzer50:
Blood taken for examination is mounted on a rack after adequate
mixing. Different elements of the blood were analyzed by different
components of the instrument. Number and different cell types were analyzed
by cell counting compartment .Finally the computer review the results.
These analyzer machines aspirate only small volume of blood.
Aspiration is done through narrow tubing where sensors for counting the
number of cells located. These sensors can pick up the type of blood cells50.
Apart from counting and analyzing the white blood cells, Red blood
cells and platelets, these analyzers also measure the haemoglobin
concentration in blood and also within red blood cells.
1) Haematocrit :
with macromethods or micromethods, or indirectly as the product of the mean
corpuscular volume (MCV) times RBC count in automated instruments52. Here
the automated method is used.
2) Reticulocyte count : automated method.
Reticulocyte fractions are separated based on RNA content, with the
more immature cells containing the highest amount of reticulum. The
immature reticulocyte fraction (IRF) quantitatively describes the youngest
reticulocytes with the greatest staining intensity50.
It involves addition of stain such as new methylene blue and oxazine to
detect the RNA content of RBC.
3) Peripheral smear :
Steps : Examination of Wet preparation
Making and stain blood films-Polychrome methylene blue and eosin
(Wright’s) stain commonly used.
Coagulation Parameters :
Bleeding time and clotting time
Duke process of Bleeding time estimation
The patient was pricked, preferably on the ear finger tip or ear lobe
3–4 mm deep. Then with help of filter paper ,blood is wiped every 30seconds.
The test comes to an end when bleeding stops. The normal Bleeding time is
around 2–5 minutes52.
Clotting time:
5ml of blood is placed in a glass container, kept at body temperature and
observed .Normal clotting should occur in 5-15mts.
PT/INR :
Tissue thromboplastin (recombinant human or isolated animal tissue
factor) and patient plasma were incubated for several minutes, after which the
citrated plasma mixture is recalcified by the addition of excess CaCl2, and the
time required for clot formation is measured. The time to fibrin strand
formation is then measured automatically by photo optical device50.
The PT serves as the basis for the international normalized ratio (INR)
value which is used to monitor patients on warfarin. The INR is the ratio of
patient PT divided by geometric mean normal PT for the local laboratory
(based on a population of normal individuals assessed with identical
reagents,sample collection and machines), which is raised to the power of the
international sensitivity index. Although the INR is clearly the most
both PT and INR are used and INR is used in analysis with normal ratio of
0.9-1.252. The PT measures the extrinsic coagulation pathway of coagulation,
which consists of activated FVII (FVIIa) and TF and proteins of the common
pathway (factors X, V, II, and fibrinogen)
Activated partial thromboplastin time :
A mixture of a negatively charged surface, phospholipid, and
anticoagulated patient plasma(3.2 g% sodium citrate) was incubated for
several minutes.. When whole blood is taken, the ratio of anticoagulant to
whole blood was 1 part anticoagulant to 9 parts whole blood. Patient’s plasma
is incubated with the above mixture for a particular time. Then the sample
was added with excess calcium chloride, and the clot formation time is
measured52. The APTT assesses the coagulation proteins of the so-called
intrinsic system and common pathways. This assay was commonly referred to
as the partial thromboplastin time (PTT), but it was actually an “activated”
PTT, in that its reagents contain a negatively charged surface which
accelerates the rate of the reaction. The APTT measures proteins of the
intrinsic coagulation system (FXII, prekallikrein, ,HMWK, FXI, FIX, and
FVIII) and proteins of the common pathway ( fibrinogen,factors X, V,and
Fibrinogen :
Whenever the reason for prolongation of APTT or PT could not be
explained by any means, measurement of fibrinogen level is a valuable tool in
identifying the bleeding tendency.
• Fibrinogen assay can be 4 methods
• Clauss
• PT- derived Fibrinogen assays
• Immunological
• Gravimetric assays.
Clauss assay:
Procedure :
Reference plasma with known level of fibrinogen is calibrated with a
international standard in a series of dilution and a curve is constructed to create
a range of fibrinogen concentration .After that for each of the dilution,
clotting time is established and this is plotted on a log graph.When the
concentration is 1:10,it is equivalent to 100%50.
Thrombin and phospholipids are added to diluted plasma which is
of calcium is compared with the curve and fibrinogen concentration is
deducted from that.
Fibrinogen degradation Product :
It is the protein fragment formed by the enzymatic reaction of plasmin
over fibrinogen and fibrin. It aids in detecting the degree of intravascular
coagulation. It also detect fibrinolysis when there is dissolution of fibrin in
clot50.
Test is done using latex agglutination assay.
Whole blood should be drawn into tube with Thrombin/Soybean trypsin
inhibitor for measuring this assay.
All these parameters were analysed with respect to severity of AP.
Data obtained by above methods were analysed by
1. SPSS 15
2. Chi square tests.
OBSERVATIONS & RESULTS
Evaluation of the study subjects : Observation:
The study subjects were evaluated according to their age and sex
distributions related to acute pancreatitis.
Table -1 Sex distribution :
Sex Frequency Percent
Male 44 88.0
Female 6 12.0
Total 50 100.00
The above table-1 shows 88% of acute pancreatitis patients were males when
[image:35.595.137.531.495.748.2]Table 2 - Age wise distribution of study subjects:
Age (Yrs) Frequency Percent
11-20 4 8.0
21-30 14 28.0
31-40 21 42.0
41-50 7 14.0
Above 50 4 8.0
Total 50 100.0
The above table -2 shows 42% of acute pancreatitis in 31-40 age group and
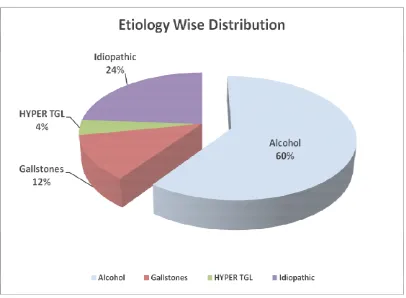
[image:36.595.130.526.391.667.2]Table 3 :Etiology wise distribution of study subjects:
Etiology Frequency Percent
Alcohol 30 60.0
Gallstones 6 12.0
Hyper TGL 2 4.0
Idiopathic 12 24.0
Total 50 100.0
Table3 shows majority of patients were alcoholic (60%) in this study followed
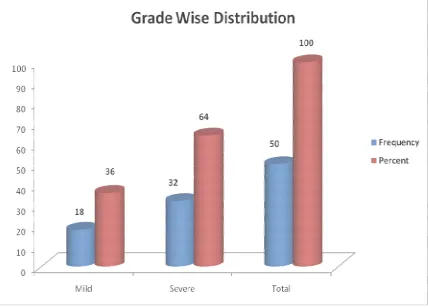
[image:37.595.114.520.392.690.2]Table 4 : Grade wise distribution of study subjects :
Grade of Severity Frequency Percent
Mild 18 36.0
Severe 32 64.0
Total 50 100.0
Table 4 shows 64%% of study subjects were in severe group and 36% in mild
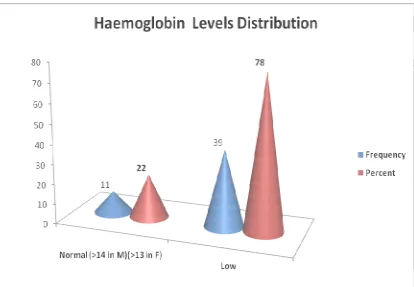
[image:38.595.103.531.334.642.2]Table 5 : Haemoglobin levels distribution of study subjects:
Haemoglobin% Frequency Percent
Normal (>14 in M)
(>13 in F) 11 22.0
Low 39 78.0
Total 50 100.00
[image:39.595.110.524.290.577.2]Table 6: Total count levels distribution of study subjects:
Total WBC Count Frequency Percent
Normal 38 76.0
<4000 2 4.0
>11000 10 20.0
Total 50 100.00
Table 6 shows Leukocytosis was seen in 20% of study subjects and
[image:40.595.103.531.381.649.2]Table 7: Polymorph levels distribution of study subjects :
Polymorph% Frequency Percent
40-80% 35 70.0
<40% 1 2.0
>80% 14 28.0
Total 50 100.00
[image:41.595.115.517.376.636.2]Table 8 :Haematocrit levels distribution of study subjects:
HCT% Frequency Percent
40-45% 9 18.0
<40% 38 76.0
>45% 3 6.0
Total 50 100.00
Table 8 shows Haematocrit levels were lower in 76% of patients ,where
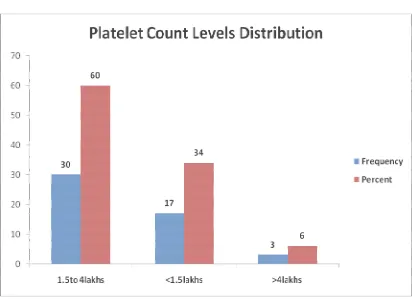
[image:42.595.114.520.402.643.2]Table 9 : Platelet count levels distribution of study subjects :
Platelet Count level Frequency Percent
1.5to 4lakhs 30 60.0
<1.5lakhs 17 34.0
>4lakhs 3 6.0
Total 50 100.00
Table 9 shows Low platelets were found in 34% and high platelets
[image:43.595.110.525.376.675.2]Table 10 : INR levels distribution of study subjects:
INR Frequency Percent
< 1.2 36 72.0
> 1.2 14 28.0
Total 50 100.0
[image:44.595.121.513.349.612.2]Table 11: APTT levels distribution of study subjects :
APTT Frequency Percent
24-36s 38 76.0
>36s 12 24.0
Total 50 100.0
[image:45.595.121.515.323.623.2]Table 12: Fibrinogen levels distribution of study subjects:
Fibrinogen Frequency Percent
180-350mg/dl 23 46.0
<180 mg/dl 8 16.0
>350mg/dl 19 38.0
Total 50 100.0
Table 12 shows Increase in fibrinogen levels in 38% and decrease in
[image:46.595.139.502.117.231.2] [image:46.595.128.541.351.678.2]Table 13: FDP levels distribution of study subjects :
FDP Frequency Percent
5µg/ml 42 84.0
>5µg/ml 8 16.0
Total 50 100.0
[image:47.595.150.501.115.244.2] [image:47.595.113.523.349.626.2]STATISTICAL ANALYSIS
Table- 1 Sex distribution in relation to Grade of acute pancreatitis
Sex Distribution Grade Total Significance
Mild Severe
Male
Count 15 29 44 Chi square
% within Sex 34.1% 65.9% 100.0% 0.580
% within Grade 83.3% 90.6% 88.0%
Female
Count 3 3 6 P>0.05
% within Sex 50.0% 50.0% 100.0% Not significant % within Grade 16.7% 9.4% 12.0%
Total
Count 18 32 50
% within Sex 36.0% 64.0% 100.0%
% within Grade 100.0% 100.0% 100.0%
Out of 44(88%) male patients ,29(90.6%) were in severe category and
15(83.3%) were in mild category.The observed difference between mild and
[image:48.595.90.537.205.490.2]Table 2- Age distribution in relation to grade of acute pancreatitis
Age Group in Years Grade Total Significance
Mild Severe
11-20
Count 1 3 4 Chi square % within Age Group
in Years 25.0% 75.0% 100.0% 0.857 % within Grade 5.6% 9.4% 8.0% P>0.05
21-30
Count 4 10 14 Not
significant % within Age Group
in Years 28.6% 71.4% 100.0% % within Grade 22.2% 31.3% 28.0%
31-40
Count 9 12 21
% within Age Group
in Years 42.9% 57.1% 100.0% % within Grade 50.0% 37.5% 42.0%
41-50
Count 3 4 7
% within Age Group
in Years 42.9% 57.1% 100.0% % within Grade 16.7% 12.5% 14.0%
Above 50
Count 1 3 4
% within Age Group
in Years 25.0% 75.0% 100.0% % within Grade 5.6% 9.4% 8.0%
Total
Count 18 32 50
% within Age Group
in Years 36.0% 64.0% 100.0%
% within Grade 100.0% 100.0% 100.0%
[image:49.595.87.543.110.601.2]Table 3 Etiology wise distribution in relation to grade of pancreatitis:
Etiology Grade Total Significance
Mild Severe
Alcohol
Count 9 21 30 Chi square
0.725 % within Etiology 30.0% 70.0% 100.0% P>0.05Not
significant % within Grade 50.0% 65.6% 60.0%
Gall
Stones
Count 3 3 6
% within Etiology 50.0% 50.0% 100.0% % within Grade 16.7% 9.4% 12.0%
Hyper
TGL
Count 1 1 2
% within Etiology 50.0% 50.0% 100.0% % within Grade 5.6% 3.1% 4.0%
Idiopathic
Count 5 7 12
% within Etiology 41.7% 58.3% 100.0% % within Grade 27.8% 21.9% 24.0%
Total
Count 18 32 50
% within Etiology 36.0% 64.0% 100.0%
% within Grade 100.0% 100.0% 100.0%
Alcohol accounts for 70% of severe pancreatitis group .In contrast in gall
stone disease group 16.7% in mild group and 9.4% in severe group.But the
[image:50.595.88.545.131.560.2]Correlation of Haematological Parameters with Grade of pancreatitis:
Table 4:Haemoglobin variation with grade of Pancreatitis:
Hb Grade Total Significance
Mild Severe
Normal
(<14 in M)
(>13 in F)
Count 4 7 11
% within Hb 36.4% 63.6% 100.0% Chi sq test
% within Grade 22.2% 21.9% 22.0% 0.621
Low
Count 14 25 39
% within Hb 35.9% 64.1% 100.0% P>0.05Not significant
% within Grade 77.8% 78.1% 78.0%
Total
Count 18 32 50
% within Hb 36.0% 64.0% 100.0%
% within
Grade
100.0% 100.0% 100.0%
Out of 50 study subjects, 32(78%) were anaemic in this study.But when these
anaemic patients were compared with grade of pancreatitis,64.1% were in
severe group and 35.9% in mild group the difference was not statistically
[image:51.595.88.547.157.454.2]Table 5:Total Leukocyte count variation with grading of pancreatitis:
TC Grade Total Significance
Mild Severe
4000
- 11000
Count 16 22 38
% within TC 42.1% 57.9% 100.0% Chi square
% within Grade 88.9% 68.8% 76.0% 0.240
<4000
Count 0 2 2
P>0.05
% within TC .0% 100.0% 100.0%
% within Grade .0% 6.3% 4.0%
>11000
Count 2 8 10
% within TC 20.0% 80.0% 100.0%
% within Grade 11.1% 25.0% 20.0%
Total
Count 18 32 50
% within TC 36.0% 64.0% 100.0%
% within Grade 100.0% 100.0% 100.0%
Only 10(20%) of study subjects have leukocytosis in this study. Leukocytosis
was found in 80% of severe type when compared with 20% of mild type.But
the percentage within grade is 25% in severe group and 11.1% in mild group.
[image:52.595.87.539.154.485.2]Table 6 : Polymorphs distribution in relation with grade of Acute pancreatitis: Poly% Grade Total Significance Mild Severe 40-80%
Count 13 22 35 Chi square
% within Poly% 37.1% 62.9% 100.0% 0.747 P>0.05
% within Grade 72.2% 68.8% 70.0%
<40%
Count 0 1 1 Not
significant
% within Poly% .0% 100.0% 100.0%
% within Grade .0% 3.1% 2.0%
>80%
Count 5 9 14
% within Poly% 35.7% 64.3% 100.0%
% within Grade 27.8% 28.1% 28.0%
Total
Count 18 32 50
% within Poly% 36.0% 64.0% 100.0%
% within Grade 100.0% 100.0% 100.0%
Increase in Polymorphs seen more in severe acute pancreatitis(64.3%) than in
mild acute pancreatitis (35.7%).But Polymorphs percentage within grade is
28.1% in severe acute pancreatitis and 27.8% in mild acute pancreatitis .Hence
[image:53.595.90.539.159.540.2]Table 7 Haematocrit variation in relation with grade of acute pancreatitis:
HCT% Grade Total Significance
Mild Severe
40-45%
Count 3 6 9 Chi square
% within HCT% 33.3% 66.7% 100.0%
% within Grade 16.7% 18.8% 18.0% 0.976
<40%
Count 14 24 38 P>0.05
% within HCT% 36.8% 63.2% 100.0%
% within Grade 77.8% 75.0% 76.0% Not significant
>45%
Count 1 2 3
% within HCT% 33.3% 66.7% 100.0%
% within Grade 5.6% 6.3% 6.0%
Total
Count 18 32 50
% within HCT% 36.0% 64.0% 100.0%
% within Grade 100.0% 100.0% 100.0%
Haemoconcentration (HCT>45%) which is a predictor of severe pancreatitis is
seen only in 6%.Majority of the study subjects have decreased haematocrit
values(76%).The difference was not statistically significant when the
[image:54.595.88.540.156.489.2]Table 8: Platelet count variation in relation to grade of pancreatitis:
Plt. Count Grade Total Significance
Mild Severe
Normal
Count 13 17 30 Chi square
% within Pl.Count 43.3% 56.7% 100.0% O.258
% within Grade 72.2% 53.1% 60.0% P>0.05
Low
Count 5 12 17 Not
significant
% within Pl.Count 29.4% 70.6% 100.0%
% within Grade 27.8% 37.5% 34.0%
High
Count 0 3 3
% within Pl.Count .0% 100.0% 100.0%
% within Grade .0% 9.4% 6.0%
Total
Count 18 32 50
% within Pl.Count 36.0% 64.0% 100.0%
% within Grade 100.0% 100.0% 100.0%
Thrombocytopenia is observed in 17 study subjects (34%) in this study. In
these 17 patients, 12(70.6%) were in severe group and 5 (29.4%) in mild
group. But percentage of thrombocytopenia within the grade was 37.5% in
severe group and 27.8% in mild group and hence the differences was not
[image:55.595.88.542.154.511.2]Table 9 : INR variation in relation to grade of acute pancreatitis:
INR
Grade
Total Significance
Mild Severe
<1.2
Count 13 23 36 Chi square
% within INR 36.1% 63.9% 100.0% 0.979
% within Grade 72.2% 71.9% 72.0% P>0.05
>1.2
Count 5 9 14 Not
significant
% within INR 35.7% 64.3% 100.0%
% within Grade 27.8% 28.1% 28.0%
Total
Count 18 32 50
% within INR 36.0% 64.0% 100.0%
% within Grade 100.0% 100.0% 100.0%
14 (28%) study subjects showed Increase in INR values in this study. In this
14 study subjects 9 (64.3%) were in severe group and 5(35.7%) in mild group.
But percentage of increase INR within grade was 28.1% in severe category
and 27.8% in mild category and hence the difference was not statistically
[image:56.595.88.540.156.474.2]Table 10 :APTT variation in relation to grade of acute pancreatitis :
INR Grade Total Significance
Mild Severe
Normal
Count 16 22 38 Chi square
% within APTT 42.1% 57.9% 100.0% 0.109
% within Grade 88.9% 68.8% 76.0% P>0.05
High
Count 2 10 12 Not
significant
% within APTT 16.7% 83.3% 100.0%
% within Grade 11.1% 31.3% 24.0%
Total
Count 18 32 50
% within APTT 36.0% 64.0% 100.0%
% within Grade 100.0% 100.0% 100.0%
12 (24%) of study subjects have high APTT value and the value is more in
severe pancreatitis group (83.3%) than in mild group (16.7%).But the
percentage within the grade was 31.3% in severe group and 11.1% in mild
[image:57.595.89.542.156.481.2]Table 11 : Fibrinogen variation in relation to grade of acute pancreatitis :
Fibrinogen Grade Total Significance
Mild Severe
Normal
Count 9 14 23 Chi Square
% within Fibrinogen 39.1% 60.9% 100.0% 0.313
% within Grade 50.0% 43.8% 46.0% P>0.05
Low
Count 1 7 8 Not
significant
% within Fibrinogen 12.5% 87.5% 100.0%
% within Grade 5.6% 21.9% 16.0%
High
Count 8 11 19
% within Fibrinogen 42.1% 57.9% 100.0%
% within Grade 44.4% 34.4% 38.0%
Total
Count 18 32 50
% within Fibrinogen 36.0% 64.0% 100.0%
% within Grade 100.0% 100.0% 100.0%
Out of 50 patients low fibrinogen observed in 8 (16%) and high fibrinogen
observed in 19(38%) clients. Majority of low fibrinogenemia belongs to severe
category (87.5%). Increase in fibrinogen levels are observed in
11(57.9%)patients in severe category and 8(42.1%)patients in mild category.
The percentage difference between the above variables within grade was not
[image:58.595.89.536.154.516.2]Table 12: FDP variation in relation to grade of acute pancreatitis :
FDP Grade Total Significance
Mild Severe
Normal
Count 18 24 42 Chi square
% within FDP 42.9% 57.1% 100.0% 0.021
% within Grade 100.0% 75.0% 84.0% P<0.05
High
Count 0 8 8 Significance at 5%
% within FDP .0% 100.0% 100.0%
% within Grade .0% 25.0% 16.0%
Total
Count 18 32 50
% within FDP 36.0% 64.0% 100.0%
% within Grade 100.0% 100.0% 100.0%
High level of FDP observed in 8(16%) patients and all 8 cases were observed
in severe category. Hence the difference between 2 grades were statistically
[image:59.595.90.538.154.511.2]Table 13: Cross tabular variation between APTT and fibrinogen :
APTT Fibrinogen Total Significanc
e
Normal Low High
Normal
Count 20 4 14 38 Chi square
% within APTT 52.6% 10.5% 36.8% 100.0% 0.104
% within
Fibrinogen 87.0% 50.0% 73.7% 76.0% P>0.05
High
Count 3 4 5 12 Not
significant
% within APTT 25.0% 33.3% 41.7% 100.0%
% within
Fibrinogen 13.0% 50.0% 26.3% 24.0%
Total
Count 23 8 19 50
% within APTT 46.0% 16.0% 38.0% 100.0%
% within
Fibrinogen 100.0% 100.0% 100.0% 100.0%
This table shows that 4patients(33.3% within APTT) had rise in APTT
value and decrease in fibrinogen.These patients can be considered as full
blown DIC. 4 patients (50% within fibrinogen) have decrease in fibrinogen
values but normal APTT values. These patients were early in development of
DIC.The difference between 2 variables were not statistically significant
[image:60.595.88.545.155.520.2]Table 14: Cross tabular variation between APTT and FDP
APTT
FDP
Total Significance
Normal High
Normal
Count 33 5 38 Chi square
% within APTT 86.8% 13.2% 100.0% 0.329
% within FDP 78.6% 62.5% 76.0% P>0.05
High
Count 9 3 12
Not
significant
% within APTT 75.0% 25.0% 100.0%
% within FDP 21.4% 37.5% 24.0%
Total
Count 42 8 50
% within APTT 84.0% 16.0% 100.0%
% within FDP 100.0% 100.0% 100.0%
This table shows 3 patients(25%within APTT) have both High APTT
value and High FDP values indicative of DIC in these patients. 5 patients
(62.5%within FDP) have High FDP values but normal APTT values,
indicating that these patients were in early severe pancreatitis and feature
suggestive of impending DIC. The difference between these two variables
[image:61.595.89.540.156.496.2]Table 15: Cross tabular variation between FDP and fibrinogen
FDP Fibrinogen Total Significanc
e
Normal Low High
Normal
Count 21 6 15 42 Chi square
% within FDP 50.0% 14.3% 35.7% 100.0% 0.416
% within
Fibrinogen 91.3% 75.0% 78.9% 84.0% P>0.05
High
Count 2 2 4 8 Not
significant
% within FDP 25.0% 25.0% 50.0% 100.0%
% within
Fibrinogen 8.7% 25.0% 21.1% 16.0%
Total
Count 23 8 19 50
% within FDP 46.0% 16.0% 38.0% 100.0%
% within
Fibrinogen 100.0% 100.0% 100.0% 100.0%
This table shows 2 patients(25%within FDP) have low fibrinogen levels
and High FDP levels indicative of full blown DIC. 6 patients (75% within
fibrinogen) have low fibrinogen values but normal FDP values implies these
patients were in impending DIC.The difference between these 2 variables were
DISCUSSION
Haematological and coagulation changes have been reported in acute
pancreatitis as evidenced by Benjamin et al and Inner field et al in 1952,who
did their study on coagulation changes in acute pancreatitis8and J.E . Trapnel
et al in 1966 in journal of annals of Royal college of surgeons,England did
study on Haematological changes in acute pancreatitis1 and he reported drop
in value of haematocrit and haemoglobin values and also reported significant
leukocytosis in his study.
Acute Pancreatitis produces a severe inflammatory response which is
mainly responsible for acinar cell damage which leads to release of
inflammatory mediators like cytokines,TNF and PAF thereby resulting in a
systemic inflammatory response3.
These inflammatory mediators alter the normal hemostatic mechanism
by acting in paracrine or autocrine loops to activate the monocytes,neutrophils
to site of injury and these activated cells inturn expresses the tissue factor in
the injured pancreatic cell and alter the coagulation pathway8.
The Hypothesis states that these coagulation changes may be due to
early consumption of coagulation factors which are secondary to enzymes of
Hence recognition of these haematological and coagulation disturbance
at earliest is essential especially disseminated intravascular coagulation to
improve the outcome in patients with acute pancreatitis.
In this study, patients were graded in to mild and severe pancreatitis
by Balthazar CT grade system/CTSI scoring system. After satisfying the
inclusion and exclusion criteria , Haematological and coagulation changes
were assessed in reference to these 2 grades.
Literature research showed that haematological abnormalities in acute
pancreatitis were recorded in a prospective study by Desmond Murphy and
Clement Imrie.
In another study by Li-Pe cheng ,he studied the influence of coagulation
function on acute pancreatitis on 56 patients of acute pancreatitis with normal
control group and found that the coagulation parameters were significantly
increased indicating bad prognosis though the difference between the 2 groups
were not statistically significant. In our study we found similar coagulation
changes.
In our study, majority ( 88% )were male patients and most of patients
belong to middle age group 28% and 42% for 21-30 and 31-40 age group
respectively. The male predominance is due to the etiological factor which is
are the next common etiological factor next to alcohol, in our study it
constitutes about 12% only.
64% of patients belonged to severe pancreatitis group and 36%
belonged to mild pancreatitis group. The haematological parameters and
coagulation parameters were correlated with the 2 grades of acute pancreatitis
and analyzed.
Haemoconcentration (HCT>45%) is a sign of severe acute
pancreatitis39. However this was found only in 6% of our study group, where
as decrease in haematocrit value were noted in 76%. This is due to the fact
majority of patients in study group were anaemic.The Patients in our study
group had haemoglobin level ranging from 6-12gms%.However the
corresponding haematocrit was appreciably higher in most of the patients in
severe acute pancreatitis indicating haemoconcentration.
Leukocytosis was noted in 20% of study group and they are found more
(80%) in severe acute pancreatitis. Polymorphs were higher in 64.3% in severe
group and 35.7% in mild acute pancreatitis.Although neutrophilic dominance
is noted in 28 out of 32 patients with severe acute pancreatitis.4 had significant
lymphocytosis affecting the P value . This is probably due to subclinical viral
difference between these variables between mild and severe group were not
statistically significant(P>0.05).
Thrombocytopenia was noted in 34% of study group,of which 70.6%
were belong to severe acute pancreatitis.Thrombocytopenia could be due to a)
a part of DIC with associated global prolongation of coagulation parameters or
b) manifestation of thrombotic microangiopathy resulting from diffuse
endothelial injury and platelet activation.
Prothrombin time was found to be increased in 28% of patients and
was seen more in severe acute pancreatitis group(64.3%).Similarly increase
in APTT values were seen in 24%,of which 83.3% were in severe pancreatitis
group.
Fibrinogen levels were lower in 16% of study group, of which 87.5%
was in severe pancreatitis group. These patients were in severe DIC. High
fibrinogen values were seen in 38% ,of which severe pancreatitis accounts to
57.9%.These patients were in early stage of the disease and did not have frank
haemostatic disturbance. This increased fibrinogen value in 38% of patients
can be explained by the fact that fibrinogen is a acute phase reactant like CRP
,and hence can be increased with severe inflammation. Though these
variables between mild and severe group were not statistically
significant(P>0.05).
In contrast FDP levels were found to be higher in 16% of study group
and all of them belong to severe group of pancreatitis. Hence the difference
between these variables between mild and severe group were statistically
significant (P<0.05%).
Cross tabulation done between APTT and fibrinogen values showed that
4patients(33.3% within APTT) had rise in APTT value with decrease in
fibrinogen values .These parameters could indicate DIC in these patients. 4
patients (50% within fibrinogen) have decrease in fibrinogen values but
normal APTT values. These patients can be early in development of DIC and
these patients should receive more attention for better clinical outcome.
Similarly when cross tabulation was done between APTT and FDP,
3 patients(25%within APTT) have increased values of both APTT and FDP
indicating DIC whereas 5 patients(62.5%within FDP) with high FDP value
had normal APTT values.These patients presented in the early stage of severe
acute pancreatitis and were probably with compensated DIC.Timely
increase in FDP values. 6 patients (75% within fibrinogen) have low
fibrinogen values but with normal FDP values. Out of these 6 patients 5 were
in severe category .It has been observed that the fibrinogen levels vary
significantly in the first week of acute severe pancreatitis. Fibrinogen
synthesis and lysis go hands together in acute pancreatitis depending on the
inflammatory response.The natural anticoagulants (protein-C,AT-111) are also
variably upregulated and downregulated by the acute phase reactants,
essentially working against thrombosis. The fibrinogen and FDP values are
therefore significantly influenced by inflammatory cytokines with variable
thrombohaemorrhagic manifestations53.
Though these crosstabulation variables with APTT,fibrinogen and FDP
give clue about DIC and impending DIC developing in these patients, the
difference between these variables between mild and severe group were not
CONCLUSION
The study titled Prospective study on haematological and coagulation
changes in acute pancreatitis was conducted in 50patients in Madras Medical
college and Rajiv Gandhi Government general hospital,Chennai and following
conclusions were made.
1. Haematological and coagulation abnormalities were more common in
severe acute pancreatitis.
2. Though evidence of full blown Disseminated Intravascular Coagulation
is seen in few patients, the cases which were impending Disseminated
Intravascular Coagulation and cases which have high potential to
develop Disseminated Intravascular Coagulation were recognised and
could be managed effectively.
3. The difference between variables comparing haematological and
coagulation indices with severity of pancreatitis were not statistically
significant except for the increase in FDP value which was statistically
significant .
4. Therapeutic regimens like Activated protein C ,Anti thrombin
111,Platelet activating factor modulating agents, Factor V11a inhibitors
BIBLIOGRAPHY:
1. Desmond Murphy MB.ChB.MRCP,Clement W.Imrie Bsc FRCS
Hematological abnormalities in acute Pancreatitis : Prospective study
Postgraduate Medical Journal June 1977(53)
2. GREIPP, P.R., BROWN, J.A. & GRALNICK, H.R. (1972)
Defibrination in acute pancreatitis. Annals of Internal Medicine, 76, 73.
3. HIRAVAMA, A., UEHARA, S., ITAGAKI, Y., IZUMIYAMA,
S. KUDO, M. & SATO, T. (1974) Coagulation study in pancreatitis.
Japanese Journal of Clinical Haematology, 15,171
4. IMRIE, C.W. & WHYTE, A.S. (1975) A prospective study of acute
pancreatitis. British Journal of Surgery, 6, 490
5. KWAAN, H.C., ANDERSON, M.C. & GRAMATICA, L. (1971) A
study of pancreatic enzymes as a factor in the pathogenesis of
disseminated intravascular coagulation during acute pancreatitis.
Surgery, 69, 663
6. MINNA, J.D., ROBBOY, S.J. & COLMAN, R.W. (1974) Disseminated
Intravascular Coagulation in Man, pp. 19-25, 27. Thomas, Springfield,
Illinois.
7. OWEN, C.A. & BOWIE, E.J.W. (1974) Chronic intravascular
8. SHINOWARA, G.Y., STUTMAN, L.J., WALTERS, M.I., RUTH,
Hypercoagulability in acute acutepancreatitis, American Journal of
Surgery, 105,714
9. TRAPNELL, J.E. (1966) The natural history and prognosis of acute
pancreatitis. Annals of the Royal College of Surgeons,38,265
10. YOSHIKAWA, T., TANAKA, K.R. & GUZE, L.B. (1971) Infection
and disseminated intravascular coagulation. Medicine, Baltimore, 50,
237.
11. Spanier BW,Dijkgraaf MG,Bruno Mj.Epidemiology,aetiology and
outcome of acute and chronic pancreatitis:An update.Best Pract Res clin
gastroenterol 2008;22
12. Abdulla, A., Awla, D., Hartman, H., Rahman, M., Jeppsson, B., Regner,
S. et al. (2011). Role of platelets in experimental acute pancreatitis.
Br.J.Surg., 98,93-103.
13. Ais, G., Lopez-Farre, A., Gomez-Garre, D. N., Novo, C., Romeo, J. M.,
Braquet, P. et al. (1992). Role of platelet-activating factor in
hemodynamic derangements in an acute rodent pancreatic model.
Gastroenterology, 102,181-187.
14. Akay, S., Ozutemiz, O., Yenisey, C., Simsek, N. G., Yuce, G., & Batur,
Y. (2008). Use of activated protein C has no avail in the early phase of
15. Alsfasser, G., Warshaw, A. L., Thayer, S. P., Antoniu, B., Laposata, M.,
Lewandrowski, K. B. et al. (2006). Decreased inflammation and
improved survival with recombinant human activated protein C
treatment in experimental acute pancreatitis.Arch.Surg.,141, 670-676.
16. Andersson, E., Axelsson, J., Pedersen, L. C., Elm, T., & Andersson, R.
(2007). Treatment with anti-factor VIIa in acute pancreatitis in rats:
blocking both coagulation and inflammation? Scand.J.Gastroenterol.,
42, 765-770
17. Bernard, G. R., Margolis, B. D., Shanies, H. M., Ely, E. W., Wheeler, A.
P., Levy, H. et al.(2004). Extended evaluation of recombinant human
activated protein C United States Trial (ENHANCE US): a single-arm,
phase 3B, multicenter study of drotrecogin alfa (activated) in severe
sepsis.Chest, 125, 2206-2216.
18. Bernard, G. R., Vincent, J. L., Laterre, P. F., LaRosa, S. P., Dhainaut, J.
F., Lopez-Rodriguez, A. et al. (2001). Efficacy and safety of
recombinant human activated protein C for severe sepsis. New England
Journal of Medicine, 344,699-709.
19. Bhatia M,Wrong FL,Cao Y,et al. Pathophysiology of acute
pancreatitis.Pancreatology 2005;5:132-44
20. Bleeker, W. K., Agterberg, J., Rigter, G., Hack, C. E., & Gool, J. V.
(1992). Protective effect of antithrombin III in acute experimental
21. Bouchard, B. A. & Tracy, P. B. (2003). The participation of leukocytes
in coagulant reactions.J.Thromb.Haemost., 1, 464-469
22. Butenas, S. & Mann, K. G. (2002). Blood coagulation. Biochemistry
(Mosc.), 67,3-12.
23. Butenas, S. & Mann, K. G. (2004). Active tissue factor in blood?
Nat.Med., 10, 1155-1156.
24. Chen, P., Zhang, Y., Qiao, M., & Yuan, Y. (2007). Activated protein C,
an anticoagulant polypeptide, ameliorates severe acute pancreatitis via
regulation of mitogen activated protein kinases. J.Gastroenterol., 42,
887-896.
25. Dabrowski, A., Gabryelewicz, A., & Chyczewski, L. (1995). The effect
of platelet activating factor antagonist (BN 52021) on acute
experimental pancreatitis with reference to multiorgan oxidative stress.
Int.J.Pancreatol., 17,173-180.
26. Dahlback, B. (2000). Blood coagulation. Lancet, 355,1627-1632.
27. DelGiudice, L. A. & White, G. A. (2009). The role of tissue factor and
tissue factor pathway inhibitor in health and disease states.
J.Vet.Emerg.Crit Care (San.Antonio.), 19,23-29
28. Agarwal N,Pitchumoni CS,Sivaprasad AV.Evaluating tests for acute
pancreatitis.An J Gatroenterol 1990;85:356-66
30. Esmon, C. T. (2000b). Regulation of blood coagulation.
Biochim.Biophys.Acta, 1477,349-360.
31. Esmon, C. T. (2005). The interactions between inflammation and
coagulation. Br.J.Haematol., 131,417-430
32. Esmon, C. T. (2009). Basic mechanisms and pathogenesis of venous
thrombosis.Blood Rev23, 225-229.
33. Adams RL and Bird RJ. Review article: Coagulation cascade and
therapeutics update: Relevance to nephrology. Part 1: Overview of
coagulation, thrombophilias and history of anticoagulants. Nephrology
(Carlton) 2009; 5:462-470.
34. Mortele KJ,Weisner W,Intriere L,et al . A modified CT severity index
for evaluating acute pancreatitis;improved correlation with patient
outcome
35. Balthazar EJ, Robinson DL, Megibow AJ, Ranson JH. Acute
pancreatitis: Value of CT in establishing prognosis. Radiology 1990;
2:331-336.
36. Banks PA, Freeman ML, Practice Parameters Committee of the
American College of Gastroenterology. Practice guidelines in acute
pancreatitis. Am.J.Gastroenterol. 2006; 10:2379-2400
37. Beger HG and Rau BM. Severe acute pancreatitis: Clinical course and
38. Bhatia M, Wong FL, Cao Y, Lau HY, Huang J, Puneet P, Chevali L.
Pathophysiology of acute pancreatitis. Pancreatology 2005;
2-3:132-144.
39. Blamey SL, Imrie CW, O'Neill J, Gilmour WH, Carter DC. Prognostic
factors in acute pancreatitis. Gut 1984; 12:1340-1346.
40. Blum T, Maisonneuve P, Lowenfels AB, Lankisch PG. Fatal outcome in
acute pancreatitis: Its occurrence and early prediction. Pancreatology
2001; 3:237-241.
41. Bollen TL, Besselink MG, van Santvoort HC, Gooszen HG, van
Leeuwen MS. Toward an update of the Atlanta classification on acute
pancreatitis: Review of new and abandoned terms. Pancreas 2007;
2:107-113.
42. Bollen TL, van Santvoort HC, Besselink MG, van Leeuwen MS,
Horvath KD, Freeny PC, Gooszen HG, Dutch Acute Pancreatitis Study
Group. The Atlanta classification of acute pancreatitis revisited.
Br.J.Surg. 2008; 1:6-21.
43. Bradley EL,3rd. A clinically based classification system for acute
pancreatitis. Summary of the International symposium on acute
pancreatitis, Atlanta, Ga, September 11 through 13, 1992. Arch.Surg.