AND THEIR RELATION TO MILK PRODUCTS.
by
Edwin E. George Dip. App. Cham.(Tas.)
Being a Thesis submitted as part requirement of the preliminary studies for the Degree of Master of Science at the University of Tasmania
Chemistry Department University of Tasmania November 1974.
Except as stated herein, this theses contains no material which has been presented or accepted for the award of any other degree or diploma in any university, and to the best of my knowledge, this thesis contains no copy or paraphrase of material previously published or written, except where due reference is made in the text.
I wish to express my deep gratitude to Dr. J.B. Polya for the opportunity of being able to work on this project; for his close supervision and guidance throughout the course of this study.
To Mr. Z.A. Mejglo I am thankful for the use of the gas-liquid chromatograph at the Repatriation General Hospital, and for helpful discussions in the field of study, for which I also thank Dr. R.S. Parsons.
I am appreciative of the mass-spectral determinations carried out by Mr. M. Power, and N.M.R. spectra by Mr. R. Thomas.
Photography was carried out on an overhead Polaroid camera model 3000; black and white type 107 land film pack was used.
Mass spectra were obtained on an EAI QUAD 300 quadrupole mass
spectrometer. Infra red spectra were determined on a Beckman Model 33 infra red spectro-photometer in CC1 4 unless indicated. N.M.R. spectral determinations were made on a JEOL JW-4H-100 instrument using T.M.S. as internal standard. Visible or ultra-violet spectra were determined on a Hitachi-Perkin-Elmer Model 124 Double-beam Spectrophotometer.
G.L.C. was carried out on a Shimadzu gas chromatograph Model 4 BMPF with a flame ionization detector. The column packing
consisted of 3% GE SE-30 on 100-120 mesh Gas-Chrom Q (silanized). TLC was carried out on a Kieselgel G nach stahl. Melting
INDEX
Acknowledgments (ii)
Memorandum (iii)
INTRODUCTION 1
Chapter One
ANALYSIS OF MILK LIPIDS BY CHROMATOGRAPHY.
Materials and Technique
4
Rf Values of some Lipids used 6
General Detection Reagents 7
Reagents for the Detection of Sphingolipids
9
Variation of R f Values with Temperature and Time 11TLC on Lipids from Milk Products 14
Solvent Ability of Acetone and Isopropanol 17 Different Conditions on Fresh Cows' Milk 23 Column Chromatographic Separation of Ceramides 25 Fatty Acid Composition of Milk Ceramide and Sphingomyelin 28
Chapter Two
QUANTITATIVE METHODS FOR CERAMIDE ANALYSES
Ceramide by Picrylsulphonic Acid
35
Quantitation of Ceramide from TLC Plates 37 Quantitative Ceramide Analyses of Milk Products 42 Cholesterol Analyses of Milk Products 44
Ceramide by Phosphomolybdic Acid 48
Ceramide by Acid-Dichromate Reduction
53
Ceramide Separation by Partition
55
Chapter Three
SYNTHETIC CENAMIDES AND SPECTRAL ANALYSIS
Syntheses of Ceramides 60
Infrared Spectra of Synthetic and Naturally Occurring 66 Ceramides
Mass Spectra of Synthetic Ceramides 73
CONCLUSIONS 81
REFERENCES 82
Abstract
The analysis of milk lipids, especially ceramide, by thin layer chromatography is described. The variation of ceramide in milk and milk products under different external conditions is noted. The
fatty acid composition of milk ceramide and sphingomyelin is determined by gas-liquid chromatography of the trimethylsily1 derivatives after
separation by TLC followed by hydrolysis. Quantitative methods of analysis of ceramides are developed, and the ceramide in milk and milk products estimated by picrylsulphonic acid. Finally, some synthetic ceramides are prepared and analysed by TLC, infra red spectroscopy and mass spectroscopy, the methods to be used (with GLC) in the future for the complete analysis of the varied components of milk ceramides. Some anomalous TLC spots are observed with structures possibly
The field of sphingolipids is comparatively new, with few papers published on particular aspects of the field. My interest is in food science and I appreciate the opportunity to investigate these compounds in one of the major groups of foodstuffs consumed by man, that is, milk and milk products. No mention is made of sphingolipids in food and health acts, although dietary ceramides could have undesirable effects on one's health. Recent findings by Dr. Polya and Dr. Parsons
. confirmed that (1) ceramide is a powerfully thromboplastic lipid and is a relevant factor in atherosclerosis and (2) there is a transient appear-ance of free ceramide on stress.
Some studies on sphingolipids in one or two milk products have been carried out so far, only with respect to sphingomyelin, present to approximately 0.06% in normal milk (i of the total phospholipids), • and cerebrosides.in which even smaller concentrations have been found.
Neither free ceramide nor gangliosides have been reported in milk or its derivatives to my knowledge. It is the aim of this thesis, and also that of future work, to develop methods of detection and analysis of free cera-mide in these compounds.
Their detection is described in Chapter One by TLC, with some analytical data on their composition obtained by GLC. Chapter Two com-pares some quantitative methods of analysis; very few of these exist at present, and none are useful in the low micro-gram quantities (.4.:-.51.1g). For
quick, routine assays of very small quantities of free Ceramide in milk, blood and tissues, this problem deserves a lot of attention in the utare.
Chapter One
Materials and Technioue
The thin layer chromatography (TLC) 1'2 was carried out on thick glass plates 20cm in width, and varying from
5
to 20cm in length for analytical plates, or 40cm to 1 metre in length for preparative plates. A thin film of Kieselgel G nach Stahl (non-fluorescent with about 13% calcium sulphate binder) was applied evenly to five 20cm plates at a time by means of a commercial spreader. For analytical plates, about 300,u thick, a slurry of 30g silica gel to 57cc distilled water was used, while for preparative plates, about 1mm thick, a thicker slurry was used - 100g silica gel to 175 ml water. The layer thicknesses quoted refer to the aqueous slurry, and the thickness of the dried layer is somewhat less; it depends on the rate at which the spreader is drawn over the plates and is inversely proportional to this rate. It was found, however, that variations in the layer thickness did not normally affect to a great extent the chromatographic separations or Rf values of the sphingolipids, phospholipids, and neutral lipidsused throughout the studies; if analytical plates were overloaded, there was an increase in Rf values and less effective separations.
the plates were stored in a cabinet, the atmosphere of which was equilibrated with slightly hydrated silica gel desiccant.
TLC was carried out in glass chambers (Camag) the walls of which were lined with filter paper and allowed to become thoroughly wetted with the solvent 2 hours before use. Lining the tanks caused a
reduction in edge effects, reduced the time for running a chromatogram by a third, and gave slightly lower but more constant R f values since the atmosphere of the chamber was more uniformly saturated with solvent
vapours. (4) Solvent to a depth of 1 cm was used to develop the plates. The two solvent systems which were used consistently throughout this work, for both analytical and preparative separations, will be designated for future reference as solvent A and solvent B. Their compositions are as follows:-
Solvent A Solvent B
50 chloroform 65 chloroform
50 carbon tetrachloride 25 methanol
10 methanol
4
water0.5 water
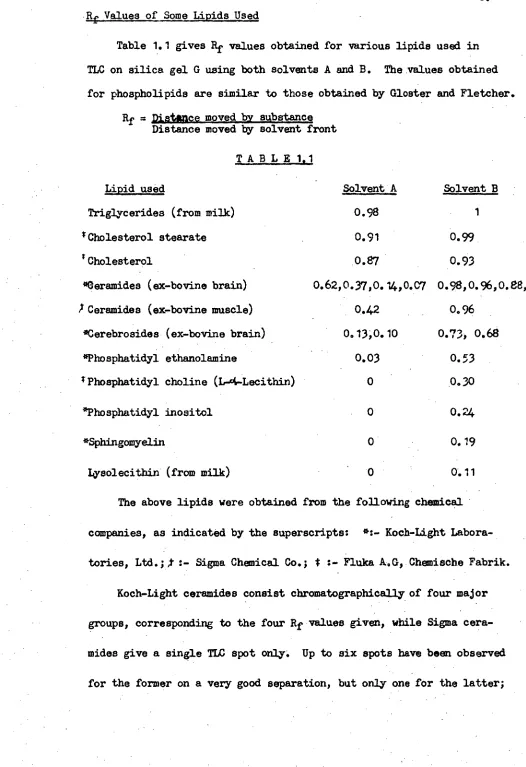
Table 1.1 gives Rf values obtained for various lipids used in TLC on silica gel G using both solvents A and B. The values obtained for phospholipids are similar to those obtained by Gloster and Fletcher.
Rf = Distance moved by substance Distance moved by solvent front
TABLE1.1
Solvent A Solvent B Lipid used
Triglycerides (from milk) 0.98 1
ICholesterol stearate 0.91 0.99
:
Cholesterol .0.87 0.93
*Ceramides (ex-bovine brain) 0.62,0.37,0.14,0..07 0.98,0.96,0.8800.8;
Ceramides (ex-bovine muscle) 0,42 0.96
*Cerebrosides (ex-bovine brain) 0.13,0.10 0.73, 0.68
*Phosphatidyl ethanolamine 0.03 0. 3
tPhosphatidyl choline (14-4-Lecithin) 0 .0.30
*Phosphatidyl inositol 0 0.24
*Sphingomyelin 0. 19
Lysolecithin (from milk) 0 0.11
The above lipids were obtained from the following chemical
companies, as indicated by the superscripts: *:- Koch-Light
Labora-tories, Ltd.O. :- Sigma Chemical Co.; t Fluka A.G Chemische Fabrik.
Koch-Light ceramides consist chromatographically of four major
groups, corresponding to the four Ef values given, while Sigma
cera-mides give a single TLC spot only. Up to six spots have been observed
several solvent systems were tested including solvent B saturated
with carbon tetrachloride, but Sigma ceramides could not be further
resolved by TLC.
General ReaRents for the Detection of Lipids after TLC
(1) Sulphuric Acid, 50% aqueous was sprayed on the plates which were
then heated in an oven at about 450°F for 20 - 30 minutes whereupon
• all lipids (and any other organic compounds) were charred and appeared
as grey or black spots, depending on the nature and concentration of
the lipid. Potassium dichromate incorporated in the sulphuric acid
•to 0.6% by weight is more efficient for the charring of some lipids
such as phospholipids and cerebrosides. Rouser et al(56) have used
this reagent for quantitative analysis of lipids by
charring-trans-mission densitometry.
(2) Ammonium sulphate, 5% on the weight of silica gel, was incorpor-ated into the plate coating. All lipids gave brown to black spots on a white background and longer heating time was necessary than with sulphuric acid.
coated Eastman Chromatogram sheets with plastic backing using the Eastman chromatogram apparatus Model 104 for TLC.
(4) Eosin (Tetrabromofluorescein), applied by spraying 0.01% aqueous onto the plate, was found very satisfactory for the detection of the following natural and synthetic lipids encountered during the course:- neutral lipids: triglycerides, cholesterol esters, cholesterol, fatty acids; phospholipids: cephalins (phosphatidyl ethanolamine, phospha-tidyl serine, phosphaphospha-tidyl inositol), lecithin (phosphaphospha-tidyl choline), lysolecithin sphingolipids: ceramides, sphingosine, dihydrosphingosine, cerebrosides sphingomyelin. The lipids showed up as 'a bright yellow bands when in relatively high concentration on a fluorescent green background under ultraviolet light. As little as 1pg/cm2 of lipid could be detected by this non-destructive reagent.
Reagents for the Detection of Sphingolipids
(1) Chlorine substitution followed by KI starch or benzidine The detection of some brain cerebrosides ( % sulphatides,• sphingomyelins, and ceramides (N-(2-hydroxy-lignoceroyl) sphinganine and N-palmitoyl aphinganine in particular has been carried out on paper and thin layer chromatograms by firstly reacting with sodium hypochlorite (chlorox) in benzene-glacial acetic acid (10:1) or simply with chlorine gas, gollowed by benzidine to give a blue colour. Also tert,butyl hypochlorite has been used as the chlorinating agent, (11,12) followed by EI-starch, for the detection of peptides, nucleotides and other N-H containing compounds on paper chromatograms. Sphingolipids were not tested by this reagent, but the method was tried in this
project and proved successful with ceramides, cerebrosides, sphingomyelins, sphingosine and dihydrosphingosine: very low concentrations of these
sphingolipids could be detected - less than 1)ug/cm 2 . The method of detection was as follows: t-butyl hypochlorite was prepared 13) (45m1, SO% yld), and sprayed as a 2% solution in cyclohexane onto a silica gel thin layer plate containing spots of sphingolipids. The plate was dried in a fume cupboard for 30 minutes under a direct blast of cold air from a hair-dryer, and then sprayed with an aqueous solution of potassium iodide (1%) - soluble starch (1%). The lipids were visualised as blue-black spots on a white background. After 10 minutes however, the back-ground began to become light blue due to atmospheric oxidation.
A variation of the method consisted in chlorination of the amide by exposing the TLC plate to dry chlorine gas in a closed container
for an hour, and then spraying with potassium iodide-starch solution. (1o) This method was found less sensitive (O5iug), and gave rise to some
(2)Malachite green:
The detection of a great variety of lipid materials has previously been reported( 14 ) by the use of the cationic stain, malachite green. The dye was also found to identify ceramides and cerebrosides, and all other milk lipids by comparison with charring on TLC plates. The lipids were spotted on silica gel G plates and chromatographed in
solvent A. The chromatograms were then uniformly sprayed with an 0.5% aqueous solution of malachite green to produce a deeply blue-coloured surface. The plates were air-dried 30 minutes and sprayed lightly with 2% sodium metabisulphite in 2N HC1 to reduce all unbound stain to an orange colour, leaving the lipids as blue spots. This method would be unsuited to quantitation however with the reducing reagent used, as the plates immediately began to partially reoxidize. For qualitative pur-poses the method was found to be suitable for sphingolipids and choles -
trol to greater than 5pg/cm2 . (3) Metal complexing:
The effect of metal ions on some sphingosine bases has previously been tested (15) with no evidence of complex formation but the ability of ceramides to form complexes on TLC plates with some transition metal ions remained to be studied. Ceramide was spotted on the plate, followed by some aqueous solution of a metal salt, and chromatographed in solvent A. The acetates and chlorides of Feb, Co 2+ , Ni2+ , Cu2+ and Hg2+ were
tried, with no success. Detection reagents used were potassium ferro-cyanide (Fe, Cu); dimethylglyoxime (Ni); 8-hydroxyquinoline (Co); H2S (Hg). The metal salts remained at the origin, and subsequent treatment with 12 vapour showed that the ceramide was not retarded at
all by the metals.
(4) Phosphomolvbdic acid:
lipids, followed by staining for choline with ninydrin (16) , as well' as quantitative analysis of phospholipids, cholesterol, cholesterol
esters, free fatty acids and triglycerides in human serum lipids(17). Ceramides, cerebrosides, and sphingomyelin were subjected to TLC in three different concentrations (0.5, 2, bug), and the plates sprayed with a 10% methanolic solution of phosphomolybdic acid. Upon heating 1-2 minutes at 110oC, blue spots of reduced molybdate on a light yellow background were observed, formed due to the unsatura-tion of the sphingolipids. A concentraunsatura-tion of 0.2pg/cm 2 of lipid was just detectable by this reagent, and it was used to provide a means of quantitation by spectrodensitometry (see Ch.2.).
Effect of Temperature and Time of Activation on R f Values of Ceramides, Cerebrosides, and Cholesterol
For studies of time variation at constant temperature, an oven (accurate to ± 2° C) was kept at a predetermined temperature. TLC analytical plates (20cm x 10cm) were prepared, and air-dried for 30 minutes before heating. The plates were removed from the oven as quickly as possible as time progressed and cooled in a cabinet contain-ing desSiCant for 30 minutes. They were then spotted with the lipid solutions immediately, placed in TLC tanks containing, solvent A, and the solvent allowed to rise to a predetermined solvent front. Results for temperatures of activation between 80 ° C and 130°C are illustrated
by figs. 1 and 2.
The greatest changes in Rf values are observed within the first hour, particularly the first half-hour. The optimum conditions for Koch Light ceramides, as well as other lipids used, seems to be
15-20 minutes at 110 ° C. For the most reproducible conditions, however, a drying time of 30 minutes at
95 -
100°C or 100 - 105°C Could be••••• :•••• •••• ••••■ •••••
— — —at
ME. •■• •••••■ ■•••• =MO w■ ••■•• ••••• =M.
75
TIME (min) 100
125
150
CERAMIDES (ex-bovine brain)
o 95°C- 100°C
0 110°C-115
°
C
A 120°C-125°C
.75
N. ‘..." •••■•
1.0
.5 0
.25
' 45L o••••
—
a-- — /
. /
-A •-a , \
6
--
,...7‹.•••-•-"0,...,"zzs, A...,
,i) xv>0.4.-;.=•'fl- - 4._ ■ ....s.,,
)' 7 —,0"
...---0`"•••• •• --
\ Ia.
W 7
s'NN
• te
le,
1 I
0
.75
.50
•25
0
0
25
50
75.
100
125
150
TLC of Lipids From Milk Products
The following types of milk products were examined for lipids, ceramides in particular, by TLC (figures in parentheses indicate percentage butterfat ( 18: "Bakers" pasteurised full-cream milk (3.6),
9Meadowlea" butter (83), "Carnation" full-cream evaporated milk (8.3) ) "Nestles" full-cream powdered milk (27), cream (30) 0 skim milk (0.2), human milk (4.0 - 3 days after birth). As shown by the photographs of the TLC plates displaying the milk products (plate6 1-4), the quantity of ceramide relative to the butterfat content can be approx-imately assessed.
The lipids were extracted from the milk samples by the method of Gloster and Fletcher (3) as follows: 2 mls of the milk product were shaken with 40m1 of. chloroform-methanol (2:1) in a glass-stoppered flask, and stood at room temperature for 30 minutes with frequent shaking. The mixture was then shaken with 8 ml of 0.1M sodium chlo-ride solution and the lower chloroform phase filtered using phase
filter-paper (Whatman 1-PS). The chloroform-methanol phase was evapora-ted to dryness under a stream of nitrogen or by a rotavapor and the liquids redissolved in 2 ml of chloroform; 10 pl of this so/ution. were used for spotting.
Plates 1 and 2 illustrate the lipids present in normal pasteurised milk, evaporated milk and full-cream powdered milk, using solvents A and B respectively. Free ceramides are observed to be present on plate
Sphingomyelins (Rf 0.2), lecithins (Br 0.3) and cephalins (Rf 0.5). Cerebrosides are also known to be present in milk and milk products, though very faint here (Rf 0.7) Morrison19/ 20) has analysed by gas-liquid chromatography and mass spectrometry the long-chain bases and fatty acids of sphingomyelin, glucosylceramide and lactosylceramide in spray-dried buttermilk powder.
Plate 3 shows the variation of ceramide in skim milk and cream, samples of which were obtained by centrifuging whole milk (pasteurized) in the laboratory. The cream was removed from the top fraction, and the lower fraction used for the skim milk. 1% of the extracted milk lipids from 2 ml of the milk samples were used for TLC analysis.
The majority of the ceramide is observed to be present in the skim milk, judging from the intensity of the charred lipid around Rf 0.4 for each sample. Some of the less mobile ceramide is observed also to be present in skim milk, whereas none can be seen in the cream extract for that concentration. This may be expected, since ceramides contain two or more hydroxy groups, and an amide linkage; hydrogen bonding and electrostatic attraction would tend to keep the ceramide in the aqueous phase associated with the milk proteins.
The Rf value for the major band of milk ceramides, the same for all milk products, is observed at Rf 0.45, corresponding to a little higher than the position of Koch-Light ceramides band 2. The latter are rich in hydroxy fatty acids (21) and thus the reason for their retention on TLC' plates. However, milk ceramides have only a small proportion of hydroxy fatty-acids, and a large proportion of unsaturated fatty acids, as shown later by GLC analysis.
Plate 4 compares the lipids in fresh cows' milk with an equal
(1) Brain ceramides; (2) Brain cerebrosides; (3) Whole milk (pasteurised) lipids; (4) Evaporated milk lipids; (5) Full-cream powdered milk lipids; (6) sphingomyelin, phosphatidyl choline, phosphatidyl ethanolamine, cerebrosides; (7) cholesterol
Plate 1. - sol. A Plate 2. - sol. B
3
Comparison of Solvent Power of Acetone, Isopropanol for Milk Ceramides and Cholesterol
Human milk was washed twice with acetone or isopropanol and their solvent powers compared by TLC of the extracts of the residues and washings; results are shown on plates 5 and 6.
Ceramide is observed to be present in relatively large concentration corresponding to the second Koch Light ceramide spot at about Rf 0.5. The chromatograph shows that practically all the ceramide is extracted by both solvents as well as all the cholesterol, other sterols and triglycerides. The solvent power of isopropanol is noted to be greater than that of acetone for cerebrosides (Rf 0.08); practically all
cerebrosides are extracted by one wash with isopropanol.
Experiments were carried out to observe the effect of extracting whole cows milk with increasing proportions of acetone and isopropanol. The preparations were, for milk:solvent, 1:1, 1:2, 1:4, 1:8, 1:16. The coagulated protein and remaining lipids were centrifuged, the top layers drawn off, and the solvent evaporated to dryness under a stream of nitro-gen. The lipids were then extracted from both the residues and extracts by the Gloster-Fletcher method, the solvent evaporated to dryness under nitrogen and lipids taken up in 1 ml CHC1 3 ; 10 )11 were used for spotting on TLC plates. Results are shown on plates 7 and 8.
It is observed that isopropanol has the greater solvent power for both triglycerides and cholesterol; practically all the cholesterol is removed by the system 1 milk:8 solvent or more. The ceramide concentration seems to be only slightly affected on increasing the 'solvent proportion. Approximately equal amounts appear in both the
residues and extracts.
the following method. The total lipid was applied as a chloroform solution to 20 cm x 20 cm preparative plates and chromatographed in solvent A. The sides of the plates were sprayed with tt aqueous eosin, viewed under the UV light, and the ceramide (Rf 0.4) and
cholesterol (Rf0.8) bands marked. These were scraped off the plates, extracted twice with chloroform-methanol (2:1), the solvent evaporated under a stream of nitrogen and the ceramide and cholesterol estimated quantitatively. The methods used, described in section II, have been developed previously. (22,23)
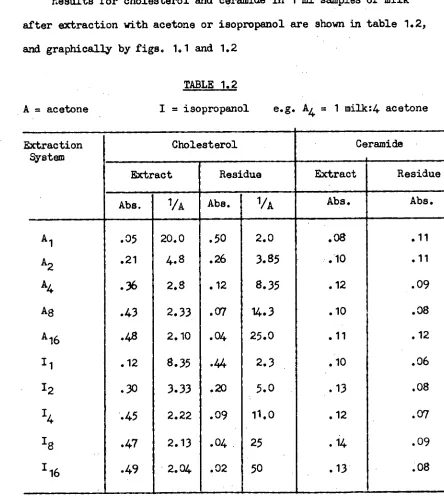
Results for cholesterol and ceramide in 1 ml samples of milk after extraction with acetone or isopropanol are shown in table 1.2, and graphically by figs. 101 and 1.2
TABLE 1.2
A = acetone
[image:25.563.65.509.301.801.2]Extraction System
I = isopropanol
Cholesterol
e.g. AL = 1 milk:4 acetone
Ce ramide
Extract Residue Extract Residue
Abs. 1,/A Abs. 1/A
2.0 3.85 8.35 14..3 25.0 2.3
5.0
Abs. Abs.
A 1 A 2
A4
Ag A16 Ii 121
4
1
8
116.05
.21.36
.43
.48
.12 .30.45
.47
.49
20.0 4.8 2.82.33
2.108.35
3.33
2.222.13
2.04 . 50.26
.12 .07.04
.44
.20.09
.04
.02 11.0 25 50 .o8
.10
.12 .10. 11
A plots of milk : solvent ratio vs absorbance (fig. 1.1) shows that isopropanol has the greatest solvent power for cholesterol, and slightly greater only for ceramide. As shown up by plates 7 and 8 also, it is noted that practically all the cholesterol is extracted for the milk : solvent ratio 1:8, and ceramide is equally distributed between residue and extract.
For the cholesterol remaining in the residues, the milk : solvent ratio is inversely proportional to the cholesterol concentration
(fig. 1.2).
Finally, the solubility of ceramide, cholesterol and synthetic cephalin * were determined as follows. Solvent was added in 0.1 ml
aliquots to an appropriate amount of lipid, warmed to completely dissolve, then stood in an ice bath whereby a turbid solution was obtained (or
crystalline particles for cholesterol). The temperature was gradually raised until the compound just dissolved, at which point the temperature was noted. The following solubilities were obtained
Compound Solubility. acetone Solubility, isopropanol Cholesterol 28 mg/ml @ 300C 100 mg/ml CO 280C
• 20 " 20°C 80 * 23°C
ceramide 0.8 * 30°C 14 " 22-28° C • 0.6 " 24°C .
cephalins practically insoluble <0.2 mg/ml
Isopropanol thus has far greater solvent power for ceramide (20 x) and dissolves 4 times as much cholesterol.
(1) Brain ceramides; (2) Human milk lipids (1% from 1 ml); (3) Lipids, washed once ) 4 ml acetone (p.5)
(4) Lipids, washed twice ) with 4 ma isopropanol (p.6) (5) 1st washing; (6) 2nd washing; (7) Cholesterol.
Extracts Residues
8
001Pkci
1. CHOLESTEROL CURVES FOR EXTRACTS
RESIDUES LEFT AFTER EXTRACTION
-
.1
t
Abs
0ACETONE RESIDUE
6
. I
1-
I
6
1.8 1•2
1.4
0
0
FIG.
1
.1
ISOPROPANOL D(TRACTo
(2) CHOLESTEROL CURVES FOR EXTRACTS
RESIDUES LEFT AFTER EXTRACTION
The Effect of Different Conditions on Fresh Cows' Milk
Fresh, untreated cows' milk was subjected to varying degrees of temperature from refrigeration (4°C) to incubation (38°C). The lipids were then extracted from 2 ml aliquots at intervals by the Gloster-Fletcher (3) method, the solution evaporated to dryness and residual lipids taken up in 2 ml chloroform. These solutions were spotted on TLC plates, the results of which are shown on plates 13 and X.
No noticeable change compared to fresh milk is observed on
refrigeration, freezing
3
days, or standing at room temperature before souring. Incubation (38°C), however, caused the milk to sour quickly, and a spot just above the major ceramide band of milk was observed in each case (pronounced in column5,
plate 13). A faint spot was also produced by prolonged boiling of milk. The spot was shown to originate from milk sphingomyelin by the following experiment.Sphingomyelin (2 mg) was dispersed into 2 ml of fresh pasteurised milk, and incubated. The lipids were extracted from 0.5 ml portions of the milk after 1 hour,
7
hours,3
days, and equal amounts subjected to TLC. Milk was also treated with cerebrosides simultaneously, and results areshown chromatographically on plates 15, 16 and 17.
The breakdown of sphingomyelin to ceramide phosphoryl-choline) is clearly seen to increase as the milk ages under incubation (38°C), by the increasing intensity of the newly formed ceramide band around Rf 0.45; this indicates the presence of the enzyme sphingomyelinase
PLATE 13
(1) Brain ceramide; (2) cerebrosides; (3) Skim milk, machine
separated and tested immediately; (4) Cream from (3); (5) Incubated milk, 48 hours @ 38°C (sour); (6) Boiled 5 min.; (7) Boiled 1 hour; (8) glucose added, incubated 1 hour; (9) galactose added, incubated 1 hour; (10) frozen 3 days; (11) Whole milk, tested immediately;
(1?) Cholesterol.
PLATE 14
(1) Ceramides; (2) Whole milk, tested immediately; (3) Incubated 9 hours; (4) Incubated 48 hours; (5) Incubated 80 hours (whey taken without mixing); (6), (7) and. (8) Left at room temperature (18°C) for 9 hours, 48 hours and 80 hours, respectively; (9), (10) and (11)
13
14
15
16
Columns are marked as follows: (CE) Ceramide; (CB) Cerebroside; (1),(2) Pasteurised milk incubated (38°C) 1 hour, 7 hour respectively; (3),(4) As for (1),(2), with sphingomyelin added (1 mg./m1.);
(5),(6) As for (1),(2), with cerebrosides added (1 mg./mi.); (SPH) Sphingomyelin; (CHO) Cholesterol.
Separation of Milk Ceramides by Silica Gel G Column ChromatograDbV
The use of column chromatography on silica gel G has been carried
out on human serum. Complete separation of various lipid classes and
lipoprotein fractions have been obtained (4 0) using silica gel G, the
more conventional column packings such as silicic acid or Florisil
were less effective.
A column of silica gel G 16 cm in height by Zi cm in width was
prepared by allowing a 2:1 slurry in chloroform to settle in the column
on top of a cottonwool plug. Total lipids were extracted from 1 1 of fresh cow's milk (4.5% butterfat) by the following method.
Acetone (2/3 1) was added to the milk, the precipitated protein
with some complexed lipid filtered off and allowed to dry under nitrogen
in a large desiccator. The filtrate (ca. 11i 1) was flash distilled at
60°C under a vacuum by means of a rotary evaporator. The residue from
the filtrate plus the protein was now extracted for total lipids with
1 1 of chloroform-methanol (2:1) in a blender. The protein and
carbo-hydrate were filtered off, washed once with 200 ml of same solvent, and
the total combined filtrate evaporated to dryness on a rotavapor.
Practically all the solvent was recovered. The extracted lipid was
dissolved in 100 ml of chloroform, and added to the top of the silica
gel column. Neutral lipids were eluted with 50 ml portions of
chloro-form, 250 ml being required to remove all glycerides, steroids and pigments. TLC on 20 cm and microslide plates as the chromatography
progressed was used to indicate when all neutral lipids had passed
through. The ceramides and some of the phospholipids were then eluted
with 200 ml of CHC1 3 :CH3OH(2:1), the remaining phospholipids being
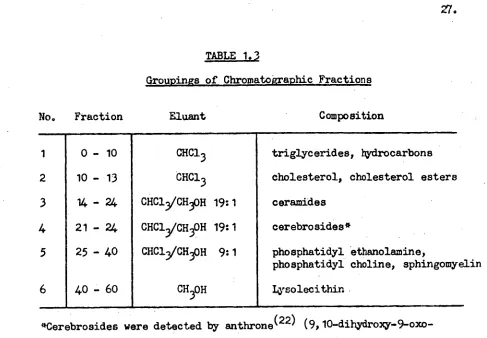
eluted with methanol. The main fraction containing the ceramides was
the top down the column at a constant rate with the eluting solvent. The combined ceramide-rich fractions were filtered to remove small silica gel particles, and evaporated completely to dryness under nitro-gen in a tared flask on the rotavapor. A yellow residue of 200 mg was obtained. This residue was dissolved in a
5
ml chloroform, applied to a preparative TLC plate 1 metre long and chromatographed in solvent A.Spraying the edges of the plate with 0.1% aqueous eosin and viewing under the U.V. light revealed the presence of two ceramide bends close together at Rf 0.40 and 0.45; a very minor band was also observed between the two main bands, but was too small to be recoverable. The two main ceramide bands were individually scraped off the plate (excluding the
eosin-sprayed sections), extracted with warm chloroform-methanol (2:1), and rechromatographed on two 40 cm preparative TLC plates in solvent A. The purified ceramides were recovered to yield 1.5 mg of cersmide A (Rf 0.46), and 17.0 mg of ceramide B (Rf 0.40 - the major ceramide band observed for milk products). The yield of ceramide B obtained was 65% of the theoretical yield (26 mg/1 of milk by analysis).
Sphingomyelin was also recovered from the column fractions rich in this lipid, by preparative TLC twice in solvent B. One band only was obtained, at Rf 0.20 corresponding exactly to the Rf value of ex- bovine brain sphingomyelin. The sphingomyelin fraction, and both ceramide fractions, all shown to be homogeneous by analytical TLC, were stored in chloroform under nitrogen for further analysis by gas-liquid chroma-tography.
0 - 10 10 - 13 14 - 24 21 - 24 25 - 40
40 - 60
CHC1 3 CHC1
3 CHC13/CH3OH 19:1
CHC13/C11 30H 19:1 CHC13/CH3OH 9:1
CH
3OH
triglycerides, hydrocarbons cholesterol, cholesterol esters ceramides
cerebrosides*
phosphatidyl ethanolamine,
phosphatidyl choline, sphingomyelin Lysolecithin
1 2
3
4
5
[image:35.563.51.538.35.373.2]6
TABLE 1.3
Groupings of Chromatographic Fractions
No. Fraction Eluant Composition
*Cerebrosides were detected by anthrone (22) (9,10
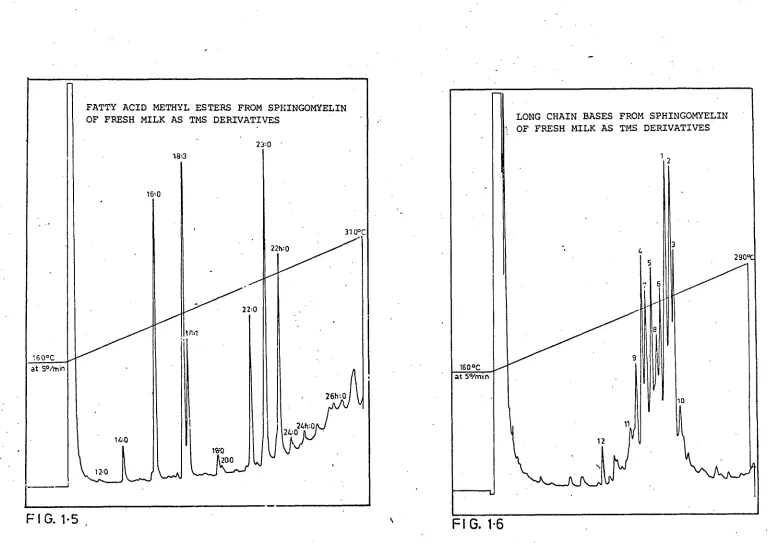
The Fatty Acid Composition of Milk Ceramide and Sphingomyelin
Beef-brain sphingolipids have been analysed for their fatty acid composition by gas-liquid chromatography (GLC) of their methyl and acetoxymethyl esters (41) . The non-hydroxy fatty acid composition was found to be similar in sphingomyelin, ceramide cerebroside, and cerebroside sulphate, with lignoceric, nervonic, and stearic acids predominating. Hydroxy fatty acids were found mainly in cerebrosides and ceramides, with 2-hydroxylignoceric, 2-hydroxynervonic and
2-hydroxystearic acids predominating. Similar fatty acid compositions of beef brain sphingolipids (supplied by Koch-Light Laboratories Ltd), have been obtained by Mejglo (21) , by analysis of the trimethylsilyl
(INS) derivatives of the acids; 2-hydroxybehenic and 2-hydroxyarachidic acids were also found to be present to a relatively high extent in sphingomyelin and cerebrosides, and to a lesser extent in ceramides.
The pure ceramide and sphingomyelin fractions obtained in the previous section were prepared for GLC analysis by the following procedure. The lipid was hydrolysed by the method of Kates (42) , by refluxing about 1-2 mg in
4
ml of methanolic hydrogen chloride (2.5%, ca.0.7N, made by passing dry HC1 gas into reagent grade methanol) on a hot water bath for4
hours; 1 ml of water was,added, and the fatty acid methyl esters extracted with petroleum ether (40-609) quantitatively. The combined extracts were absolutely dried by anhydrous magnesiumsulphate, and evaporated to dryness under nitrogen. The hydroxy fatty acids present in the residue were converted to the trimethylsily1
ethers by the addition of 100p1 of bis-trimethylsilyltrifluoroacetamide (BSTFA) followed by 50p1 of trimethylchlorosilane (TMCS), and the
reaction mixture left to stand overnight in a tube with teflon-lined screw cap. About 20du1 were used directly for GLC analysis.
IV evaporation at 40° C in a stream of nitrogen to a small volume, made alkaline with 0.5 ml of 7N sodium hydroxide, and the bases extracted with ethyl ether or chloroform. The combined extracts were dried
(anhydrous magnesium sulphate), evaporated to dryness under nitrogen, and converted to the TKS derivatives as above in preparation for GLC analysis.
Gas-liquid chromatographic separations were carried out on a Shimadzu GC-4BMPF equipped with a flame ionization detector. The
columns were 2m. by
3
mm. coiled glass tubes; the column packings were3%
GE SE 30 on 100-120 mesh silanized Gas Chrom Q (Applied Science Laboratories). The injection heater was at 280 0 and detector tempera-ture also 280 ° C. Temperatempera-ture programming was from 160°C to 350° C at 50/ minute, and chart speed5 mm /
minute.Table 1.4 gives the relative percentage fatty acid compositions of the ceramides and sphingomyelins isolated from milk previously. Retention times for the standard fatty acid methyl esters and BSTFA derivatives had been previously obtained(21) and quantitative analysis of each fatty acid was done by measuring the peak area relative to the total area under all the peaks (peak area = height of peak x width at half peak height.)
A comparison of the data given in column 2 and
3
gives conclusive evidence that ceramide A, the minor component observed by TLC when milk is incubated, boiled or allowed to go sour, is derived from milkTABLE 104
Relative % of fatty acids isolated from milk ceramide and sphingomyelin
Fatty Acid Ceramida B Ceramide A Sphingagyelin Ceramide C
12:0, lauria 2.0 0.3 0.2 0.7
- 14:0, myristic 10.3 2.3 . 1.7 3.0
15:0, pentadecanoic 1.4 0.3 0.4 0.3
16:0, palmitic 40.0 - 17.7 •19.0 10.0
17:0, heptadecanoic 0.7 0.2 0.5 0.2
18:1, oleic 17.7 8,7 .114 . 10.1
18:2, linoleic 22.8 19.7 14.1 70.0
18 h:0 2-ydroAystearic 0.2 1.4 ' 0.6 • 0.3
19:0, nonadecanoic '0.2 0.2 . 9.5 0.6
20:0, arachidic: 0.1 . 0.2 ' 0.3 . -
20:1, 9-eicosanoic 0.1 0.2 0.4 0.3
-20 h:0, 2-bydrovarachidic 0.1 0.3 0.4 .0.4
21:0, heneicosanoic 0.1 0.2 0.1 0.5
22:0, behenic, 0.6 9.5 , 12.0 03
22h:0, 2-nydroAybehenic 0.1 11.7 10.8. 0.4
22:6, doeosehexanoic - 0.3 0.4 '
23:0, tricosanoic 0.1 18.0 ' 19.1. .0.1- 23h:0, 2-hydrovtricosanoic - 1.0 1.2
24:0, lignoceric 0.1 0.4 0.6 0,1
24h:0, 2-hydroxylignoceric 0.3 0.7 0.4 0.3
24:1 nertonic 0.1 - ' 0.3 -
25t0, pentacosanoic 0.2 ' 0.1 0.1 0.2
26:0, cerotic 0.2 '0.1 0,1 0.1
The predominant fatty acids found in milk sphingomyelin were palmitic, linoeic, oleic, behenic, 2-hydroxybehenic and tricosanoic acids. However, the unsaturated acids, linoleic and oleic were found to be present to only a minor extent in sphingomyelin isolated from spray-dried buttermilk powder (Morrison,
noceric acid and the 2-hydroxy derivatives of lignoceric, tricosanoic and palmitic acid were present to a large extent as shown by mass spectra on their trimetbysily1 ethers after GLC.
The fatty acid composition of milk ceramides (from fresh milk-ceramide B and full-cream powdered milk - milk-ceramide C) is given in columns 1 and 4, and represented by Fig. 1.3, and 1.4 respectively. It can be seen that a small amount only of hydro xy acids exist in milk.ceramides, which are present to quite a large extent in brain and serum ceramides, and which play an important role in relation to
//ql
atherosclerosisiv'l. The types of ceramides that are considerably increased in atherosclerotic tissue, dead tissue, and in the event of stress (43,44) , are those which are rich in hydroxy fatty acids. The most biologically significant fatty acids have been found to be 2-hydroxlignoceric and 2-hydroxybeher4c acids, which are absent from milk ceramide. Milk ceramides also have very little fatty acid of chain length greater than 18 carbons. Linoleic, oleic, palmitic and myristic acids are the major fatty acids present; the highly unsaturated nature of the ceramides (also attributable to unsaturated sphingosine bases, evidenced by the trans double bond in their infra-red spectra at 970 cm-1 - Fig. 3.4) would retard their mobility on TLC plates.
(19,20). ;
181
FATTY ACID METHYL ESTERS FROM CERAVIDE OF FULL—CREAM POWDERED MILK AS TMS
DERIVATIVES 18%2 180 1410 14h13 15:0 17,C 160°C /min 50 at 310°C 100 19:0 c0:2 201 120 21, 0 20h%0 22h:0 210 I
1\1
1
li .. L. I. 24 24 tr.o 26h,0 is 26,0■
Lt
24h10 2210 ITO18, 2 . PATTY ACID METHYL . ESTERS FROM CERAMIDE
OF FRESH MILK AS TRIMETHYLSILYL DERIVATIVES
FIG.1.3
1
1610FIG. 1.5
,FIG. 1.6
120
20:0
120
23:0
18%3
22h:0
220
181
160°C at 50/min
26h10
20:0 24:0
140
2
3
290%
7
160°C at 50/rnIn
10
Chapter Two
Spectrophotometric Determination of Molar Quantities of Ceramide by Hydrolysis and Reaction with Picrylsulphonic acid
R--CHOH R-CHOH 0 0
1 (1) hydrolysis (methanolic HC1) I ' 0
CH--NHCOR1 CHNH--S
I (2) picrylsulphonic acid I II
CH2OH + NaHCO3 (warm) CH2OH 0 0
0 2
ceramide
The quantitation of glycosphingolipids has been carried out
.quite extensively by the reaction or complexing of some compound
with the long chain base moeity; some methods make use of the fluo-rescence of a complex formed between the amine and a reagent such as
1-naphthylamino-4-sulphonic acid fluorescamine (25) , while others are spectrophotometric such as the colorimetric estimation of the com-plex formed between the basic -NH2 group of sphingosine and the anionic
dye methyl orange(26) . The following method describes the spectro-photometric estimation of the coloured reaction product formed between the long-chain bases of ceramide and trinitrobenzene sdlphonic acid or TNBS (obtained from Sigma Chemical Co.). It has been suggested for ceramides and applied to glycosphingolipids in particular(27) •
Hydrolysis of ceramide to long chain base fatty acid methyl esters was carried out by the method of Sweeley and Moscatelli (28) , that is by refluxing the lipid (5-200 pe in 1.5 ml of 2N methanolic hydrochloric acid ( 1 ml conc. HC1:
5
ml reagent grade methanol)in 10 ml glass tubes for5
hours at 100° C (boiling water bath). By this method over 95% hydrolysis of ceramides could be achieved (29) ; it was found to be the most practical of several methods tried. Heating at 120 °C for 90 minutes in 1.5 ml of 2N methanolic hydrochloric acid in a screw-cappedtemperature (60°C) overnight gave much lower results at times,
indicating incomplete hydrolysis. After cooling, 1.5 ml of water was added, and the long-chain bases extracted twice with 2 ml portions of chloroform, and the chloroform evaporated to dryness under a stream of nitrogen. 1 ml of sodium bicarbonate solution (4% aqueous) was then added to each tube, shaken vigorously to dislodge and suspend as much of the lipid as possible, and 1 ml of TNBS (1% aq.) added. The tubes were capped, and incubated one hour in the dark at 4000, with occasional shaking. Methanolic HC1 was then added (1N, 1 ml), and the solutions extracted twice with 2 ml portions of n-hexane, with vigorous shaking (200 times) to ensure good extraction.
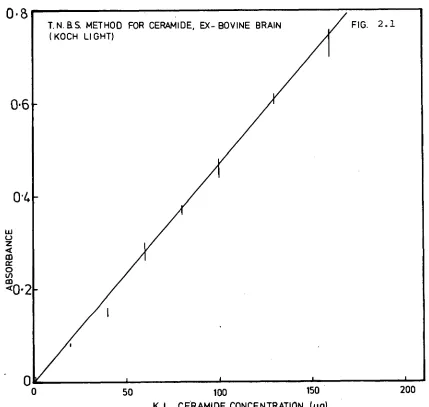
[image:44.562.46.523.397.820.2]The optical density of the yellow coloured sulphonates in 4 ml hexane was measured at 340 mp against a reagent blank.
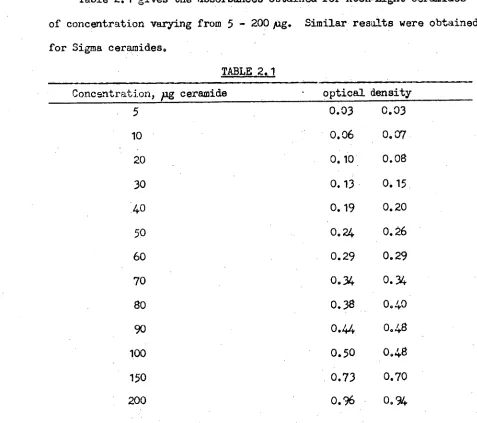
Table 2.1 gives the absorbances obtained for Koch-Light ceramides of concentration varying from 5 - 200 pg.
for Sigma ceramides.
TABLE 2.1
Similar results were obtained
Concentration, pg ceramide optical density
5 0.03 0.03
10 0.06 0.07
20 0.10 0.08
30 0.13 0.15
40 0.19 0.20
50 0.24 0.26
60 0.29 0.29
70 0.34 0.34
80 0.38 0.40
90 0.44 0.48
100 0.50 0.48
150 0.73 0.70
Figure 2.1 shows that Beer's Law is followed i.e0 that the optical density is directly proportional to the concentration of the coloured compound in solution. The method was found to be accurate to a
concentration of ceramide greater than
5
pg.Extraction and Quantitation of Bovine Brain Ceramide from TLC Plates
Ceramide is a lipid of some polarity, by virtue of the presence of the two hydroxy groups and amido group of the sphingosine bases. Its chromatographic behaviour on well-activated TLC plates shows this by the strong retarding of its motion; chemically bound water has been removed and possibly the 0-8 groups of the ceramide replace the sites where the H-O-H molecules were in the silica-gel matrix. The same
effect is observed with cholesterol, and cerebrosides which have hydroxy groups also.
The following absorbance values show that 92% ceramide is extract-able from TLC plates by cold or warm chloroform-methanol (2:1), but only about 20% is extractable by the non-polar solvent, chloroform. The ceramide (100 pig) is applied to the plate as a chloroform solution, the area containing the ceramide scraped off (approx. g silica gel), extracted three times with 5-10 ml solvent, the combined filtered
extracts evaporated to dryness under nitrogen and the extracted ceramide determined by picryl sulphonic acid.
EXtracting solvent Absorbance
cold CHC1 0.04, 0.05
warm CHC13 0.05, 0.04
cold C
HC13-CH3OH (2:1) 0.34, .0.42 warm CHC1
3 -CH3 OH (2:1) 0.37, 0.38
not extracted 0.40, 0.38
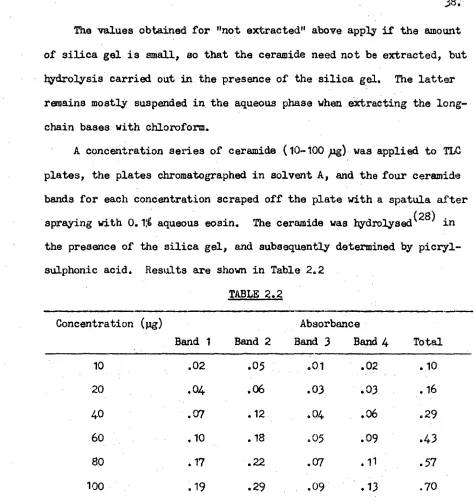
The values obtained for "not extracted" above apply if the amount of silica gel is small, so that the ceramide need not be extracted, but hydrolysis carried out in the presence of the silica gel. The latter remains mostly suspended in the aqueous phase when extracting the long-chain bases with chloroform.
A concentration series of ceramide (10-100 pg) . was applied to TLC plates, the plates chromatographed in solvent A 0 and the four ceramide
[image:46.562.40.514.36.538.2]bands for each concentration scraped off the plate with a spatula after spraying with 0.1% aqueous eosin. The ceramide was hydrolysed (28) in the presence of the silica gel, and subsequently determined by picryl-sulphonic acid. Results are shown in Table 2.2
TABLE 2.2
Concentration(jig)
Band 1 Band 2
Absorbance
Band 3 Band 4 Tote/
10 .02 .05 001 .02 .10
20 .04 .06 .03 .03 .16
40 .07 .12 . 04 .06 .29
60 .10 .18 .05 .09 .43
80 .17 .22 .07 .11 .57
100 .19 .29 .09 .13 .70
The relative concentrations of the ceramides may be calculated by comparing the height of each curve (Fig. 2.2) for a particular concentra-tion. In terms of percentage the four ceramide mixtures 1,2,3,4 are respectively in the ratio 18.6: 12.5: 41.8: 27.2, or approximately
1.5: 1: 3.3: 2.
In Table 2.2 it is noted that the total absorbance obtained by adding the absorbances of the four ceramide bands for each concentration is higher than for the standard ceramide values in Table 2.1.
also showed higher absorbance, depending on the area of silica gel
extracted. This was found to be due to the eosin indicator, which,
though insoluble in chloroform and hexane, carries through in the
picrylsulphonic acid method. A visible Ultra violet scan shows that
the indicator has some absorbance at 340.
The ratio 1.5: 1:
3.3: 2
was found by experience to vary some-what with time. The lower two ceramides were initially of much higherconcentration when a fresh solution of ex-bovine brain ceramides was
prepared. However, at times, bands
3
and4
became practically non-existent, and bands 1 and 2 increased much in concentration (plate 18.).The following conditims were found by TLC to have no immediate effect
on the freshly prepared ceramide solution: concentration on TLC plates
until overloaded; subjecting both oxygenated and nitrogenated ceramide
solutions (chloroform) to ultra-violet light overnight; boiling for
10 minutes a solution of ceramide in chloroform.
The ceramide does decompose, however, when the solution becomes
contaminated with the smoke produced when some of the lipid on the
walls of the tube is charred. (columns 12-16). These solutions were
tested for peroxides by shaking with freshly prepared ET-starch
solu-tion which turned blue within
3
minutes. Fresh ceramide solution con- tained no such oxidising power, and the blue colour was faintly observedO. B
T. N. as. METHOD FOR CERAMIDE, EX-BOVINE BRAIN (KOCH LIGHT)
FIG. 2.1
0•6
0
.
4
50 100 150 200
[image:48.825.193.622.105.512.2]ABSORBANCE CURVES FOR FOUR K.L. CERAMIDE SPOTS AFTER T. L.C.
0.3
0.2
0.1
0
0 20 40 60 80 100
Quantitative Ceramide Analyses of Milk Products
Several milk products were analysed for free ceramide by picryl-sulphonic acid after separation of the ceramide from total lipid
extract after TLC on preparative - scale plates. The exact method for obtaining the ceramide Was as follows. A suitable quantity of the milk product (e.g. 5 ml fresh milk, 0.2g butter, etc.) was weighed or measured such that the butterfat content did not exceed 200 mg by too much and cause excessive overloading of the TLC plates; the amount of ceramide was very small, however, and the plates could have been overloaded to 300 mg of neutral fats. The total lipids were extracted by chloroform-methanol 2:1 by the method of Gloster and Fletcher, '3 and, after filter-ing the extract through phase filter paper. the solvent was recovered by evaporation under reduced pressure on a Rotavapor; the lipid residue was dissolved in 10 ml chloroform. The extracts were applied to prepara-tive TLC plates (40 cm x 20 cm) by means of an automatic applicator, and the ceraMides separated by chromatographing in solvent A. When the sol-vent front had reached nearly the top of each plate, it was removed from the tank, allowed to dry in a fume-hood 15 minutes, and the ceramide band
(Rf - 9.4) located by spraying the edges and a strip in the middle of the
TABLE 2.3
Milk ProdvcI ‘ Ceramide % Ceramide w/w
(Butterfatk1°J) Concentration on Butterfat
Pasteurised milk (3/6%) 241g/m1 0.07
Evaporated milk (8.3%) 60pg/m1 0.07
Full-cream powdered milk (27%) 140pg/g 0.05
Skim powdered milk (1%) 26pg/g 0.26
*Pasteurised skim milk (0.5%) 15pg/m1 0.30
Pasteurised cream (32%) 80pg/m1 0.025
Butter (83%) 150pg/g 0.02
Margarine (100% vegetable oil) 100pg/g 0.01
The ceramide concentration in whole-pasteurised milk is an average based on about 10 determinations carried out through the year. 7:11
:Lt., pg/m1 io a little higher than that obtained for normal human blood serum, 20 pat m1 (21 ). The relative percentage cerainide based on butterfat is observed to be similar for whole milk products i.e. whole milk, evaporated milk, and full-cream powdered milk; the latter gives
a slightly lower result as does skim powdered milk compared with fresh
skim milk, indicating some loss of ceramide in the drying process.
Also, as the butterfat content increases in milk products, the relative percentage ceramide decreases very noticeably, as can be seen by comparison of skim-milk with butter or cream. This suggests that the ceramide is bound to the protein by hydrogen bonding and hydrophobic association in a similar manner to blood serum lipoprotein complexes.
Attempts were initially made to determine ceramides in milk products without separation from other lipids by chromatography. These were found to give higher results, however, due to the addition to the yellow
sphingosine picrylsulphonate of the yellow collured fat-soluble caroten-oid pigments. Also, other sphingolipids would react with the
picryl-sulphonic acid, especially sphingomyelin, which is 60% hydrolysed by the method used. The results obtained are as follows: pasteurised cows' milk (254g/m1); human milk,
3
days after birth (50pg/m1); evaporated milk (80ug/m1); full-cream powdered milk (140 pg/g);butter (200 pg/g).
Quantitative Cholesterol Analyses of Milk Products
The method employed for total cholesterol determination is described
on p. 360 by Kates, 0) and described in detail by Courchaine et al. (1959) (30) Free cholesterol may be determined by digitonin.
Reagents: Stock ferric chloride solution : 205 g of FeCl 3 6H20
in concentrated (85%) orthophosphoric acid and diluted to 100 ml with the same acid - stored in a brown glass-stoppered bottle at room temperature.
Ferric chloride colour reagent :
4
ml of stock ferric chloride solutiontdiluted carefully to 50 ml with concentrated sulphuric acid, cooled, and stored at room temperature - discarded after two or three daysas cloudiness arises.
cholesterol was dissolved, and then 4 ml of ferric chloride colour
reagent (burette) followed by mixing by inversion several times. The
solutions were allowed to cool, and their absorbances read after 10 min.
at 550 mp against a reagent blank. A calibration curve was also plotted
up to 1 mg of pure cholesterol; the reproducibility of this curve was
checked from time to time using different samples of solvents of the
same reagent grade. The calibration curve obtained was linear, and
Beer's law was followed up to 1 mg. cholesterol (Fig. 2.3)
TABLE 2.4
Cholesterol Concentration (mg) Absorbance
0.05 0.21 0.21
0.1 0.46, 0.46
0.2 0.96, 1.00
0.3 1.46, 1.48
0.4 1.93, 1.94
0.5 2.42, 2.42
0.6 2.94, 2.97
0.7 3
.440
3.400.8 3.25, 3.87
Milk extract(0.5 ml) 0.52, 0.56, 0.50
Almost all the lipids present in milk lipids are triglycerides,
and too much excess of these were found to interfere in the analyses,
producing a cloudy solution, However, most or all of the triglycerides
were separated free from cholesterol and its esters by TLC and the
analysis carried out by the above method proved to be successful; a
clear solution was obtained on reaction, with a characteristic purple
determined, at three different concentrations, 0.1 mg, 0.3 mg. 0.5 mg. The cholesterol solution was spotted on the plate and the area contain-ing the lipid ( about 5 cm2) removed with a spatula. The cholesterol was extracted carefully four times with small portions of cold
chloroform. Results:
Absorbance
Concentration mg) standard extracted % extractable
0.1 0.48, 0.47 0.44, 0.44 93%
0.3 1.42, 1.42 1. 34, 1.35 95%
0.5 2.40, 2.38 2.25, 2.4 94%
Thus about 94% is extractable.
From these results, using the calibration curve, the concentration of cholesterol in fresh milk is 0.2 mg/ml.
The method appears to be reproducible; a calibration curve of say
.
0.1,*0.2, 0.3 mg cholesterol for each determination would ensure best results. The colour of the reaction product was observed to be reason-ably stable for at least half an hour, after which time it began to deteriorate slightly. Most accurate results were obtained by reading the absorbance of each sample exactly 15 min after reaction i.e. in the same sequence as the reaction was performed.Cholesterol in Ceramide
The presence of cholesterol was tested for in natural ex-bovine brain ceramides (Koch-Light) by spraying after TLC a plate containing
1 mg ceramide with ferric chloride spray reagent (31) (50 mg FeC13.6H20 in 90 ml water, 5 ml glacial acetic acid, 5 ml conc. H2304) and heating a few minutes at about 100 °C. The TLC was carried out in two dimensions;
4
CALIBRATION CURVE FOR
TOTAL CHOLESTEROL
3
ABSORBANCE
CONCENTRATION CHOLESTEROL (mg)
2
1
[image:55.825.68.613.81.539.2]Spectrodensitometric Analysis of Ceramide by Phosphomolybdic Acid Fow low concentrations of ceramides say less than 5 )1g, a quanti-tative method of analysis based on transmission-densitometry of the lipid on the plate would probably be the most efficient and accurate when a large number of samples are to be analysed, given a good scanner or spectrodensitometer. Charring of total lipids has been examined by Rouser et al, (5,6) steroids by Touchstone et al, (32) and serum ceramides by Z.A. Mejglo (Repatriation General Hospital, Hobart). (21) The accuracy of this method depends on complete separation of components and uniform spraying of the plates with the sulphuric acid spray reagent. It has Also been shown that the yield of carbon on charring is influenced by the degree of unsaturation of the component, its structure, and its
mobility on the TLC plate. One advantage over the T.N.B.S. Method would be, however, that the quality of the spray reagent, sulphuric acid, is the same from sample to sample, whereas the quality of the picryisulphonic acid reagent could vary slightly.
An interesting method of scanning charred lipids on TLC plates is to spray with "Neatan" plastic dispersion (Merck), remove the layer with transparent adhesive contact after drying, cut•into strips and measure the transmittance through the Charred spots. This method was met with some success, scanning the strips with a Spinco model RB
Analytical recording densitometer and intergrator ("Analytrol"), however, the filter in the instrument was suited only to scan blue-coloured spots, such as those obtained for serum proteins with bromophenol blue after electrophoresis. About 60% of the thin layer is removed on one applica-tion of "Neaten", a further 30-35% is removed on a second applicaapplica-tion to the remaining silica gel.
used as follows to analyse chromatographically separated Koch-Light ceramide (ex-bovine brain). Nearly linear calibration carves were obtained for concentrations between 30 pg and 100
pg.
The "Analytrol" was used for scanning, with aelit width of i mm.Either clear plastic or very thin glass sheets could have been adopted for the experiments; some 20 cm x 20 cm translucent plastic sheets were available that were inert to reagents and TLC solvents. These were convenient as they could be cut into strips before or after TLC for use in the Analytrol.
The plastic plates were coated with a thin layer of silica gel G I air-dried 30 minutes, activated at 110°C for 17 minutes, and cooled 30 minutes in the dessicating cabinet. The plates were removed, and the
50.
glass plate in an oven at 105 °C-110°C for 4 minutes, and air cooled 5
minutes before scanning by the Analytrol. The region of the strip just above the first ceramide was used to zero the instrument. Results for concentration vs area under the curve are shown in Table 2.5 and
[image:58.563.78.545.272.807.2]graphically illustrated by Fig. 2.4. Also results for total area under the curve vs. time of heating (at 100-105 °C) are tabulated and graphed. The optimum temperature of 100-110°C had been approximately determined from preliminary experiments. Less than 100°C caused slow reaction and dulling of the surface.
TABLE 2.5
Ceramide Area under curve by Analytrol (cm 2 )
Concentration ('g)
ceramides 3 & 4 ceramide 2 ceramide 1 Total
5 0,4 0.3 0.2 0.9
10 0.8 0.7 0.6 0.5 0.2 0.2 1.6 1.4 15 1.2 0.8 0.7 0.4 0.3 0.23 0.4 0.3 1.9 1.5
20 1.4 1.25 1.5 0.3 0.3 0.8 0.3 0.45 0.4 2.0 2.0 2.7
25 1.5 0.5 0.8 2.8
30 1.6 2.0 0.6 0.5 0.8 0.3 3.4 2.4
40 2.2 1.6 0.6 0.8 1.0 0.6 3.8 3.0
45 1.3 0.4 0.3 2.0
50 2.7 2.0 1.0 0.7 1.1 0.9 4.8 3.6 60 2.8 1.7 1.7 1.0 0.8 0.7 1.0 1.2 0.6 4.8 3.7 3.6
70 2.5 0.9 0.8 4.2
80 3.5 3.0 0.9 1.2 1.3 0.9 5.7 5.1
90 2.8 1.0 1.5 5.3
100 3.0 1.6 1.2 0.5 1.6 0.9 5.8 3.0
TABLE 2.6
Time of heating of 50 ,dg ceramide @ 100-105°C (min)
Total area under curve by Analytrol
1.0 1.4 1.6
1.5 3.0 2.5
2.0 3.7 4.2
3 4.5 4.7
4 4.6 4.9
5 5.05 4.7
7.5 4.75 4.85
lo 4.3 4.55
15 3.1 3.6
30 2.2 2.6
A study of the graphs shows that above VOlig, the results are not very reliable at all, but over a limited range a reasonable linear calibration curve may be obtained. There are many variables, however, as outlined in the following paragraph.
Heating time and temperature are to be kept constant, as determined by experiment (105°c for 4.0 minutes was used). The 1 cm line of
applica-tion of the ceramide is to be kept as narrow a width as possible (1.5 mm). If the ceramide bands are inclined at too great an angle they cause over-lapping of peaks on the analytrol. It was found that this was the case if the silica gel was of an uneven thickness. The strips could only be used once since to use them again would mean that they would have to be overlapped on the spreader and cause uneven thickness. The separation of the four ceramide bands affects the results also the peak heights
10•0 1-0 .5
0
5 10 15 20 25 30
TIME (min)
7-5- TOTAL AREA
UNDER CURVE (crn2 ),A
51)
2-5
52.
PHOSPHOMOLYBDIC ACID CALIBRATION CURVES FOR CERAMIDE USING
MODEL RB ANALYTROL RECORDING DENSITOMETER AND INTEGRATOR
2.5
2.0
1-5
EFFECT OF TIME ON HEATING (100-105 ° C) (50 pg CERAMIDE)
5.0
4.5
4.0
3.5
30
15
12-5
100
Colorimetr ic Determination of Cerauide by Reduction of Acid-Dichromate The ability of various lipid classes to reduce acid-dichromate solution quantitatively has been proposed as a method (34) and applied to the quantitation of cholesterol, cholesterol stearate, tripalmitin,
palmitic acid and lecithin. (35) Its application to ceramides is here described, with some analyses carried out on milk.
Microgram quantities of ceramide (to 200 ,ug) were heated with 3 ml of acid-dichromate reagent (2.5g K 2Cr207/1 of 36N 112,304) for
45
min. in glass stoppered tubes in a boiling water bath. The reduced solutions were then cooled, diluted with water (40x) and the absorbance read at 350 mu against a blank of equimolocular potassium chromium sulphate, or water since its absorbance is practically negligible at 350 rlu. The change in absorbance, i.e. the amount of dichromate reduced, was found to be linearly proportional to the amount of ceramide above 10-20 pg. (Fig. 2.5). Koch-Light ceramides and fresh milk ceramides were used directly for the standard curves shown. The milk ceramides had been obtained previously from column and preparative-thin-layer chromatography on the lipids extracted from fresh milk; these were slightly contaminated with some ceramide derived from the hydrolysis of milk sphingomyelin. It is noticed that the curve for the milk ceramides has a higher gradientthan that for the brain c eramides. This could be just a concentration error, or due to the relative nature of the fatty acids; a high propor-tion of hydro xy fatty acids are present in brain ceramides, but the relative amount of unsaturated fatty acids in milk ceramide compared to brain ceramide is high, and mostly linoleic (details later). Unsaturated fatty acids will reduce more dichromate as the oxidation of one double bond requires 4 (0), whereas the oxidation of secondary alcohols requires only 1 (0).