MASSEY UNIVERSITY AND PALMERSTON NORTH
An Impact Study of Some Relationships Between University and City
A thesis presented in partial fulfilment of the requirements for the degree nf Moster nf Arts
in Geography at Massey University
by
Adrian Donald GovBr
ERRATA :
p
O3.7
Table
3.Should read:
Mt
==Ac +
t
-
(Ac XLt)
Ac + t
::tAge cohort
Aat census
C +t yrs
oPo48 Table 9.
Age groups 65 - yrs. should read 65+
Po49 Table 10. Age groups 90- yrs should read
~o
+
I
P
853Line one should read 30
-34age groups
Po56 Table 12
0Correction as for Table
3.P.60 Table 13. Note should read:
Internal Students= Full Time+ Part Timeo
P.65 Table 16. Year 1969 should be added as follows:
Education
234
Humanities
702
Science
82
Soc. Sc
L716
1734
P.67 Text correction:
Formula should read~as follows:
[ a ( IE) - b] + a [ M-b (M ) ]
+ a
l
M-b (M)j
X RABSTRACT
An examination of the regional impact of a non-profit making institution is central to this study. This type of institution is seen as not merely a response to a local or national need but also as a determinant of regional population and economic change. The development of Massey University since 1966 was the example selec-ted for analysis. The study seeks to add to the more usual type of impact analysis by examining population and spatial changes as well. It also seeks to derive relationships that may be of use to planners of other similar institutions.
The population base prior to, and after 196G was examined in terms of growth» structural changep and migration dynamics. The population components directly attributable to the university were also measuredp then subtracted from the established base population. This revealed the probable population impact that the university had made upon the city of Palmerston North. It was estimated that the migration gain of
snon
from 19G~ to 1971 would have been a net loss of 500 if the university had not intervened. Infrastructure additions of 87~ dwelling units, and over 30 class-rooms were estimated to have bean neoded to provide for the esti-mated 8% of the total population that could be directly attributed to the university. Suburban growth in new hnusing areas and in the central city area were seen as one consequence of this.multiplier value of 1o34 was derivedo The second survey was of non-academic staff members, and from this a multiplier value of 1o3D was establishedo The survey of students yielded a multi-plier value of 2o27o The economic base multiplier value of 1o35 was applied to the regional expenditure of the university itselfo From this information it was determined that an estimated $18a15 million was added to the regional income in 1976 from all the pre=
ViOUS SOUrCBSo
The relationships between all of the estimates may be expressed in terms that may be of interest to those involved in the planning of other tertiary institutions within the regiono They are as follows:
For every 100 internal students enrolledP full-time and part-time; 35 staff members and dependents were added to the city
populationo
18 housing units were requiredo
19 jobs were created at the universitya
6 jobs in supportive industry were created in the cityo 0o72 classrooms were required for dependent childreno
i i
PREFACE
At the outset of this study it was the intention to examine the impact of a 0newu University upon its region. To a geographer the human and spatial dimensions of change are as important as the more usual economic analysis of impact. It is with this in mind that the study was undertakeno
Education is an activity that society engages upon for the intrinsic merits of so doing. Nevertheless it is clearly seen by all who inhabit Palmerston North city that the results of the University development are seen in population growth and changesP in extra employment created within the regionP and the directing of millions of dollars into the local economy, all of which should be measurable. It was felt that the stimulus of the University development has created a city that is substantially different from the type of city it wasp and from others of a similar size in the nation not having a university. An important aim of the thesis is to probe changes following University development.
The phenomenon of population change as a dynamic process assumes importance in this studyp and some attempt is made to explore this in terms of migration, the dynamics of the cityvs growthP and the overall changes that these have broughto There is little doubt that this is capable of being pursued further~ and a study of these elements at some future time could test the assum~ tions and findings made herea Additional research could also be undertaken to study the relationship between changes in population and the development of infrastructure to meet these changeso
In order to prosecute the study a close analysis was made of the government census figures for 50 years9 with greater
iii
was conducted of students ti1ho tt1ere boardingp fL1tting rmd living in hostels" Of necessity these were random SGmples, and an error factor is recognised as being present in the extrapolation of the results" Wherever possible this was reduced by cross checking the information gained with University statisticsP student enrolment forms, and other data obtained from the negistry.
Information concerning staff membersv bnth academic and non-academic, was similarly obtained" Two surveys were conducted to ascertain levels of income and expenditure, marital status and number of dependents, and residential details. One was conducted with academic staff members, the other with hon-academic staff" Questionnaires were sent to a random sample of each staff category as the University had no information available. Again error is a recognised factor, and as it was not possible to cross check as previouslya the data so gained was examined and interpreted in a conservative manner" The impression left was that the University knew very little about itself.
Whilst the techniques used are recognised research methods the variation in time span makes it less accurate than it would otherwise have been. If data for 1976 were available from the records of that year, rather than gathered in 1978 and applied in retrospect the accuracy would be greater. Where change~ have
I
occurred in this manner9 every effort has bean made to compensate. ACKNOWLEDGMENTS
iv
Department of the University, he has given me an appreciation of the academic discipline of Geography.
I could have done little without the assistance of my employe~s, the officers of the Hawke's Bey Education Board, and the Department of Education through whose generosity I was able to continue with University studies. I am grateful too, for the ready assistance of the Registry staff of the University, especially Mr Weir, and his officers, Mr. Wood, Mr. Lovell, and Mr. Birkbeck. It was with their assistance that I was able to obtain information from the University recordso
T/:\DLE
m--- corncrns
Preface
Acknowledgements INTRODUCTION
The Li teruture
CHAPTER ONE. SCOPE, METHODOLOGY AND THEORY Population Parameters
Economic Analysis Regional Input Sources
CHAPTER TWO. PALMERSTmJ NORTH POPULATION GROWTH
PagP.
:i. i iii 1 3 21 22 23
PRIOR TD 1966 27
Overall Growth prior to 1966 Age and Sex Structure
Migration Patterns
CHAPTER THREE. PALMERSTON NORTH POPULATION GROWTH AFTER 1965
Overall Growth Suburban Growth
Changes in Age and Sex StructurP. Migration
CHAPTER FOUR. THE UNIVERSITY POPULATION Internal Students
Extra-mural Students Student Residency Student Impact Model
Age and Sex Structure of StudRnts Student Migration
University Staff
Academic Staff Dependents Non-Academic Staff Dependent3 Total Population
CHAPTER FIVE. THE IMflACT OF TII[ UNI\/Ef<SITY
77 78 79
POPULATION 82
Population Grrn,,th
Population .structure
Migration
Suburban Changes
Education, Health, and Welfare
CHAPTER SIX. INDUSTRIAL STRUCTURE AND EMPLOYMENT
82
83 84
85
87 90
New Zealand Industry 91
Palmerston North Employment 92
The Employment Multiplier 97
Employment Impact 100
Estimates of Employment by Category and Sex 101
CHAPTER SEVEN. MASSEY UNIVERSITY AND THE REGIONAL
ECm!OMY 104
Multiplier 104
Definition and MeU1ods 101+
Data Collection 106
Disposable Income of Acodsmic Staff 105
Non-Academic Stoff 108
Tot.:il Staff Impact 1Dfl
Student Incomes and Consumptinn 111
University Expendi.turi: 113
Estim8tes of Regional Cash Fl111~ 1~7
CHAPTER EIGHT. CONCLUSIONS~ IMPLICATIONS A~D APPLICATIONS
Masse~ Univ~rsity's Growth rottRrns University rolicy and nBgional Impoct Derived Ratios
Implications and Applications APPENDICES
BIBLIOGRAPHY
F1age
120 120 121 123 121;
12G
Table Number
1
2
3
LIST OF TnBI.Ec,
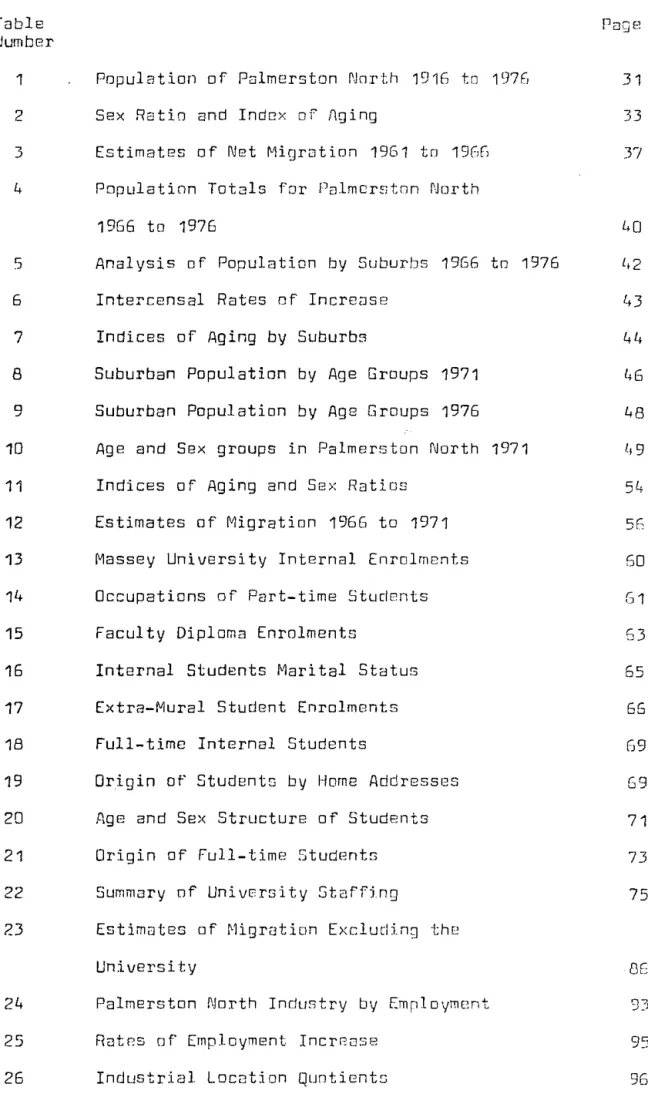
Population of Palmerston Narth 1916 to 1975
Sax Ratio and Indax of nging
Estimates of Net Migration 1961 tn 19GG 4 Population Totals for Palmcrstnn North
5 6 7 8 9 10 11 12 13 15 15 17 18 19 20 21 22
1966 to 1975
Analysis of Population by Suburbs 1966 to 1976 Intercensal Rates of Incre~se
Indices of Aging by Suburbs
Suburban Population by Age Groups 1971 Suburban Population by Age Groups 1976 Age and Sex groups in Palmerston North 1971 Indices of Aging and Sax Ratios
Estimates of Migration 196G to 1971 Massey University Internal Enrolments Occupations of Part-time Students Faculty Diploma Enrolments
Internal Students Marital Status Extra-Mural Student Enrolments Full-time Internal Students
Origin of Students by Home Addresses Age and Sex Structure of Students Origin of Full-time Students Summary af University Staffi.ng
23 Estimates of Migration Excluding the University
24
25
25
Palmerston North Industry by Employmrmt Ratr.s of Employment Incrr.ase
Industrial Location quntiBnts
27
28
29
DifferBntial EmrJnymcnt Shi.fts
Employment by Sex ond Inrlustry
Income and Expenditure of Academic Staff
30 Income and Expenditure of Non-nc2dcmic
31
32
Staff
Income and Expenditure of StudBnts University Income and ExpenditurB
Page
98
99
107
109
112
LIST OF FIGUF<[::i
Number Figure
1 Age and Sex Structures of Palmerston North City 1956 ond 19GG
2 Age and Sex Structures of rolmerston North City 1966 and 1971
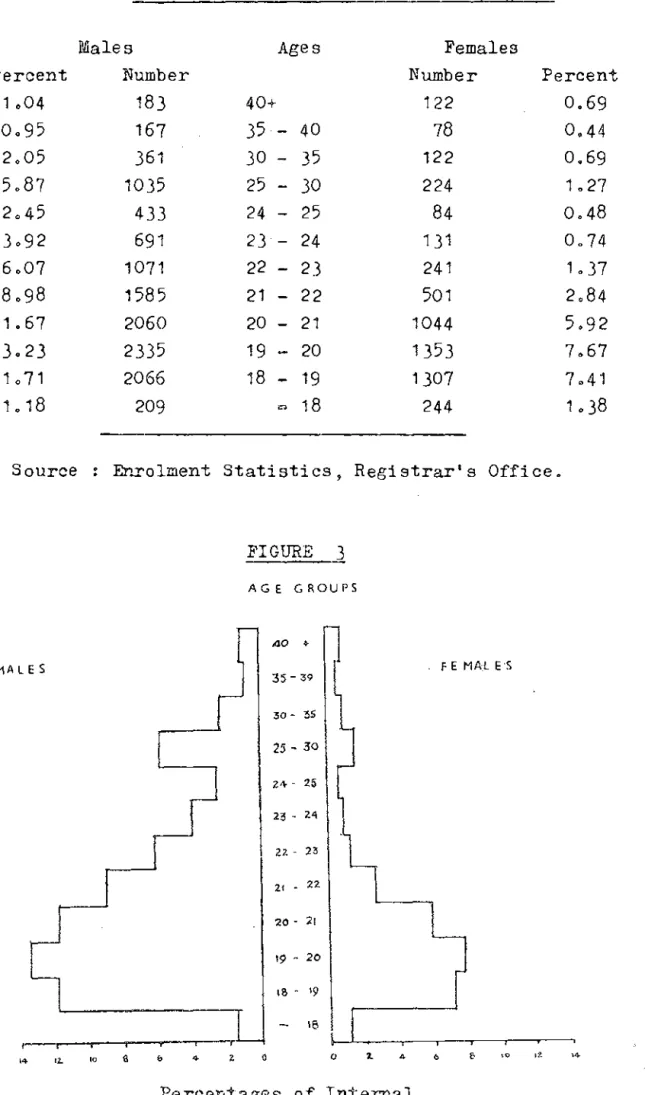
3 Age and Sex Structures of Full-time StudPnts 1972 and 1977
Page
29
51
INTRODUCTION
Impact studies have tended to be dominated in the past by an economic analysis of the effects of industrial or business enterpriseso These have generally been unalysed for the impact upon employment and regional incomeo The analysis has depended upon the derivation of a multiplierP which is then applied to the initial injectiono The indirect results of this injection are then calculatedp and the aggregate determines the impact of the new businesso
Universities, hospitalsp and other large publically owned non-profit institutions play as large a part in regional develop-ment impact as do industrial concernso These are financed by taxes on the one hand and provide benefits to society on the othero Usually these benefits are recognised as being a function of that institution, in the form of healthP welfare or educationo Often they are regarded as a part of the city infrastructure that has grown as a response to the city's needso It is argued that these institutions are major employers and purchasers of skills and servicesP and as such play a large part in determining
regional growth as do industrial enterprtses. As well as being an infrastructure response they may be also regarded as a major factor in determining the future growth of employment and regional income. By obtaining funds from outside the regionP and directing these into the region in various forms they engender regional changes as important as any industrial concern.
2.
The human elementP traced through the dynamics of population adds one further element to conventional analysis.
Population is the point of refBrBncR from which all other elements are observedP and from which they allp singly and collectively derive significance and
meaning (Trewartha 1953P 27).
The approach of a geographer to an impact study adds the human element to the economic so enabling the ~onsequent spatial pat-terns to be better understood. Such responses traced through the location and movement of people thus adds to the economic dimensions assessed through the flow of cash and goods.
This study advances the point of view that a large pub-lically owned non-profit institution engenders as important an impact upon a local region as an industrial concern. It seeks to explore this by examining the expansion of Massey University from a small agricultural college in the 19601s to a multi-faculty university in the 19701s. It contends that this has generated important changes in the city of Palmerston North. These changes may be perceived not only in employment and regional income growthp but also in the population numbersp structurep and migration pat-terns of the city. It considers that this may be related to further infrastructure growthP in particular housing and educa-tional facilities.
findings may also have rBlevance to the future development of the scheduled Palmerston North Polytechnic.
THE LITERATURE
Impact studies may be seen as an outgrowth of classical multiplier of macro economic theoryo The calculation of the analagous regional multiplier is an early exercise in most analyses (Steele, 19729 116)0
The multiplier concept was propounded by Keynes (1936) as a central element in national income determination. It is based on the idea that any exogenous injection of capital whether by consumption, investment, government expenditure or export receipts will increase total in~ome in the economy first by the injection itself, and subsequently from generated income arising from the initial injection. This is known as the multiplier effect. This occurs because incomes received from a n~w investment or some other source are partly respent creating further incomes
(Samuelson, 19559 314)0 The size of the multiplier effect deter-mines the total impact, and in a simplified economy is determined by the marginal propensity to consume (MPC). This term denotes the fraction of the extra dollar of income that consumers spend on goods and services. The marginal propensity to save (MPS) is the fraction of that extra dollar that consumers save. The change in income ( Y) is calculated by multiplying the investment change ( I) by the reciprocal of the marginal propensity to save, or alternatively by the marginal propensity to consume subtracted
from 1. This is usually expressed in the form;
~ y = 1 X 6 I
MPS
or alternativelyp
b. y = 1 X b. I
4.
The multiplier value
6Y
is conventionally denoted by the symbolThe size of the value K9 which determines the impactP is
determined by the amount of leakages from consumption expenditure. Such leakages have been identified as taxationp savingsP imports and business profits (SamuelsonP 19551 315). Increases in pro-duction ,and income levels can be brought about by increases in population, capital equipmentP innovationp or the use of unused natural resources.
THE REGIONAL MULTIPLIER
The Keynes' multiplier concept is the basis of regional multipliersP and hence impact studies. To suit the specific purpose modifications have been made to the simple conceptual model. That this was necessary was pointed out by Thompson (1972p 141) that 'with self sufficiency •• (of regions) •• diminishingp regional imports and exports take on greater relative importance.' Modifications have been found necessary to allow for these fac-tors.
Impact studiesP using regional multipliers have been based upon two general approachesP the economic or export base approach and the input output model. Both realise different ways of
developing regional multipliers.
ECONOMIC BASE APPROACH
5.
behaviour nf that sxtornol domAnd (Dr11wnrigg, 1975, 113). The other sector, the servicing or 'non-basic' sector produces goods
and services for consumption within the rRgion; this sector
ser-vices the basic sector, and the persons amploysrl in it. The exports base approach hypothesises that o fairly stable
relation-ship exists between the two sectorsp end any expansj_on in the
basic sector is reflected by direct changes in the non-basic (Andrews, 1955). If basic sRctor smrlnymcnt constitutes a steady proportion of total employment, a ratio or multiplier value can be calculated to show how many non-basic jobs are supported by each basic one. This multiplier value can then be applied to new employment in the basic sector to estimate secondary or indirect employment so generated.
The simplest method of calculating a multiplier value using this approach is by comparing the ratio of export employ-ment with total cmrloyemploy-ment for a given year. This may be
repre-sented by; T
K =
X
where T = total employment, X = export employment.
A more stable multiplier may be derived by examining the ch2nges in each value, over a period of time (Garrison, 1972, 330).
Employment multipliers are then calculated by 1 + -N B
An example of the application nf this methodology is a
study of five Kentucky rural towns, and countries (Garrison, 1972).
The Garrison study sought tn d2terminc tho impact of new industry
in a regiono The four basic componBnts of personal income were
identified as wages and salaries, propriBtor's income, property
incomeP and transfar paymcntso Income was ~lloted to two sectorsP
employ-6.
ees; the indirect component 1aas generated by these W~QBS being
spent on regional goods and scrviceso Rattier than use the change
in employment in export and total as input variablRs, Garrison
used an incremental employment ratio which he considered as mora
appropriate (Garrison, 1972, 335). This was given by 68V , or
L, Nb
e
the dollar increase in basic income required to generate a non-basic job. The lower the ratio, tl1e greater the impact through multiplier effect. This study found that for the years 1958-63 the multipliers were quite stable. They were given as: County A: 1.44-1.46, County B: 1.73-1.75, County C: 1.33-1.43, County D: 1.55-2.01, and County F: 1.26-1.30. Subsequent analysis showed that in this study the addition to new plant and payroll created a modest effect on personal income through local consumption. The impact on employment was small, the addition of 1177 employees generated only 98 new jobs in supportive services. This was attributed to the size of the towns under study, as supportive services were located at the regional centrR.
As an illustration of the application of this approach to a regional impact study this serves as a fairly typical example. It has been stated, 'Virtually hundreds of regional impact studies have been produced during the present decade. The major estimating effort in these studies has gnne into the construction of industry aggregate basic/service multipliers' (Garnick, 1970, 35). Other studies have introduced other modification to the basic variables. The Borg Warner study (1973) employed the marginal rate of tax with the marginal propensity to consume locally, whilst Archibald
70
and exports (Brook
&
Hay 1974; Nourse, 1958)0 Conventionally this is stated in the following manner:( 1)
where Y
=
not regional income, E=
Domestic Investrnent, consumption, and government expenditure, X = Export Income, and M = ImportsoExpenditure on domestic goods and imports is a function of regional income:
E = eY
M
=
mYwhere e = marginal propensity to consume m = marginal propensity to import.
(2)
(3)
By substitution of equations 2 and 3 into 1 we obtain:
Y = eY + X - mY
so
Y [
1 - (e-m)] =X
X
and therefore Y =
T-=-
(e-m)(4)
(5)
(6)
From this it is seen that rEgional income is determined by export earnings, which is a restatement of the base economic concept. An increase in exports will lead to an increase in income. The level of regional income could be changed, assuming fixed exports by changes in the propensities to consume and import, [1-(e-m)] The difference between the two, (e-m), is the marginal propensity to consume locally. This variable w~s used in the Borg Warner study (1973) and will be employed in the present study. This is the major determinant of the regional multiplier. If equation 6 is divided by X:
y 1
=
(7)X 'I - (e-m)
(e-m) denotes the marginal propensity to consume locally. The
alternative is to derive K from estimates of e and m. Brown (1967) found from a variety of sources that in the United Kingdom that estimates of m ranged from 0.2 to 0.7. It was estimated that e was 0.8 and by substitution in a multiplier formula conceptually similar to equation 7P values for K were obtained of 1.28 for development regions and 1.24 for smaller regions (Brownp 1967P 33).
Further research in Britain attempted to place a minimum value on the multiplier (Archibaldp 1967) and inter-regional
differences in values (Steelev 1969). Difficulties in measurement and use of the model was pointed out by Wilson (1968) and Allen
(1969). With these in mind Greig (1970) examined the impact of
a £15m. pulp and paper mill at Fort William on the Highland
countries. His conceptual model differs little from above, except that to assist measurement he used average propensities to tax instead of marginal propensities. Likewise he used average pro-pensities to save, and import. Theoretically this would not effect the study to any significant degree, as pointed out by Lipsey (1963, 597). The consumption estimates were based upon a local value added approach. The average propensity to import was based upon family expenditure surveys from which local val~e added was estimated as a proxy for (1-m) (Greig, 1970, 37). The value form was found to be Do719 and from this income multipliers of 101-14-1.511 were
estimated. The upper and lower limits reflected the varying
nature of the Highland areas. By using average propensities Greig maintained that the application of the concept was made simpler.
INPUT - OUTPUT ANALYSIS
(Hoover, 1975, Isard, 1960, TieboutP 1965). A major difficulty encountered was that of finding a unit of measurement. From the various studies cited employment emerges as a widely used unit, but this fails to account for differences in wages and produc-tivity between industries i.e. producproduc-tivity in base industries can change as a result of technological innovation with no in-crease in the number employed. A second difficulty is that of differentiating between basic and non-basic sectors. There are arbitrary sectors that often contain a mix of both. These dif-ficulties led to a different type of analysis being developed, input-output analysis.
Input-output analysis is conceptually a set of accounts representing transactions amongst and between the following major economic sectors (Hoover, 1975, 223).
Intermediate Sector:
Private business activities within the region. This sector is broken down into individual industries or activities. It is referred to sometimes as the inter-industrial sector. Households:
Individuals or families residing or employed in the region as buyers and consumers of goods and sellers of labour.
Government:
Local and national government, within and outside the region.
Outside World:
Activities9 other than governmentp and individuals located
outside the regiono Capi t<';!.!,:
To express flows in a common unit money is used and so
~n IU
o
the buying of labour from households is shown as wages and pay-roll outlays. Inputs to the government sector is shown as taxes and rates9 and inputs to the capital sector as depreciation and inventory gains. The model is important in its ability to account for inputs and output in the intermediate sector for designated activities. These are tabulated in matrix formp and related on the matrix with each otherP and the other sectors. From the matrix value input coefficients are calculated to relate input from one sector to output of another. These values in turn are used to calculate multipliers and analyse the direct and indirect effects which growth in one sector has upon others and the economy (Hoover9
1975P Appendix 9-1). The introduction of consumption functions into the matrix allows the induced effect of increased household consumption expenditure to be added.
Operating input-output models is dependent upon the availability of appropriate income and employment multipliers derived from the matrices (Richardson, 1972, 142). Using this information studies have been conducted mainly into the regional effects of defence and space related expenditures in the United States. Initial enquiries were made into the effects of military spending and changes in the scale of activity in this field?
to subcontractingp up to one half of the tntal amount (RichardGonP 1972, 148). The only data these analysts were able to obtain per-tained to the remainderP thus biasing the findings. NASA released some information on sub-contractingP which was examined in inter-regional terms (Karaska» 1967). This study found that inter-indust-rial flows were very difficult to trace. Input-output analysis can show the full impact of an industry on a regional economy. In a study of the defense-space industry upon Los Angeles Peterson
&
Tiebout (1964) estimated that t,1.6 per cent of munufacturing employment was tied directly to those industriesp and defense-space expenditures.An Assessment
Of the two approaches the basic sector model is regarded as a cost effective alternative to input-output analysis for small regional studies (GarnickP 1970P 36). The cost of data generation for the input-output model seems to be a major problem with its operation, as does the obtaining of data information itself. The comparative effectiveness of each approach was examined studies for Washington Statep using each approach (Garnickp 1970). The conclusion reached was that the consolidated input-output closed model multiplier was approximately equal to aggregate basic
ser-vice multiplierss both mathematically and empirically (Garnickp 1970, 36).
Factors that Affect.. Mult_iplJ.er Val~!_e_s_
1973, 471). Significant relationships were found to exist between the multiplier size and these variablRs.
The relationship between city size and the multiplier value may be considered in the following argumnnt. As the city size increases so does the multiplier value, as the increased functions of a larger city lowers the propensity to import from outside, and so raises the propensity to consume locally. The larger the econo-mic base, in size and diversity, the greater is the capacity for self generating cumulative growth (Harvey, 1973, 472).
Non labour income, generated by unearned income such as rents or transfer payments also has an effect. If a city has a high non labour to labour income it is able to support a higher ratio of service to basic employment. The average propensity to consume local goods relative to employment income is higl1er, and a larger employment multiplier result. Levels of employment and unemployment also affect the propensity to consume as a study of unemployed workers found that the MPr is higher than for the pop-ulation as a whole (Archibald, 1967, 35). This is because savings are very small or non existant. Like1•ise food and housing expen-diture was heavily weighted, compared with travel and entertainment.
A secondary effect of unemployment concerns the mobility of labour, and the effect of a population .loss on regional incomes. A study by Vandercamp (1970) estimated that for every 5 persons leaving the 29 Canadian countries surveyed a further 2 became unemployed. Archibald (1967, 36) calculated that for each 7 in his study, that left the region to seek employment a further job loss of 1 occurred. Tho secondary depressing effect caused by out-migration from a labour surplus region has a negative efFect upon the employment multiplier. Immigration, conversely to meet an
in-130
duc2d effect of additional incomeo Lrvels af public investment
to cater for poriulation expansion by infrastructure additions is
one explanation for thiso The demograpt1ic nature of the city also was found to effect the propensity to consume locally, and thus multiplier values (Andrews, 1955)0 The latter two points assume
importance in the present studyo
The studies examined havB deolt with the measurement of the regional impact of industry in economic termso An exception · to this is the Borg-Warner study (1973)0 This study not only
examined the impact in economic terms, but also commented upon the potential social needs in the form of extra housing units, schooling facilities, and medical needso As such it illustrates the value of regional impact studies to planners to estimate likely social and infrastructure needso
The impact of non-profit institutions
The literature in this fiRld is somowhot sparse, as only three studies dealing with the impact of universities have been iocatedo Enquiries to other NP.w ZPaland universities have failed to locate other studies here or abroodo The studies examined vary in method, but each contains elements which are applicable, or are capable of modification for the present enquiryo
paten-tial source of local income and expenditure. To estimate the consumption patterns of the 18~000 st1Jdents at Syracuse a
ran-dom samplE of 100 students was surveyed. This sample was used to ascertain personal levels of expenditure. Using this infor-mation it was calculated that over $Sm. psr annum entered the economy from direct student expenditure. An additional round of $1.36 was calculated for each dnllar so spent (K = 2.36). As a study it was amongst the first of this kind.
As an economic study however it omitted to take into
account the levels of staff expenditure in spite of the fact that salaries of starf accounted for more than three times the amount of student expenditure. The study also did not estimate the impact upon' regional employment, population, or infrastructure. The derivation of a multiplier from basic non-basic employmEnt in the region, the application of this tn the regional cash flows that the university expenditure created, and a second multiplier based upon a student consumption survey, illustrated the use of well established methods in a new fiold.
The second study was a doctoral thesis concerning the impact of Stirling University, Scotland, upon its local region
(Brownrigg, 1975). This study was far more embracing in its treatment of impact th~n the Syracuse study. It examined
pop-\
ulation growth effects, the employment impact, and economic impact.
15~
population and employment figures, and the difference attributed to the university's impact.
The university component of regional income was estimated from staff and student numbers, salaries paid from the salary scales or bursary amounts multiplied together. Estimates of expenditures were obtained by using the Scottish Fomily Expendi-ture Survey, averaged over the years 19~7-7n (Orownrigg9 1975, 86). No surveys were conducted to ascertain whether or not stu-dent consumption and expenditure patterns differed at all from the category Brownrigg equated them with in the Scottish Family
Expenditure SurveyP that of farm labourers. It was also assumed that the expenditure patterns of staff and construction workers would be similar (Brownrigg, 19759 BG). Again no empirical work was undertaken to corroborate this assumption.
To the figures obtained from the previous estimates a multiplier conceptually similar to that used by Greig (1970)
was used, introducing the variable of local value added instead of the marginal propensity to import. Brownrigg suggested that the multiplier had a lower value of 1.30 and an upper value of 1.45. From the collected data Brownrigg then estimated the impact the university had upon local incomev employment and the secon-dary rounds of both within
1the regional economy. Estimated pop-ulation trends were then projected into the decade 1975-86, providing the model with a predictive function.
16.
assigned to them. In particular the assumption that was made that staff expenditure patterns and construction worker expen-diture patterns were similar.
The methodology used to arrive at the population impact of the project also bears scrutiny. Estimates of population and employment were based upon the decad~ 195G-GG, and projected into the decade 1966-76 to find a base level. This is claimed to be the effect that would have been found had not the university been built. The methods used were well established. ~le prepared pop-ulation projections by using empirical data. Firstly the base population was classified as to age cohorts and sexP secondly this was adjusted according to the specific fertility and mortality rates. From these a banded projection was made9 ~iith the lower case or smaller prediction assuming zero migration, the upper case assuming migration rates continuing at the former rate. It is an established method that depends entirely upon the predic-tive stability of birth and mortality rates. It is becoming recognised that these are by no means as stable as was believed a few years ago (NoZ. Vear Booki 1977, 57).
Employment projections also depend upon stability in
indust-ryo Changes derived from national and internal pressures on demand and output9 changes in technology and the rates of acceptance of such changes, decisions by management to expand or close branch operations of nationally owned firms are known to cause considerable changesB even in the short run. These factors compound the diffi-culties of forecasting employment in a sub-region prone to such pressureso
inter-17~
actions caused by the university1s gro~ith~ It was considered
by the authors to be a planning exercise to allow for addj_tional
planned growth by the university to a roll of "880 by 1977, from a 1971 roll of 3682. The developmental plan envisagsd an ultimate enrolment of 10 or 11,000 which representod the practical maximum of the present university estate. The authors stated that the reasons for an approach other than the usual reginnal multiplier calculation was that as statisticians it was not considered pos-sible to collect sufficiently accurate figures to bear the weight put upon them by input-output analysis. They also stated that they saw the effect of the university as being important in a number of fields, particularly housing, rather than as a general economic force. The study was designed as planning contribution to both the university and the city. The approach taken for the study was seen as more rewarding than the construction of a general model.
The Exeter study concentrated upon examining the economic effects arising from university spending and that of staff an~ students, the employment offered by the university and the accomo-dation and traffic problems created by the university's existence. The effects of personal contacts by staff and students as well as the availability of university facilities and expertise were con-sidered. The financial links between the university and the city were quantified by examination the payments and receipts of the institution. To do this the university and general economy was divided into four sectors. These were:
1) The Exeter City Council. 2) The local economy.
Payments and receipts could occur betwsen any two sectors~ either
within or outside the university. Intsrn2lly the university it-self was categorised into four sectors:
1) The university as a teaching and research facility
using the income and expenditure accounts as a sourceo
2) The university as a residential and catering organi-sation.
3) University employees in all categories of employment. 4) Students.
Each of these sectors was seen as having financial connections with the others as well as outside ones. Analysis of the direct contributions showed that in 1971 total expenditure was £3,920,000
by the university itself (Lewes
&
Kirkness, 1973, 8). The capital cost of residence was estimated as being £3,000 and total student income was estimated as being £1,850,000 or £1395 per head. A relationship between the size of the university and levels of expenditure, and it was concluded that a university of three times the size woulo contribute three timas the amount to the local economy. The university wus s-Ben as grmerating about 12% to 13% of incomes within the employment exchange area.Employment was examined and a table of regional employment showed a dependence upon offica and professional amployment. This accounted for 40% of the total regional employment. Surveys found that a very high proportion of academic positions, and about half of the administrative ones were fillerl by immigration. The skilled jobs were in the maintenance section and were occupied by older men. The survey found that the university oFfercd more secretarial and
office jobs than the manufacturing S8ctor in Exetero
conclusions that tenure was related to employment. Academic staff were found to be owner occupiers (69%) wt1ile council tenants were found to predominate amongst the domestic staff. The estimation of future housing needs was found to depend upon ratios established from the surveys. These were:
1) A staff to student ratio of just under 50%.
2) Heads of households account for GG% of total staff.
3) The percentage of staff living within the city boundary was 70.9%.
Using the planned growth of the university» and these ratios it was then estimated that an additional 258 house units would be required for staff by 1977.
Traffic studies and journey to work surveys showed that 40% of the local staff members travelled by car to work~ and 68% of those resident outside the city travelled the same way. It was found that 14% arrived on footv the remainder using public transport. The traffic congestion identified as being caused by university traffic was found to warrant a complete study in it-self. The Exeter Council commissioned an enquiry as a direct result.
The use of university facilities was investigatedv and the major users of these were learned societiesP summer schools9 and extra-mural student courses. Moreover it was claimed the planned extension of the facilities to allow for courses in hair dressing9
insurance and banking should bring the commercial sector of the region into closer contact with the university.
20.
as a priority for the study. Consequently it reflected the plan-ner's viewpoint. Nevertheless several important matters were raisedo It was stated that there was a likelihood that a thres-hold existed, below which the social and economic effects were not regionally significant. Ten yeors prior to the studyp in 1961, the university roll was 1350 and the effects were far less noticeable than in 1971 when the students represented 39 per thousand of pop-ulation. A second important aspect of the study was the formal identification of the many and various facets of a university1s trading, social, and cultural linkages. These were not only iden-tified but methods of quantification were also developed by which they could be evaluated. In spite of the objections raised by the authors to the use of a multiplier analysis approachv and the rea-sons given for this point of view1 it is believed that the consid-eration of generated regional income components, and the secondary effect of the expansion of regional employment could have added to the study. It is realised that as this was a planning study these points were not strictly necessary to this exercise.
The three studies show how different approaches have been applied to the measurement of the regional impact of a non-profit institution such as a university. As an application of what is by now a well developed model to new fields they all show a different direction for such studies. Non-profit institutions undoubtably contribute much regionallyP yet judging by the amount of published material available little is known of the contributions. The pre-sent studydraws upon the studies cited and hopesto add in turn to
21.
CHAPTER ONE
SCOPE, THEORY, AND METHODOLOGY
A preliminary study of the population of the city of Palmerston North prior to 196G sets a benchmark against which later developments may be compared. The year 1965 is a key year as it is not only a census year, but can bB identified with the beginning of the large scale development of the university campus and community. Such an examination includes established
para-meters of overall population growthf its structure and compositionu the rate of agingp and migration patterns. These establish the population basis for the decade 1956-1966.
To effect a comparison between these base trends and mea-sure the impact the university has had upon this base, t~10 methods of analysis suggest themselves. The first is that used by Brownrigg
. 'I
facilities on an adjac2nt site during a concurrent time per1odo
It would be most difficult to use the Brrn,1nrig9 method ,md attri-bute such growth to the intervention of the university alone under these circumstances. For these reasons thu methodology was con-sidered and rejected.
A second approach is that of establishing the population
base lines for a starto The total pop1.1J.~tion trBnds for the region
from 1955 onwards can then be considered, from which those elements known to be directly attributable to the university can be sub-tracted. This method eliminates the main objections to the former method, and was accordingly selected for this study. A close analysis of population dynamics of the period prior to and after 1955 is undertaken. This is followed by an examination of the elements that are directly attributable to the university, stu-dents, staff, and dependents.
To establish known base periods within this time frame census years have been selected. This keeps estimates to a mini-mum as known data is used wherever possible. It is recognised
that projections are necessary regarding migration trends, as empirical data is not available.
Information concerning the student population and staff is available from enrolment and other records at the university. Where such data is unavailable random sampling was emplnyed. Three such surveys were required, one for students, a second for academic staff, and the third for non-academic staff members. Information was sought in these surveys concerning income and
expenditure patterns9 place of origini sex9 marital statLJS~
produced. The university profile is tt12n ~ubtra~tPd from city population profile at census yBars. In this way the social impact or the university can be empirically gauged.
Spatial changes within thP city arP an important geogr-aphical aspect. From population data nbt~incd for suburbs within the city the growth or decline of each suburb can be determined. This can be examined in terms of population growth and structure. Structural characteristics of suburbs which house young families differ from those which house the elderly. By examining population trends in the suburbs the impact of the university upon the estab-lished suburban pattern becomes evident. The section which assesses impact in social terms occupies the first part of this study.
Economic analysis is also a vital part of this study. Two approaches are t2ken to the assessncnt of economic impact. The first is on Bxamination of the impact upon ~mploymBnt9 which
is followed by the rxamination of thr imp3ct upr1n regional income. The study examines employment impacts by injtially identifying that which is directly attributable to the university. This is done by accounting for members nf the Gcademic9 non-academic and other staff members. To this direct employment a multiplier is applied. In this case the multiplier is derived from the ratio of basic to non-basic employment within the region. The result is an estimate of the secondary nmployment that is generated within the region. The numbers employed in thnsB t~1a categories is obtain-ed from census data. From the numbers employobtain-ed in the work force in occupation groups it is also possible to estimate the probable occupation groups in which expansion took place.
21,.
The theory states that an initial injection of nee, income generates additional regional income by way of the multiplier. The new income in this instance is the sxnenditure of staff pay-rolls and student allowances in the city, coupled with the direct expenditures of the university. This is imported capital, as the source lies outside the region. As such it can be considered part of the basic sector of the region. The basic sector, or economic base conveys the idea that certain regional activities lead and ultimately determine overall r~gJonal development. These activities bring new income to the region either by exporting goods and services or public service activities funded by the government. The growth of the non-basic sector or retail service and tertiary sectors are the consequenses of basic sector growth (Andrews, 1955).
Four sources of regional input can be attributed to the
university. They are identified here as the university expenditure, student expenditure, academic staff expenditures, and non-academic staff expenditure. The Syracuse Univarsity study (Moore
&
Suffrin, 1974) adopted a method of arriving at the university regionalexpenditure by using a regional cash flow approach.
This is prepared from the university budget. Using this information those amounts that accrue from outside the region are separated from those with other sources. It is the amount that enters the university from outside the region that assumes impor-tance. On the expenditure side of the lcdgar the payments made by the university within the region are seperated from those made outside in the same manner. It is the former that is important
in this instance. This enables the contribution to the regional economy as a primary flow of income may be calculated.
multiplier to be used is derived from the census of nccupations using the basic to non-basic figures. This is a similar approach to that used by Moore & Suffrin (1974). It is argued that this is appropriate as the impact effects will depend upon the inter-regional trade multiplier, which is similar in every respect. This is to be further discussed in Chapter 7.
Student and staff incomes and expenditures are estimated from three surveys. These were distributed to randomly selected samples amongst students, non-academic staff and academic staff members"
The sample of students surveyed included those living in hostel accomodationv flatting, boarding, and at home. The non-academic sample included those employed in the registery, printery~ grounds and building maintenance, libraryp techicians and
The direct regional income injectinn was_ calculated in each
instance, and the multipliers in turn applied to this. To assess the total impact these figures were finally summed.
In this outline of the study methods the human and social impacts as well as the economic im11acts wore stressed. Each type of contributes an insight that complements the other. It is in this manner that the geographical assessment of institutional impact makes a special contribution.
FOOTNOTES
?'7
<.-I O
CH!iPTER TulO
PALMERSTON rJORTH PDPLJl_nTIDN GROWTH PRIOR TD 1955
The year 1955 marked tho commencamont of growth that narkad
transition for Massey University from a small agricultural College
to a full multi-faculty university. The Act of Parliament permitting
this was passed in 1954. It alsn coincided with an annual census
of population. For this study this year determines the point before
and after which population trends are examined. This chapter
examines the population trends prior to 1966 and through this seeks
to show which elements of population gBography should be used as
comparative measures.
Prior to the expansion of thE university the population of
Palmerston North ~J8S alr2ady groi~ing ot a mean rate of 2o79% annuallyp
following the war. This rate recorded a pPak in the 1945-1951
intercensal period of an annual rate of 3.19%. The rate of increase
subsequently slowed, and for the 1961-1956 period was 2.58% annually.
Following this an influx of staff and students arrived from all
parts of New Zealand and overseas.
Overall Growth Prior to 1955
In terms of population numbP.rs the city of Palmerston North
has continued to grow steadily from the first years figures were
kept. From 1920 when the population was 15,549 until the 1935
census when the city had 221202 people, growth seemed steady. An
examination of the intercensal annual growth rates does indicate
a slowing in the annual rate of increase, however. For the three
census periods in the years 1915 to 1936 these were calculated as
the population grew from 259277 in 1945 to 35p632 in 19569 and 469832 in 1966.(see Table 1). The intetcensal growth rates for these periods were calculated as 3.19%, 3.13% and 2.85%
respec-1
tively.' By comparison with the national figures, when the pop-ulation of the country grew from 1p7479679 in 1945 to 2,417,543
in 19619 and 2,676~788 in 1966 with intercensal increases being calculated as 2.05%9 2.30%, and 2.10% annually. The city of
Palmerston North may be seen as growing ot a rate in excess of the national trend.
The examination of the city's population numbers for the period from 1945 to 1966 shows that at the latter part of this time span the population grew from 30p351 in 1951 to 41,014 in 1961, and to 46,832 in 1966 giving an overall annual mean growth rate of 3.05% for the 19501s to mid 19601s. To provide a stan-dard for comparison the mean national increase was 2.23% for the same period. The North Island, which was growing faster than the South Island had a rate of 2.51%. These trends, coupled with an examination of Table 1p show that the ratR of population increase accelerated during the late 19501sp later to slow, but that the city was still growing at a faster rate than either New Zealand or the North Islando
Age and Sex Structure
8
MAL ES
6 4 2 0 0
19 St
2
FIGURE 1
AGE AND SEX STRUCTURES
PALMERSTON NORTH
1956 -
1966
AGES
FEMALES MAL ES
'75 ...
70 - 14
]
65 - 69
bO - 64 55 - 69
!:,o - 54
45 - 49
40 - 44 '35 - 39
,;o - o4
26 - 24 lg - 19 ,o - 14
l
6 - 90 - 4
4 6 8 8 6 4 2
PERCENTAGE OF POPULATION
FEMALES
0 0 2 4 6
1966
Source; New Zealand Census of Population and Dwellings
9Wellington Regional Bulletin
11956: 1966
8
? C'
age and srcx did not di ffc=!r much frrnn thnsr-=? of other middle order cities0 except for a decline in the 1n to 19 male age groupP
fol-lowed by a bulge in the male group of 14 to 39 years. Ten years later this pattern was changed. The age group of 15 to 19 years for both males and females had increased, which can be related to the establishment of a Teacher's College. Ev8n more significantly, but unaccountably a decline in the male ond female age group of
30 to 34 years was observed.
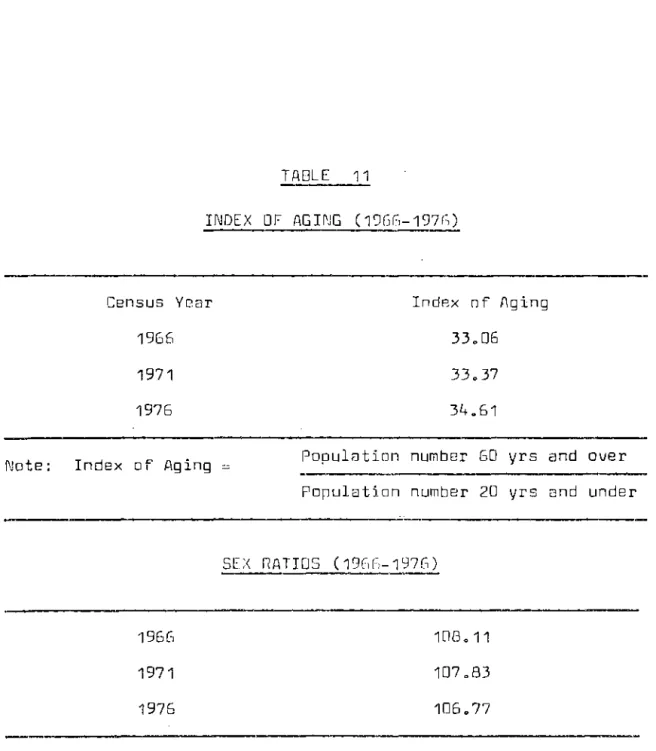
Another te~hnique that reveals nthar changes in the pop-ulation trends is that of calculating a sex ratio, that is the number of females in the population per 100 males.
number of females Sex ratio
-numberof males X 100
Using this technique a sex ratio of 120.94 ~1as calculated for
the year 1945, with census figures used as the source data. This means that for every hundred males in the city there were almost 121 females. The ratio changed to 110.DC, ond by 1966 hod fur-ther altered to 108.11. Over o period of 20 years the balance between the sexes was slowly redressed.
One further technique used widely is to determine whether or not the population is growing older nr younger. This is the index of agingu and is calculated by comparing the number in the population aged 60 years and over with those 20 years of age and younger. This derives 3n index numbEr which enables such
com-parisons to be made. Aging indices calcul~ted for the period under
reviBWp for tho years 1945P 1956 and 19GG 8TB calculated as being
45.23, 36.98v and 33.06 respectively (Tuble 2).
TABLE 1
POPULATION OF PALMERSTON NORTH CITY 1916-1976
Census Year Population ~\nnual Increase D/
i~
1916 12,827
1921 15,649 4005
1926 1811153 3oD1
1936 22,202 2o03
1945 25,277 1o45
1951 30,531 3.19
1956 3511632 3o13
1961 41,014 2o85
1966 46,832 2.68
1976 57,839 2o14
Source: New Zealand Census of Population and Dwellings, 1916=1976
Note: Annual rate of increase was calculated by:
320
of the sexes was restored somcwhGto It must be remembered that this period was also the time span during which the post war
'baby boom' was most noticeable. Migration Patterns
The movement of people to and from a region is often recog-nised as one indicator of the economic state of health. The
studies cited in the literature (Vandercarnp, 1970 and Archibald, 1967) both showed that a population loss had considerable effect upon regional employment and incomes. Immigration was shown to have the opposite effect, as there are secondary effects operating through the employment multiplier and the induced effects created by investment to cater for the employment and population expan-sion by infrastructure additions. From the geographer's point of view the effects are not only economjc~ but migration leads to spatial variatinn in the selection of dPmographi~ characteris-tics. Migration is rBcogniscd as o sRlcctivr rrocess, highly variable in nature (Trlin, 1971P 3). Demographic changes were also recognised as effecting the propensity to consume, and hence the multiplier value (Andrews, 1955). Migration is therefore ari aspect of the study that is important to consider geographically and economically.
A major problem in measuring migration is the lack of direct information. This was commented upon in o study of migration
Census Year
1945 1956 1966
Notes:
1) Sex Ratio=
TABLE 2
SEX RATIO AND INDEX OF AGING
Sex Ratio
120094 110000 108011
Number of Females
Index of Aging
45023
36098 33006
X 100 Number of malP.s
Number 60 years and over 2) Index of Aging=
Number under 20 years of age
Source: Data from New Zealand Census of Population and Dwellings
1945-1966
is applied to 3ge groupj_ngs in th8 rc".xisting popuL:1!:irm to
dBtl,r-mine the number expected to survive.
Dy
comparing this with the actual number found any difference m~y he 3ttribut8d to migration. This method has been widely employed in this country by McCaskill(1964)P Heenan (19GB) and Frazer (1971). The effectiveness of
this method has been commented upon by Trlin (1971, 23)
An inescapable margin of error in the resultant estimates ••• there should be little reason to qu2stion the facts of
occurrence, of direction, and of relative volume, especially when the ebb and flow currents of migration are strongly
developed.
Regarding the accuracy of estimating small gains and losses in the population through the use of this method, Heenan (1968, 15) notes,
This should be recognised more as an indication of net migration as an element of total change9 rather than
definite and precise evidence of either size or direction. It is clear from these comments that the Life Table Survival Method is able to show broad indications of net changes rather than offer precise information about smoll gains and losses.
Life Table Survival Rate methodology was applied in this study. The actual origin and destination of migrants remains unknown. Some supportive studies are ovailable to fill in the data gaps. A study of Takara, a suburb of Palmerston North (Hunt9
1970) and a study of electoral roll an2lyois (Andersony 1954) during the period 1960 to 1962 supplies some direct information.
",
and promot:i.ono It tt121s notrod thnt tl1j_s tdilc.i Fl3flC:r:L:illy truu of those employed in large national organisations such as banksP teachersp government departments and salPs firms. The members of these groups9 being in thP city in large numbHrs contributed
increasingly to m igrot ion chunges (Andr:rson, 19Gli, 171.1).
A draw to would be migrants was the state housing suburb of Takaro0 by providing new housing opportunities. Hunt (1970P 38)
found that this was mentioned by BS% of hor intorviowed sample and nearly one half of the sample occupied Housing Corporation units. Over 30% of the sample intended to leave the suburb in the near future citing the inadequacy of the houses that drew them as the reason for this. Insufficient size, tenancy~ and ownership were some reasons given for this. Of the immigrants she found that Takaro drew an oppraciable proportion from the local rural area, some 37.2% of the s3mrl2 having lived within 30 miles of the city previnusJ.y. A rondnm sample of the house-holds linked movement into Tokoro with the lower half of the North Island, especially Wellington and the Hutt, as well as the upper half of the South Island. None had resided in Auckland or f\Jorth Auckland.
360
who subsequently leave when the period of tr3ining is nver. This
is conjecture at thi5 pointP and thRso trends could prove an avenue
Net
Age Groups
5 - 9 Yrs 10 - 14
15 - 19
20 - 24
25 - 29
30 - 34
35 - 39
40 - 44 45 - 49 50 - 54
55 - 59
60 ·- 64
65 - 69
70 - 74
75 - 79
80 - 84
TABLE 3
ESTIMATES OF NET,MIGRATIDN (1961-1966)
Male 206 154 267 103 139 61 43 33 80 7 52 1 15 5 1098 Female 119 89 622 -50 -56 18 76 91 23 70 4£1 47 49 19 -8 -41 1112
Note: Calculations were b~sed upon the Life Table Survival Method Mt= Ac= t - (Ac x Lt)
Ac - t = Age cohort A at census c - t years Lt - Life table survival rate during t yeQrs Mt = Net migration overt yBars
FOOTNOTES
1 The annual intercensal rate of increase was calculated by the use of the formula:
t
(
J
P1/PO - 1 ) X 100where PO= population numbers at the initial time period P1 = population at the later time period
CHAPTErl n1nE[
PALMERSTON NORTH POPULATION GROWTH SIN~E 1965
The population of Palmerston North city grew from 45,832 in 1966 to 51,893 in 1971 and to 57,839 by 1975. This chapter deals with the various aspects of the changes in ropulation that have taken place in the city since 196G. For this period additional information from census data concerning changes in suburbs within the city enables the growth and decline of these areas to be
measured and the impact of an immigrant population to be deter-mined. Some difficulty has been found in meshing data, as criteria
change from one census to another, but where this has occurred transformation techniques h8ve b8en m8de tn make comparisons. These are noted in the text.
Overall city population growth only becomes meaningful when compared to some established benchmark. Growth comparisons with the rest of New Zealand provide such a standard of comparison. The intercensal increase for the city of Palmerston North was
10.8% in the 1966-1971 period and 11.45% for 1971-1976. A com-parison with the North Island and New Zealand rates for the same periods shows that the city grew at a faster rate than both of these benchmarkso The North Island rates were 8.35% and 10.58% respectively. These rates in turn are 1.3% and 2.1% above the national gro1J.ith rates (Harris, 1977 » 10).
With a growth rate in excess of both the North Island and the nation established for the city as Q whole it is pertinent to
Vear
1966
1971
1976
POPULATION TOTALS FOR PALMERSTON NORTH CITY (1966-1976)
Population Number
li5 P 832
51,893
57p839
Percentage Increase
1966 - 1971 1Do8D%
1971 - 1976 11.46%
Source: Depto of Statistics, 'New Zealand Census of Population
and Dwellings' 1966, 19719 1976: tuellington negional