Agriculture
Chapter 8
8
Archived
at
Agriculture
Chapter 8 Summary
The impact from climate change on agriculture is expected to be significant because of the vulnerability of agricul-ture to climate conditions in general. Precipitation, temperaagricul-ture, weather extremes and evaporation rates all impact production. Agriculture is important to the economy of Croatia due to its overall value and its impact on food security, vulnerable populations, and the employment it generates. In 2001, 92% of Croatia was classified as rural and 48% of the Croatian population lived in rural areas. Generally, rural households are more vulnerable due to poorer access to basic infrastructure and poorer housing conditions than households in urban areas.
Existing climate variability already has a significant impact on agriculture. Extreme weather events have resulted in average losses of EUR 176 million per year during 2000-2007. This represents 0.6% of national GDP, or 9.3% of the GVA generated by the agricultural, forestry and fisheries sector. Looking at the future effect on maize alone, the lost revenue due to climate change would be EUR 6-16 million in 2050 and EUR 31-43 million in 2100. This corresponds to 0.8-5.7% of all revenue from arable crop sales in Croatia in 2005. Most of this damage is due to water shortage during critical times, as well as flooding and hail-storms which also cause damage. Particular years, such as 2003 and 2007, suffered huge economic damage that is difficult to recover. While some Government-supported insurance programmes and a new ir-rigation programme exist, current vulnerability to climate variability remains – particularly related to drought.
However, little information is available to assess the consequences of farm practices and climate variables. There are few crop models or agricultural sector economic models that would help the sector understand current levels of vul-nerability or future levels due to climate change. Furthermore, basic economic information about the sector and about the gross margins of crops is not available. Thus, while climate change may be a risk in the future, there are a number of actions that could be taken now to address current vulnerability to the climate.
Models to simulate the effects of climate (including climate change) on crops need to be calibrated for Croatian condi-tions to understand how the country should adapt. Furthermore, the Government should conduct a comprehensive overhaul of its existing systems for collecting data on agricultural production, prices and accounting for farm revenues/ costs in order to produce information. This should reflect the reality of the situation on the ground.
A multi-crop, multi-region agricultural sector model should be developed to assist the public sector in developing strat-egies and measures for coping with existing economic development, pressures to preserve the quality of the environ-ment, climate variability and finally climate change. This would also assist farmers in implementing best management practices, as well as support national agricultural development and marketing strategies. More work also needs to be done to assess economic impacts from the agricultural sector on the larger economy.
8.1. Introduction
Agriculture is expected to suffer severely from the im-pacts of climate change.1 Precipitation, temperature, weather extremes, and evaporation rates all have significant impacts on production and agricultural production impacts economic development, food security, and Croatia’s development. Impacts in this sector particularly affect vulnerable groups who use agriculture as a means of subsistence and for income generation. Agricultural production also affects food prices, which impacts the entire economy. This chap-ter discusses the importance of agriculture for human development and the current and potential future impacts from climate variability and climate change. It then evaluates the potential for adaptation, includ-ing “no regrets” and “low regrets” measures and makes recommendations for the further analysis of potential adaptation measures within the agricultural sector.
8.2. The role of agriculture in
Croatia
Agriculture has been Croatia’s backbone for millen-nia.2 In the 20th century Croatian agriculture endured three wars, which destroyed farms and rural commu-nities.3 During the war from 1991 to 1995, a third of the livestock was destroyed and a quarter of the agri-cultural machinery.4 More than 200,000 farmers were displaced and became consumers rather than agricul-tural producers.5 Nearly a third of agricultural land re-mained inaccessible for cultivation due to minefields.6 About 1.7% of the utilised agricultural area (UAA) still contains mines.7 The farming sector has not fully re-covered and the volume of agricultural production over the period 2000-2004 was about 15% lower than 1986-1990.8
The structure of the Croatian population has changed drastically in recent decades. Rapidly developing in-dustry has required a large labour force. Most people were recruited from rural areas. Independent farmers
became industrial workers. Over time, many rural ar-eas became depopulated. Land remained abandoned and returned to shrubs and forest.9 As policy measures in recent decades have not favoured the development of private farming,10 mostly less educated, poorer, and older farmers have remained. Over time, society has developed a negative attitude towards farmers and farming that is still prevalent today.11
8.2.1. Family farms and agricultural companies
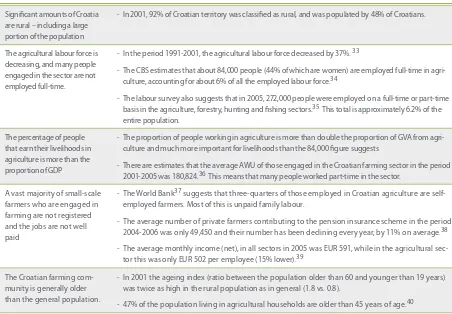
[image:3.609.289.511.125.311.2]Croatia has two parallel production systems: family farms and private agricultural companies. While fam-ily farms form the core of Croatian agriculture, private companies, which have mostly evolved from former state-owned enterprises, are much larger in terms of land-use (Figure 8-2). This farm-size structure is the re-sult of past communist agrarian reforms and continu-ing inheritance laws that allow for the division of farms between heirs, even if the farms become unviable.12 While family farms are very important to Croatian ag-riculture, there is a vast discrepancy in the distribution of land, which favours larger agricultural companies. This is not a particularly new or unique phenomenon, as large farms are generally more efficient. However, small farms are, relatively speaking, much greater generators of employment and economic value. Figure 8-1: Dried out corn field in the middle of a drought in Požega.
Source: Borislav Trninić.
No. of agricultural holdings No. of utilised hectares
<1 ha 1-2 ha 2-3 ha 3-5 ha 5-10 ha
10-20 ha >20 ha
51%
0,1%
16%
11%
9%
6%
10%
11%
9%
20%
4%
15%
1%
37%
Size of agricultural holdings 275,000
250,000 225,000 200,000 175,000 150,000 125,000 100,000 75,000 50,000 25,000 0
Number
Figure 8-2: Distribution of utilised agricultural land and the number of agricultural households and companies according to size.
Many people still live on agricultural land. In 2003 every third Croatian lived in an agricultural house-hold.13 Thus, the majority of agricultural house-holds are not viable commercial enterprises. They are outside of the administrative, bookkeeping,
fis-cal, and inspection systems. They are subsistence, non-market-oriented farms, producing for self-consumption. Their owners usually earn their living working in other sectors but use the homesteads as places to live. In a number of cases, people without sufficient pensions or other income use small-scale farms to survive.14 Contrary to most family farms, the industrial agricultural actors have access to capital and are geared towards industrial, high ex-ternal-input farming aimed at maximising yields.15 Agricultural subsidies are very unequally distribut-ed among farmers and benefits go primarily to the big producers.
8.2.2. Economic importance of agriculture
Agriculture is very important to the economy of Croa-tia due to its basic value, as well as its impact on food security, vulnerable populations, and the number of people it employs (which is far more than its econom-ic output would suggest). Some recent calculations question the validity of the official figures of annual GVA from agriculture, suggesting that it is significantly lower – see Table 8-2 for more.
I The AWU is defined as full-time equivalent employment (corresponding to the number of full-time equivalent jobs), i.e. as total hours worked divided by the average annual number of hours worked in full-time jobs. In the European context a working week is considered to be the equivalent of 40 hours (EC 2007).
II GVA is slightly different than Gross Domestic Product (GDP). National GDP takes into account some taxes and subsidies, which are impos-sible to obtain at the sectoral level in Croatia. GVA is therefore a close approximation of GDP.
Source: Znaor 2008.
There is a large difference in farm sizes
- The average size of family farms is 1.9 hectares, while the average size of the land used by the agricultural
compa-nies is 152 hectares.16 51% of agricultural holdings are less than one hectare in size.
- 52% of the UAA is made up of 5% of holdings larger than 10 hectares
Small family farms are very important
- Small-scale, family farms account for 82% of annual working units (AWU) I and create 54% of all gross value added
(GVA)II generated by farming and related upstream sectors (energy supply and distribution, trade, transport,
agri-chemical industry, veterinary, advisory, research, education and administrative services).
- Agricultural households account for 99.7% of the total number of agricultural holdings, occupy 80% of UAA, own
85% of all livestock and 98% of all tractors. 17
Subsidies, like land are distributed unequally
[image:4.609.100.324.232.454.2]- For example, the top 5% of milk producers receive 41% of all subsidies paid for milk production. 18
The GVA produced by people not included in the mainstream economic and administrative systems still adds value to the economy but is not counted in national statistics. Their products are mainly for their own and (extended) family consumption, are bartered or sold directly on farms or at farmers’ markets for cash, without receipts or VAT charges. These farmers are not obliged to practise bookkeeping or pay income tax. More than 90% of agricultural holdings inscribed in the Farm Register do not practise any bookkeeping and their economic size is unknown.19 This means that a fairly large amount of agricultural production is not being accounted for. Additionally, the agriculture sec-tor is important for the balance of trade and food self-sufficiency. Since independence in 1991, Croatia has been facing an increasing agricultural negative trade balance.
8.2.3. Role of agriculture related to employment and vulnerable people
A significant amount of the Croatian population lives in rural areas. Generally, rural households are more vulnerable in a variety of ways, which tend to be char-acterised by poorer access to basic infrastructure, such as roads, connections to the public water supply, pub-lic sewage systems, telephones and central heating systems. They also have poorer housing conditions (electricity, water supply, sewage systems, central heating, kitchens, toilets and bathing facilities in the house) than households in urban areas.29
The agricultural labour force is decreasing and many people engaged in the sector are not employed full-time. However it is unclear what percentage of the part-time workers’ income comes from agricultural
III Although this may appear very unlikely, these figures are probably more reliable than those of the CBS, which calculates farming GVA using 3.13 million hectares (instead of the 1.2 million hectares actually in use). The CBS suggests that on the per hectare basis Croatia generates some 20% higher GVA than the EU-15 or 40% higher than the EU-25. Taking into account the overall structure and development of the Croatian agriculture sec-tor this is very unlikely. The CBS also applies a flat rate for the costs of production – extrapolated from a survey of 25 years ago. This means that each year they assume a fixed percentage of the cost of the crops to be the production cost, of regardless the actual cost of production for farmers. IV One ESU is equal to EUR 1,200 of standard gross margin.
While GVA and GDP from agriculture are important, it is not clear how much they contribute to the Croatian economy
- The GVA of the agricultural sector in the period 2000-2005 increased from EUR 1.50 to 1.76 billion per year, yet its
share in total GDP decreased from 7.4% to 5.8%. 20
- Some recent calculations question the validity of the official figures of annual GVA from agriculture, suggesting
instead an annual GVA of EUR 395 million during 2000-2003,21 EUR 623 million in 200522 and EUR 626 million
dur-ing 2001-2005.23
- If these estimates are correct, farming makes up just 2.5% of GDP instead of the 5-7% reported by the Central
Bureau of Statistics (CBS). III
Much of the value of farms is not captured by official statistics
- In 2007, 176,027 agricultural households were registered. 24 However, the number of commercially viable farms
was about 50% lower and in the same year only about 86,000 farms received production subsidies. 25
- There are estimates that nearly 60% of holdings that are commercially oriented have gross margins below EUR 7200
per year.IV
Direct payments/ subsidies are quite large and compa-rable to EU levels
- The share of direct payments (subsidies) from the Government in the total gross output is very similar in Croatia (37%) and in the EU-27 (38%).
- In 2005 Croatian farmers received just 6% less in direct payments per hectare than their colleagues in the EU-15
(EUR 238 vs. EUR 253).26
Croatia’s food self-sufficiency has been decreasing over time.
- In the period 2000-2005, Croatia was self-sufficient in only five products: wheat, maize, eggs, poultry, meat
and wine. 27
- In the period 2001-2005, imports of agricultural goods increased from EUR 287 million to EUR 377 million (an equivalent of EUR 85 per capita). For the same period, agricultural exports decreased from EUR 70 million to
EUR 57 million.28
[image:5.609.50.510.374.668.2]- In the period 2001-2005 the deficit increased dramatically from EUR -217 million to EUR -320 million.
Table 8-2: Economic importance of agriculture in Croatia
activities. This is due to the structure of employment within the agricultural sector – with many workers ac-tually being unpaid family labour. A vast majority of small-scale farmers, engaged in farming, are not reg-istered with the Labour Office or the Revenue Office. Agricultural jobs do not pay well and, therefore, these farmers are exempt from paying pension insurance or income taxes.
The Croatian farming community is generally older than the general population. Since younger rural in-habitants regard farming as a labour-intensive and unprofitable business and tend to work elsewhere, the ageing process of the agricultural population is accelerating.30
As noted earlier, two-thirds of agricultural households have less than 2 hectares. It is very likely that most of these households practise subsistence farming and that agriculture forms the backbone of their survival
strategy.31 However, the exact number of smallhold-ings personally consuming more than half of their fi-nal production is unknown.
Agriculture is also a survival strategy for many urban people who go to the countryside over the weekends to help or farm on their own and return to the city with free or cheap food. 32
This analysis shows that, while agriculture in Croatia constitutes a significant part of GDP, its importance to the economy and to food security is more than just that of a component of GDP, especially in rural areas and among vulnerable populations. Industrial farm-ing is also important to Croatia, though perhaps more because of the impact on national food security and the balance of trade than for employment. However, popu-lation migration away from rural areas and shifts in the employment structure will probably mean that fewer people are dependent on agriculture in the future.
Significant amounts of Croatia are rural – including a large portion of the population
- In 2001, 92% of Croatian territory was classified as rural, and was populated by 48% of Croatians.
The agricultural labour force is decreasing, and many people engaged in the sector are not employed full-time.
- In the period 1991-2001, the agricultural labour force decreased by 37%. 33
- The CBS estimates that about 84,000 people (44% of which are women) are employed full-time in
agri-culture, accounting for about 6% of all the employed labour force.34
- The labour survey also suggests that in 2005, 272,000 people were employed on a full-time or part-time
basis in the agriculture, forestry, hunting and fishing sectors.35 This total is approximately 6.2% of the
entire population.
The percentage of people that earn their livelihoods in agriculture is more than the proportion of GDP
- The proportion of people working in agriculture is more than double the proportion of GVA from agri-culture and much more important for livelihoods than the 84,000 figure suggests
- There are estimates that the average AWU of those engaged in the Croatian farming sector in the period
2001-2005 was 180,824.36 This means that many people worked part-time in the sector.
A vast majority of small-scale farmers who are engaged in farming are not registered and the jobs are not well paid
- The World Bank37 suggests that three-quarters of those employed in Croatian agriculture are
self-employed farmers. Most of this is unpaid family labour.
- The average number of private farmers contributing to the pension insurance scheme in the period
2004-2006 was only 49,450 and their number has been declining every year, by 11% on average.38
- The average monthly income (net), in all sectors in 2005 was EUR 591, while in the agricultural
sec-tor this was only EUR 502 per employee (15% lower).39
The Croatian farming com-munity is generally older than the general population.
- In 2001 the ageing index (ratio between the population older than 60 and younger than 19 years) was twice as high in the rural population as in general (1.8 vs. 0.8).
[image:6.609.100.552.399.713.2]- 47% of the population living in agricultural households are older than 45 years of age.40
Table 8-3: Characteristics of the agricultural labour force While agriculture
8.3. The impact of existing
climate variability and extreme
weather on the Croatian
agricultural sector
[image:7.609.46.507.340.472.2]Climate variability impacts and weather-related disasters appear to be occurring more frequently throughout the world and in Croatia. This variability has already had significant impacts on agriculture and the well-being of the rural population. A 2006 European study41 analysing changes in natural an-nual events, such as the flowering of plants, suggests that changes in climate are affecting the seasons. In
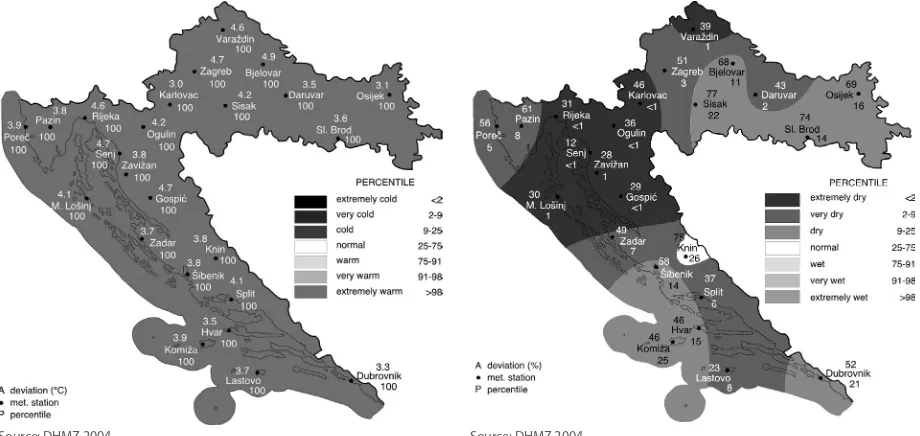
Figure 8-3: Summer 2003 - the mean seasonal air
temperature deviation (°C) from the corresponding average values for the period 1961-1990.
Figure 8-4: Seasonal precipitation quantities for summer 2003, expressed as a percentage of the average values for the period 1961-1990.
The shortage of water in agri-culture is growing
- In the period 1994-2003, Croatian agricultural soils exhibited a much higher shortage of water than in the larger period 1961-2003.
- In 1994-2003 the average annual water deficit was 57 litres per square metre, 19% higher than in
1961-2003. This has been attributed to changes in climate.46
The frequency of drought ap-pears to be increasing
- During the period 1970-1992, droughts occurred 40% more frequently after 1981.47
- The frequency of drought occurrence has increased over the last 20 years throughout Croatia. From
1982 to 1992, there were 55 drought periods, 29 of which affected all five geographic regions.48
Heat stress on crops is a problem
- Frequent air temperatures above the 25°C threshold (above which crops suffer from heat stress) have become a problem in some parts of Croatia over the last 20-30 years.
Table 8-4: Problems related to water availability and heat in agriculture
the future, agricultural yields could drop sharply as tem-peratures rise and water becomes scarcer, resulting in yield losses of 10-30%, notably in Southern Europe.42
8.3.1. Droughts and heat waves
The period 1991-2000 was the warmest decade of the 20th century in Croatia.43 The annual minimum daily temperature is rising. This process is more advanced along the coast than inland.44 Summers have become steadily warmer in the last ten years.45 The number of cold days and nights is diminishing, while there are more warm days and nights. In the 20th century,
[image:7.609.52.512.529.747.2]annual precipitation dropped throughout the coun-try, with the reduction being more pronounced in the northern Adriatic, on the Dalmatian islands and in eastern Slavonia.49 A decreasing trend of average annual cloudiness has also been identified through-out Croatia. Average annual precipitation is decreas-ing, especially along the coast. The northern Adriatic, Northwest Croatia, and the bread-basket region of Eastern Croatia are becoming increasingly dry.50 As a result, the need for water is growing in Croatian ag-riculture. Similarly, due to high temperatures and the risk of summer drought, agriculture in the mid-Adriat-ic coast and islands indmid-Adriat-icates the highest vulnerability to climate variability.51
Severe droughts inflicted severe damage on Croatian agriculture in 2000, 2003 and 2007 (See Table 8-5).
8.3.2. Additional damage from weather events
In addition to droughts, during 2000-2008, agriculture suffered from hail-storms, exceptionally strong winds, frosts, heavy rains and flooding.60 The hail-storms that hit some parts of Croatia (particularly on the Adriatic coastline) in 2001 destroyed large areas of grapevines and other crops.61 In the same year, summer frosts damaged/destroyed crops in several parts of North-ern Croatia and Istria.62 However, 2002 did not suffer many extreme weather conditions, although some parts of Croatia were affected by frost, causing dam-age to some crops, notably fruit.63
In 2004, a severe bora wind (north wind) blew along the entire Adriatic coast on November 14 and 15, kill-ing 2 people, injurkill-ing over 50 and causkill-ing substantial
2000 - Extremely hot and dry, with some regions going without rain for around 40 days. The last time the same intensity of drought
occurred was in 1893.
- The mean annual temperature in 2000 in Zagreb was the highest since the beginning of systematic recording in Croatia
in 1861. 52
- Fifteen out of 20 counties declared a state of natural disaster due to the combined effects of drought and wildfires.
- Some of the most important agricultural areas, such as Vukovar, received only 3-10 litres of precipitation per square metre in the
period April-August, which was far below the requirements for the normal growth of crops.53
- Agricultural production was reduced by up to 30%. In some cases, crops were almost completely destroyed.
2003 - Croatia and several other areas in Europe were gripped by a heat wave and the worst drought in 50 years.54
- The heat wave began in March and lasted over three months, causing severe damage to agriculture.
- Due to high temperatures and low precipitation, the entire country was classified as ‘extremely warm’ (Figure 8 3).
- With the exception of the Knin region, dry weather prevailed throughout Croatia (Figure 8 4).
- By the beginning of June, the main agro-meteorological station in Križevci found that the field moisture capacity of the soil was
already 27 litres per square metre short at a depth of 10 cm, 77 litres at 30 cm and 170 litres at 60 cm.55
- The soil was not only dry but it was also extremely warm – up to 45°C in Osijek, resulting in all plant crops experiencing a temperature shock. This situation affected the fertile region of eastern Croatia the hardest, where precipitation amounts reached barely 30% of the 30-year average.
- Crop yields were diminished by 30% on average, with some crops, such as sugar beet, suffering a 50% reduction.56
- In May 2003, a state of natural disaster was declared in 10 counties in eastern and northern Croatia and the Government formed
a crisis group headed by the Prime Minister.57 By the end of the growing season, 19 out of 21 counties had proclaimed a state
of natural disaster.58
[image:8.609.103.556.370.690.2]2007 - Croatian agriculture was again struck by a severe summer drought, causing shortages of both grain and corn.59
damage to infrastructure, buildings, and agriculture. Many olive trees were uprooted, while the sea salt left on vegetation caused damage to sheep farming on the northern Adriatic islands.64 Again in 2007, hail damaged or destroyed crops in several regions.65 The following year, in June, July and August, exceptionally strong hail hit northern Croatia, causing severe dam-age to maize and vineyards.66 A state of natural disas-ter was declared in several municipalities.
Figure 8-6: Share of extreme weather conditions in damage claims.
the damage caused by existing climate conditions and climate variability already has a substantial impact on agriculture in Croatia. This may or may not be due to climate change, but it certainly points towards current vulnerability.
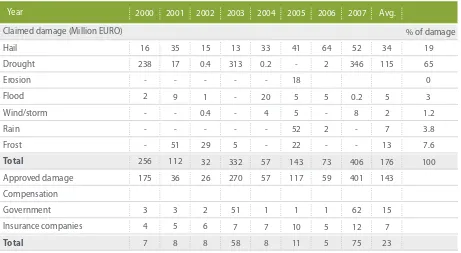
In the period from 1980-2002, natural disasters caused approximately EUR 5 billion in damage in Croatia (aver-age EUR 217 million per year). Some 73% of this dam-age was due to weather. The damdam-age from drought, frost and hail – extreme weather conditions causing damages predominantly in agriculture – is estimated at EUR 3.5 billion for the period 1980-2002, which is the equivalent of EUR 152 million per year.68 Drought has caused the most damage, followed by hail, frost, rain, floods and wind/ storms (Figure 8-6).
V Assuming that the GVA figure of about 626 MEUR as estimated by the Economic Institute (2007) and Znaor (2008) is more accurate, this damage would be equal to some 28% of the GVA created by agriculture.
Figure 8-5: “The Harvest of 2008” - exceptionally large hail-stones size of an egg on August 8, 2008 in Zagreb.
Source: Ana Pisak.
Source: Znaor, after MF 2008
8.3.3. Existing economic damage from current climate variability
All of these natural disasters and climate variability events have resulted in economic damage. During 2000-2007, Croatian counties claimed EUR 1.4 billion in crop damage caused by extreme weather condi-tions.67 This figure is equivalent to an average of EUR 176 million per year, representing approximately 0.6% of GDP or almost one tenth of the GVA generated by the agriculture, forestry and fisheries sector. This dam-age surpasses, by 25%, the value of the averdam-age an-nual direct payments (subsidies) for the same period, paid to farmers by the Ministry of Agriculture, Fishery and Rural Development by (see Figure 8-7). Therefore,
Wind/storm 1% Flood
3% Rain4%
Frost 8%
[image:9.609.52.273.278.432.2]The Government has attempted to relieve some of the risks and damages associated with climate vari-ability. Subsequent to the Act on the Protection from Natural Disasters, the Government approved dam-age payments of EUR 1.1 billion (78% of all claimed damages). However, due to a shortfall in funds, only EUR 124 million (11% of approved damage) was ac-tually paid out. The most significant payment was in 2007, when EUR 62 million was paid to compensate grain farmers and cattle breeders adversely affected
by the drought. In 2003, the Ministry of Agriculture and Fisheries (MAF - the name of the ministry at that time) also granted a one-year grace period on MAF loans to 1,030 farmers who suffered damage from the 2003 drought.69 During 2000-2007 farmers with insurance policies received EUR 57 million (on aver-age EUR 7 million per year) from insurance compa-nies (See Figure 8-7 and Table 8-6). However, gener-ally speaking, insurance companies will not insure farmers against drought.
0 50 100 150 200 250 300 350 400 450
2000 2001 2002 2003 2004 2005 2006 2007 avg.
M
[image:10.609.100.561.122.375.2]illion EUR
Figure 8-7: Claimed, approved and compensated damage to the agricultural sector in the period 2000-2007.
[image:10.609.106.557.590.736.2]Damage compensation (insurance companies) Damage compensation (Government) Approved damage Claimed damage Table 8-6: Claimed, approved and compensated damage to the agricultural sector in the period 2000-2007.
Claimed damage (Million EURO) Hail Drought Erosion Flood Wind/storm Rain Frost Total Approved damage Compensation Government Insurance companies Total 16 238 -2 -256 175 3 4 7 35 17 -9 -51 112 36 3 5 8 15 0.4 -1 0.4 -29 32 26 2 6 8 13 313 -5 332 270 51 7 58 33 0.2 -20 4 -57 57 1 7 8 41 -18 5 5 52 22 143 117 1 10 11 64 2 5 -2 -73 59 1 5 5 19 65 0 3 1.2 3.8 7.6 100 52 346 0.2 8 -406 401 62 12 75 34 115 5 2 7 13 176 143 15 7 23
% of damage
Year 2000 2001 2002 2003 2004 2005 2006 2007 Avg.
Source: after MF 2008 and Hanfa 2008.
The 2007 drought also caused economic damages reaching beyond the agriculture sector. Shortages of both grain and corn resulted in increased food prices. Retail prices of milk, bread, eggs, and meat all rose fol-lowing the Government’s announcement that there was just enough wheat to meet domestic demand and there was a corn deficit of up to 300,000 metric tonnes.70 To try to stabilise the local market, the Gov-ernment imposed a tariff of EUR 108 per tonne on corn exports.71
8.3.4. Potential impacts of future climate change on agriculture in Croatia
While current damages due to climate variability are estimated at 0.6% of GDP, or 9.3% of the GVA gener-ated by the agriculture, forestry and fisheries sector, the scale of damages could get worse in the future. Climate models predict a further decrease in precipita-tion, and the Government expects that climate change will cause crops in Croatia to suffer from water short-ages, notably in the fertile region of Slavonia. 72 Most climate change models predict an increase of drier summers and extreme heat waves and droughts. For this reason, an increase in the frequency of extreme weather events may be the most serious potential im-pact on agriculture from climate change. However, in addition to the frequency of extreme weather events, there may also be an impact from the change in the average temperatures, the average precipitation rates, and overall changes in climate.
The potential impact of changes in the averages of climate variables (long-term climate change) on the
Croatian agricultural sector is largely unknown. The forecast for climate change in Croatia is not optimistic, and negative climate trends are predicted to worsen.73 As discussed in Chapter 3, the various climate change scenarios for Croatia envisage significant temperature increases, regardless of the season, as well as decreas-es in precipitation.
The First, and then the Second, Third and Fourth (com-bined) National Communications of the Republic of Croatia to the UNFCCC detailed significant expected climate change impacts on agriculture (See Box 8-1) – some beneficial, others not. However, much more information and analysis will be necessary in order to actually transform these generalized statements into predictions about specific crops, the economic im-pacts of climate change, and to identify actions that will lead to adaptation.
Except for a series of closely-related studies,74 the im-pacts of climate change on crop yields have not been quantified in Croatia. This work focused on the effects of climate change on maize development and yield in the central part of Croatia. The results of these stud-ies correspond quite closely with those obtained for western Hungary.75 This sort of research is necessary to better understand the relationship between cli-mate and agriculture (See Box 8-2 for more informa-tion). The results showed:
A shorter growing season (30-36 days in 2050 and 34-44 days in 2100);
A reduction in grain production (3-8% in 2050 and 8-15% in 2100); and
No significant difference in the yield of biomass (range between -2% and +2%).
Box 8-1: Expected impacts from climate change according to the National Communications to the UNFCCC
Regarding the potential impact of climate change on the Croatian agricultural sector, the First Nation-al Communication of the Republic of Croatia to the UNFCCC concludes the following:76
1. Soil moisture during summer months in low-land Croatia (the most fertile and most im-portant agricultural region) is expected to de-crease by 30-60%.
2. The annual number of days with temperatures exceeding 10ºC is expected to increase to 25-40 or 55-90 days.
3. The mountainous areas, which at present do not face water shortages, are expected to ex-perience shortages during August.
3. The vegetation period is expected to extend by 25 to 45 days.
5. The coastal region of Croatia is expected to have a decrease in soil moisture by 25-56%.
6. It will probably be possible to plant/seed spring crops earlier, and, depending on the water quantities available for irrigation, the growing season will be prolonged.
In the more recent document, the Second, Third and Fourth National Communication of the Repub-lic of Croatia to the UNFCCC77, climate change is ex-pected to:
1. Have a positive impact on yields and crop qual-ity (notably winter crops) due to the extended vegetation period. The overall number of active vegetation days (temperature above 5°C) will increase by 35-84 days in the lowlands of Croa-tia and the period with temperatures above 20°C will be prolonged by 45-73 days.VI
2. Endanger spring crops because of high tem-peratures and water shortages during sum-mer months.
3. Expand the area suitable for fruit and vine growing due to the disappearance of very cold winters and late spring frosts. This will particularly benefit southern Croatia, where it will probably be possible to grow more types of Mediterranean fruit.
4. Result in unfavourable conditions for pests, resulting in a significant reduction in pesticide use. A warmer and drier climate is expected to reduce the outbreaks of natural infections by mycoses that depend on frequent precipita-tion and high air humidity.
5. Result in more cost-effective production due to temperature rise, assuming that irrigation will be practised.
6. Lower yields and quality of pasture, forage crops and cereals.
7. Cause salinisation in coastal areas and im-poverish pastures due to high-intensity rain-fall and stronger winds in the coastal area. This is expected to have an adverse effect on milk production and the growth of small ru-minants. Also strong winds (bora), lasting for several days, in the Dinarides may kill weaker and undernourished sheep, goats and their young (already frequently happening during gale-force winds blowing at 80 km/h).
8. Accelerate the multiplication of various patho-genic micro-organisms and parasites hazard-ous to livestock.
While these studies are important, they need to be supplemented by a much larger effort. The focus of these studies was on a single crop in a single region. This work needs to be extended to include more com-mercially-important crops and to cover more regions in Croatia.VII
VII There are technical limitations to these studies. For example, they
did not take into account direct effects of atmospheric CO2 on crop
yields. Also, instead of using composite climate scenarios, taken di-rectly from global climate models, the data need to be downscaled to a smaller geographic grid. Finally, instead of using composite
climate scenarios, the effects of climate change and higher CO2
concentrations on crop yields need to be investigated for various IPCC scenarios.
Box 8-2: Modelling the potential impact of climate change on crop production – how to start.
“I began my research into crop models 15 years ago on my own initiative for my PhD dissertation. Analysing agricultural systems and modelling the potential impact of climate change on crop produc-tion is a very important topic, particularly now as food supplies are becoming scarcer in many parts of the world. My crop-modelling research activity was very slow and I had to take great efforts in learning everything myself in my free time. To my knowledge I am the only one in Croatia who has applied climate change to any crop-model. Corresponding with emi-nent experts from the USA, Slovenia and Hungary I was sent papers, books and the Decision Support System for Agrotechnology Transfer (DSSAT) soft-ware which helps analyse the effects of weather on agricultural systems.
In 1999 I carried out field maize experiments at the Faculty of Agriculture of the Zagreb University and simulated the yields using the Zagreb historical data (1949-2004). Then I stopped because I did not have the weather generator and climate change scenarios and could not analyse projections for the end of 21st centu-ry. Having waited for five years, in August 2005, I partici-pated in the AGRIDEMA workshop Introducing tools for agricultural decision-making under climate change con-ditions by connecting users and tool-providers which was held in Vienna. With the help of the project, I carried out the Pilot Assessment Modelling of maize production and the impact of climate change on maize yields in Croatia.
The AGRIDEMA project was very useful because it con-nected providers and users. After publishing the results of the Pilot Assessment, the State Hydro-Meteorologi-cal Service improved its resources available by
procur-ing an updated version of the DSSAT software. Present-ly I am participating in the Croatian Ministry of Science project Climate variations and change and response in affected systems and I am a delegate in the Commis-sion for Agricultural Meteorology of World Meteoro-logical Service and in the Management Committee of the European Cooperation in the field of Scientific and Technical research (COST) Action 734 Impact of Climate Change and Variability on European Agriculture. I am also participating in the COST Action 725, which aims to establish a European phenological database – a da-tabase describing the relationship between climate and biological phenomena.
There are not many agrometeorologists in the world and only 1.5 in Croatia – my husband Marko Vučetić who deals with protection from forest fires and “half of me” because agrometeorology is my “hobby”. I really would like for agrometeorology to become a main topic of my research in my Service. I am eager to learn the new version of DSSAT model in the up-coming year. While the research is difficult and com-plicated, it will be necessary for ensuring that we un-derstand the risks that climate change poses to the food supply in Croatia.”
Predicting crop yields in the future is only one step. Crop yield results78 were used for an economic analysis which estimated the potential loss of revenue from the production and sale of maize due to climate change, taking the year 2005 as the baseline for maize yields, area harvested and prices. In 2005 grain maize was by far the most economically important single crop with 59% of arable land (318,973 hectares) and 39% of the total harvested area growing maize. Croatia produced 2,207 kilo tonnes of maize grains in 2005.79 When mul-tiplied by the average annual producer price80 the rea-lised revenue from maize sales was EUR 199 million, representing 20% of the total crop production output.
If climate change reduces maize yields, as described in the crop models above,VIII the lost revenue would be EUR 6-16 million in 2050 and EUR 31 – 43 million in 2100 (2005 EUR value) (Figure 8-8). This corresponds to 0.8-5.7% of the entire revenue from the sale of ar-able crops in Croatia in 2005.81 This estimate does not take into account any change in production costs due to climate change, nor does it take into account ad-justments that farmers might make to their crop mix-es, or changes in the market price of maize due to the effects of climate change on the production, exports and imports of maize and other crops in the rest of the world and Croatia.
If the reductions in maize production are similar for other crops, the possibility of lost revenue and lost food sources is significant – perhaps 4-20% of all ag-ricultural economic production. While this is a large conjecture, it indicates that there is risk associated with a change in mean temperatures and precipita-tion levels associated with climate change that should be examined further.
8.3.5. Combined impact of climate on agriculture
As shown above, existing climate variability has al-ready had a significant impact on agriculture. Extreme weather events have resulted in average losses of EUR 176 million per year from 2000-2007, represent-ing 0.6% of national GDP, or 9.3% of GVA generated by the agricultural forestry and fisheries sectors. More research would be necessary to determine whether this amount is greater than damage from extreme weather prior to 2000.
Crop Year Area(ha)
Yield
(tonnes per hectare) Yield(kt) Price per kg (2005 EUR)
Revenue from sale
(MEUR) Difference from 2005 (MEUR) min max avg. min max avg. min max avg. min max avg.
Grain maize 2005 318,973 6.9 6.9 6.9 2,207 2,207 2,207 0.09 199 199 199 0 0 0
Grain maize 2050 318,973 6.4 6.7 6.5 2,031 2,141 2,086 0.09 183 193 188 16 6 11
[image:14.609.109.364.343.632.2]Grain maize 2100 318,973 5.4 5.9 5.6 1,726 1,868 1,797 0.09 155 168 162 43 31 37
[image:14.609.101.559.657.748.2]Table 8-7: Revenue from maize sale obtained in 2005 and projected for 2050 and 2100. Figure 8-8: Revenue from maize sales obtained in 2005
and projected for 2050 and 2100
2050
2100 100
110 120 130 140 150 160 170 180 190 200 210
Minimum
revenue 2005
Average Maximum
M
illion EUR
lost r
ev
enue
If the reductions in maize production are similar for other crops, the possibility of lost revenue and lost food sources is significant
Furthermore, looking at the future effects on maize alone, lost revenue would be EUR 6-16 million in 2050 and EUR 31-43 million in 2100 (using a 2005 EUR value – see Figure 8-8). This corresponds to 0.8-5.7% of rev-enue from arable crop sales in Croatia in 2005. In hu-man development terms, this translates to increasing vulnerability among rural populations, which are al-ready among the most vulnerable. In order to address the risks posed by climate in rural areas, action must be taken to reduce vulnerability to current climate shocks and future climate change.
8.4. Addressing climate
variability / climate change in the
agricultural sector
The previous section highlighted the current impacts of climate variability/ climate change and some of the potential physical and economic impacts of future cli-mate change on agriculture in Croatia. In general, Cro-atia lacks the information to quantify the full extent of these physical impacts and to value them. However, it is apparent from looking at current climate impacts and likely future impacts to maize that agriculture is vulnerable to climate change.
However, there are a variety of measures that can help agriculture adapt. These measures can be applied to both climate variability and climate change and can be divided into three basic groups (see Table 8-8):
1. Actions that build adaptive capacities;
2. Field adaptive (technical) actions; and
3. Autonomous or unassisted adaptation.
The rest of this chapter analyses some of the adap-tive capacity of the Croatian agricultural sector, such as: the information currently available to stakeholders which can help them incorporate climate into deci-sion-making; the current resources available for ad-aptation – including institutions involved; and some of the potential adaptation options that are available, including “no regrets” measures.
8.4.1. Information availability for decision-makers to assess vulnerability and adapt to climate conditions and climate change
In order to adapt to climate change and variability, both the private and public sectors need information that will help them to adjust better. This includes in-formation about the impacts of climate on agriculture,
Type of Adaptation Characteristics Examples
Building adaptive capacity
Creating the information and conditions (regula-tory, institutional, and managerial) that enable adaptation actions to be taken.
- Climate change impacts research funded by agriculture advisory services.
- Awareness-raising among farmers.
- Genetic resources for breeding programmes. - Policy support tools.
Taking adaptive action Taking actions that will help reduce vulnerability to
climate risks or exploit opportunities.
- Creating water collection and storage facilities on farms for use in irrigation.
- Introducing new crop varieties. - Diversification.
- Resource management tools and infrastructure.
Autonomous or unas-sisted adaptation
Adaptation that occurs naturally or arises not as a conscious response to changing climate.
- Natural responses of agricultural crops to seasonal changes (e.g. earlier springs). - Autonomous farming practices evolution
[image:15.609.52.512.518.744.2](e.g. treatments and sowing dates).
Table 8-8: Approaches to adaptation in the agricultural sector.
Extreme weather events have resulted in average losses of EUR 176 million per year from 2000-2007, representing 0.6% of national GDP, or 9.3% of GVA generated by the agricultural, forestry and fisheries sectors
adaptation options that can be used to avoid damag-es from thdamag-ese impacts and information about which adaptation options work “best” for avoiding damages, including the benefits and costs.82 For example, one study83 used physically-based and statistical crop yield models to estimate the impacts of climate change in the original 15 EU countries for five different IPCC climate change scenario-GCM model scenario com-binations. The results generally showed that, in both the short- and long-term, crop yields would reduce in Southern Europe, but increase in most of the rest of the Europe.
The study also used an economic modelIX to simulate the effects of these yield changes on GDP. This analysis showed decreases in GDP in all countries, for all five scenarios, ranging from -0.16% to -0.60% by 2080. It is important to note that this higher amount is equal to the average amount of damage that Croatia has already faced due to climate variability and extreme weather events since 2000.
Croatia was not included in the analysis of EU coun-tries, nor could it have been, as Croatia currently lacks the information necessary to undertake these exer-cises (See Table 8-9).
Improving the capacity to simulate the impacts of cli-mate change and higher CO2 concentrations on crop yields would involve the following steps (See Box 8-3 for more details):
- Improving the capability to downscale global climate model results to the regional and local-scales, compatible with existing models to trans-form climate into daily weather data,
- Selecting and calibrating appropriate crop yield simulation models for different crops, environ-mental and climatic conditions and management in Croatia, and
- Applying models to simulate the impacts of cli-mate change and elevated CO2 on the yields of commercially-important crops and introducing management options for avoiding these impacts.
Currently, the only institution involved in monitoring, collecting data, and conducting research about the impacts of climate change in the Croatian agricultural sector is the DHMZ. This organisation runs its own cli-mate change models, but these are general and not agriculture-specific. Only one person87 conducts re-search dealing with climate change and crop (maize) models, but this does not appear to be a programmatic decision of the DHMZ. The DHMZ also participates in the EU-funded research project COST 734 – involving 27 European countries and the World Meteorological Organisation – which evaluates the possible impacts
Information Needed Notes
Crop models required to assess the impacts of current climate variability, climate change and increased atmospheric concentrations
of CO2 on various crops,
pastureland and livestock, and methods to simulate the physical damages avoidable by adaptation options.
- A certain amount of information exists from the previously cited work on maize yields. 84
- Theoretical predictions are available on the potential impact of the climatic change on
Croatian crops, livestock and soils.85 However, these provide few Croatia-specific calculations
and information that goes beyond theoretical predictions and general warnings that climate change might soon affect Croatian agriculture.
- Several authors also report on the water retention capacity of Croatian soils and on the water
requirements of different crops.86 However, these calculations (often based on long-term
monitoring or experiments) are mostly used to justify the need for the expansion of the irriga-tion practice.
- Crop yield simulation models were originally developed to help farmers cope with climate vari-ability.
[image:16.609.101.548.549.747.2]- Developing the capability to calibrate and apply these models to Croatian climatic and envi-ronmental conditions represents a “no regrets” capacity-building approach that is useful for coping with the existing climate.
Table 8-9: Information needed to carry out adaptation assessments in agriculture
on agriculture, arising from climate change and vari-ability.88 The DHMZ Agro-meteorological Division also monitors and forecasts agriculture-relevant meteoro-logical data. It publishes a weekly bulletin, providing weather-related information for agricultural produc-ers. These include the meteorological data for the last 7 days, minimum and maximum temperatures, soil temperatures and a map with precipitation, sun inten-sity, forecasts, etc.89 The crop (maize) model described previously seems to be the only such model available for Croatia. No plans or concerted actions seem to ex-ist to incorporate the findings of this model or to initi-ate similar research for the purpose of striniti-ategic plan-ning and policy making.
Economic and management information
Simulating the effects of climate change on crops – even many crops at many locations – is far from the end of the story. Croatia also lacks the ability to simu-late how physical impacts will influence the manage-ment decisions of farmers. It lacks the ability to model the impact of these decisions on production costs, on income from the sale of agricultural products, on the prices of these markets, and on the imports and exports of agricultural commodities. Once a farmer recognises that the climate is changing, he/she also understands that it will affect the profitability of the many different crops he/she can grow. He/she also realises that he/she will have to sell the crop to a na-tional and/or internana-tional market where the effects of climate will influence the crop selection, management and production of many other farmers, not to men-tion the equilibrium market price for each crop and, ultimately, the farmer’s net income. This knowledge will motivate the farmer to think about which crops to plant and when/ how to manage them. Agricultural sector models (see Box 8-3 for more information) take these farmer-market interactions into consideration in both the climate variability and climate change con-text.90 However, Croatia lacks much of the information necessary to create such sector models, as well as the sector models themselves (See Table 8-10).
As with crop yield simulation models, developing ag-ricultural sector models also represents a “no regrets” approach to improving the agricultural modelling expertise of a national government. These types of models are already used in developed countries to assist policy makers in exploring a variety of policies related to the impact of climate variability, as well as supporting national agricultural development and marketing strategies in the context of modern market economies. In other words, developing this analytical capacity is a good idea, regardless of climate change, so that policies can be geared towards helping farm-ers improve their economic situation.
Improving the capacity to simulate the impacts of cli-mate change and higher CO2 concentrations on crop yields would involve the following steps:
- Developing a Croatian agricultural sector model with sufficient spatial detail to capture the effects of different environmental conditions on produc-tion decisions,
- Linking the model to a system of crop yield simu-lation models, to allow a large number of simula-tions without an undue amount of external data handling,
- Using this tool to assess the economic impacts of climate change, estimating the value of damages and the benefits and costs of avoiding these dam-ages by various, selected adaptation measures.
It is important to note that Croatian farmers are gen-erally poorly educated. Ninety-eight percent of those living in agricultural households rely on practical ex-perience and have no agricultural education. Only 0.3% attended an agricultural course, while 1.3% fin-ished secondary agricultural school and 0.4% finfin-ished agricultural college or university.91 This indicates that there is a fairly low level of academic knowledge among farmers that could present difficulties in terms of spreading knowledge on adaptation.
Information
Needed Notes
Information on input use, management, and crop yields – basically “farm budgets”
- The standard gross margins (SGM) for different commodities and regions have not been
estab-lished. 92
- The Faculty of Agriculture of the University of Zagreb does have some gross-margin (GM) calcu-lations but these are for selected, commercial holdings over 10 hectares, ten years old and thus
of limited relevance for today.93
- The GM for different crop and livestock production has also been calculated by the Croatian
Agricultural Extension Institute (CAEI).94 However, these are based on theoretical assumptions
of the potential results that could be achieved if farmers implemented good management practices, optimally applied agricultural inputs and if the yields obtained were as envisaged as the norm in agricultural textbooks.
- Croatian farmers tend not to implement best practices – generally obtaining lower yields than
the standard during 2001-2005.95
- In early 2008, the World Bank-financed project “Establishment of the Farm Accountancy Data Network (FADN)”, began to establish a better farm accounting system - first undertaking a sur-vey of the farms throughout Croatia.
- Within the framework of this project a trial survey will be carried out on a selected sample of farms and a typology of farms will be developed.
- A full survey is expected in line with EU methodology in 2010.
Reliable macro-economic data on the gross and net income from agriculture production. (i.e. GVA)
- The GVA for the agricultural sector alone is not available – it is combined with forestry and hunting under official statistics.
- Agricultural output seems to be derived from the non-existent agricultural land area of 3.15
million hectares and not calculated in accordance with the EC methodology.96
[image:18.609.100.550.120.731.2]- The GVA created by Croatian agriculture seems to be 50-65% lower than reported in official
figures.97
- If the CBS figures on the GVA were correct, this would mean that Croatian GVA per hectare basis
is 20% higher than the EU-15 or 40% higher than the EU-25,98 which is very unlikely.
- The GVA is very difficult to determine since more than 90% of agricultural holdings in the MA-FWM Farm Register do not practice any bookkeeping.
Agricultural sector models
- These simulate the impacts of climate change and elevated CO2 using yield results from crop
simulation models as inputs.
- They can also be further modified to include simulating the effects of climate change on the livestock sector and on the supply and demand for irrigation water.
- In addition, the sector models can be developed to include a wide range of farm policy options.
- They can simulate adaptation to climate change in two ways:
1. Adaptation that involves changes in management at the farm level; and
2. Adaptation that occurs normally because of farmer reactions to changes in product prices in the market.
Box 8-3: Description of models needed for addressing climate variability and climate change
To address the risks to agriculture from climate vari-ability and climate change, the effects of the physi-cal systems must be understood, as well as the sec-tor as a whole.
Models of the physical environment’s effects on crops:
Crop models are representations of how crops re-spond to certain characteristics of the physical system. Phenological-based simulation models are considered state-of-the-art in crop yield modelling related to climate change. These models, which relate to the timing of plant maturation, include CERES, EPIC and DSSAT, and they all help to analyse a number of row crops and are expanding to include additional crops. These models are readily available “off the shelf,” but they must be calibrated to local geo-physical and climatic conditions. In most cases, this applied work is supported by crop-specific, plot-level agronomic research and by larger field studies, which look more closely at issues such as disease and pest management.
These types of models are generally calibrated from plot data at a few locations. The calibrated model is used in a representative fashion to simulate yields over a number of other locations with the same characteristics as the plot locations. The models sim-ulate the effects of daily weather on the growth and yield of individual row crops. As such, they require daily observation of a number of meteorological variables, as well as information about the physical environment in which the crop is grown, related to soils, drainage, water uptake, other physical factors,
and “management.” This feature of the models re-quires the output of Global Climate Models (GCMs) to be downscaled spatially to local and regional scales. Then the data have to be transformed to the hourly level, using a weather generator. These types of models can also be used to simulate a number of different types of management practices related to the type, timing and quantity of inputs applied (water, fertilizer, harrowing, ploughing, etc.). The relevant output of these models is the physical yield of the crop that can be harvested in weight units.
Agricultural sector models:
8.4.2. Resource availability for adaptation and adaptation studies and the role of institutions and decision-making authorities
Following Croatian independence, the agricultural sector was almost completely “privatized” overnight. All the important monitoring, data collection and management activities conducted under the previous government were scrapped. The adoption of a new agricultural system of “governance”, in terms of infor-mation management, was further postponed by war in the early 1990s. The Government in general consid-ers the agricultural sector and rural development to be a priority for funding and for political action. Some of the programmes that support agriculture are out-lined below. There are significant budgetary resources available to address human development risks within agriculture.
The estimated total budget of the Ministry of Agricul-ture, Fisheries and Rural Development for 2008 was EUR 630 million, of which EUR 530 million (EUR 440 per hectare) was allocated to various forms of agricul-tural support, such as subsidies. This is a significant amount of resources considering the entire sector’s contribution to GDP is approximately EUR 1.76 billion. There are already some schemes in place to protect farmers from climate risk.
Aid scheme for insurance against possible damage to agricultural production99
A major current policy measure that relates to climate change adaptation is the Insurance Programme from Possible Damages in Agricultural Production.100 The programme was introduced in 2003 to motivate
farm-ers to insure production. Under the scheme, agricul-tural producers can receive aid from the Ministry of Agriculture, Forestry and Water Management towards the payment of insurance premiums. This aid is 25% of the cost of the total insurance premium (or a premium under collective insurance), regardless of the risk cov-ered by the insurance policy.101 However, no private insurance company in Croatia will provide insurance against drought.
The compensation for damage caused by natural di-sasters, as ensured by the Natural Disaster Protection Act102, can also be regarded as a policy measure which reduces the risk to farmers. It makes it possible for farmers to receive compensation for damages caused by drought, floods, frost and hail.103 Local and region-al authorities assess the cost of the damage caused by adverse weather conditions and then report the age to the national authorities. The requests for dam-age compensation payments are forwarded to the Ministry of Finance, which then makes the payments. However, this policy only addresses actual (past) dam-age and does not address climate change through adaptation or with forecasting damage. Furthermore, as evidenced by the lack of funds available in previous years during drought, the resources available for reim-bursing farmers are often not nearly enough. Finally, such schemes need to be looked at with caution. If they act as subsidies for certain practices, they can impede autonomous adaptation and could be unsustainable.
[image:20.609.100.559.647.740.2]While the Government has supported the agricultural sector following climate-related damage, the subject of adaptation to climate change within agriculture does not seem to be high on the agenda of policy-makers, researchers and other stakeholders. Consequently, there is hardly any on-going dialogue or cooperation
Table 8-11: Number of beneficiaries and total amount of aid to the agricultural sector due to damages.
Aid for insurance against damage
2004 2005 2006
Number of beneficiaries
Number of beneficiaries
Number of beneficiaries
5739 Apprx. 4141 4583
2 million
Apprx. 2.78 million
Apprx. 2.95 million Amount
(EUR)
Amount (EUR)
Amount (EUR)
between different ministries, Government agencies, research organisation and the business sector on the topic of climate change and agriculture. However, the national irrigation programme (which will be discussed in more detail below) has significant high-level Govern-ment support – though it does not explicitly address the threat of climate change. The programme is being supervised by a National Project Commission headed by the Prime Minister, with the Minister of Agriculture, Forestry and Water Management as its deputy. The Min-ister appointed an Expert Team that prepared a Project Strategy, which was adopted in November 2005.
Limited cooperation regarding climate change ex-plicitly has been in the form of the expert committees preparing inputs on climate change and agriculture for the agriculture chapter of the National Communi-cation of the Republic of Croatia under the UNFCCC. Ten experts from the Faculty of Agriculture of the Uni-versity of Zagreb and an expert from the Ministry of Agriculture contributed to the last report.104
Some initiatives do exist to address climate-related issues in agriculture. Croatia is a signatory of the UN Convention to Combat Desertification in Countries Ex-periencing Serious Drought and in 2002 the Govern-ment established the National Committee to Combat Desertification. This Committee has 14 members, rep-resentatives from the ministries, scientific institutions, NGOs and the business sector. There is also an Expert Working Group dealing with agriculture.
There are an increasing number of climate change-ori-ented projects financed by the Ministry of Science,105 but it is difficult to find evidence suggesting that these specifically cover the agriculture-related as-pects of climate change. Neither the MEPPPC, MAFRD, nor Environmental Protection and Energy Efficiency Fund finance research or education by demonstra-tion projects dealing specifically with agriculture and climate change. The Environmental Protection and Energy Efficiency Fund may be in a good position to
provide resources for adaptation studies. It is an extra-budgetary institution owned by the Republic of Croa-tia whose objective is to finance environmental pro-tection programmes and projects. In 2008 the Fund had EUR 182 million available for programmes. While climate change adaptation in agriculture is not spe-cifically mentioned in its current activities, it would be an interesting avenue for new programmes.
8.4.3. Analysis of available technological options for adaptation
In this section we discuss how farmers in Croatia might adapt to present climate variability and future climate change. Farmers adapt by taking measures to avoid damages and thus reduce their losses in net income. We expect that farmers will adapt to climate change because they already adapt to climate vari-ability. Regardless of the cause of climate variability, the principles of adjustment at the farm level are the same, although the actions taken to adjust to climate change and their outcomes may be different.
Autonomous adaptation constitutes just one part of adaptation to climate change. The public sector can also help farmers and households adapt, just as gov-ernments take action to help farmers and households adjust to the adverse impacts of climate variability. The involvement of the public sector as an agent of adap-tation can take place in at least five different ways:
1. Disaster risk planning and disaster risk manage-ment.
2. Longer-term Government programmes focused on maintaining or improving the nutritional or economic well-being of farmers and households. This includes schemes to make crop insurance available more cheaply and a variety of crop and
land subsidies. This is already underway in Croatia as outlined above.
3. Helping to finance large-scale investments in climate-sensitive infrastructure, such as irrigation water supplies, and non-climate sensitive infra-structure, such as transportation to improve mar-ket access.
4. Increase incentives which encourage farmers and households to adapt, by reducing the costs and/ or increasing the benefits of adapting. This can include encouraging the utilisation of better farm-ing techniques that can reduce vulnerability to climate-related risks.
5. Providing information about climate change that will help both the private and public sectors to ad-just more smoothly, with less risk at lower costs.
A great deal of the adaptation that will take place in Croatia will not involve new technologies. It will in-volve changing the way in which crop and pasture-land is managed, through changes in pasture-land use and crop mixes, substitution of inputs, changing the timing of management activities, etc. Some of these adapta-tions will simply be extensions of existing practices to cope with existing variability, but will also work well for adaptation to climate change. Many of these will be short-term measures. Some management changes may also involve changes in capital equipment or in-puts; e.g. new types of machinery/ equipment or new pesticides and herbicides. As such, these measures will have to be supported by investment planning and, farmers will have to be sure that the expected benefits of making these investments will be greater than their costs.
Finally, some adaptation measures in agriculture may involve substantial investments in infrastructure, for example: irrigation equipment, dykes, tiles and drain-age canals, which may have to be financed collectively or by the Government. In these cases, climate risk in-creases the costs of either over- or under-estimating these investments. This fact highlights the importance of having good information about climate in order to reduce the economic risks of making bad planning decisions about the state of the future climate.
Box 8-4: Differences in adapting to climate variability and climate change
There are two differences in adapting to climate variability and climate change. The first is that cli-mate change implies that the mean values for me-teorological variables, such as daily precipitation and temperature, are changing over time. The second is that climate change may involve fluctu-ations in meteorological variables that are outside their usual range in the existing climate record. In either (or both) case, the actions used to adapt to existing climate variability may not be enough for optimal adaptation to climate change.
In particular, entirely new adaptation actions may be required in the agricultural and other sectors. Some may have to be more forward-looking (long-term planning and investment to prevent damag-es). For example, having occasional droughts may be within the range of current climate variability, and, if so, farmers can do a better job of adapting to these droughts. But if droughts become more frequent or more intense, there may be no mech-anisms in place that would facilitate adaptation to such changes. Thus, proper adjustment to climate change will require better information on long-term climate changes, and projections will need to be downscaled both spatially and temporally to meet the needs of farmers.