This is the
Accepted Version
of a paper published in the
journal Springer Science Reviews:
Skocaj, Danielle M., Everingham, Yvette L., and Schroeder,
Bernard L. (2013)
Nitrogen management guidelines for
sugarcane production in Australia: can these be modified
for wet tropical conditions using seasonal climate
forecasting?
Springer Science Reviews, 1 (1). pp. 51-71.
http://dx.doi.org/10.1007/s40362-013-0004-9
1 2
Name of nominee: Danielle Skocaj
3
Nominee affiliation: James Cook University and BSES Limited 4
Nominee email address: dskocaj@bses.com.au
5
Name of supervisor: Dr Yvette Everingham
6
Supervisor affiliation: James Cook University 7
Supervisor email address: yvette.everingham@jcu.edu.au 8
Start date of PhD: 18 April 2011
9
Completion date of literature review: 13 July 2012 10
Review title: Nitrogen management guidelines for sugarcane production 11
in Australia – Can these be modified for wet tropical 12
conditions using seasonal climate forecasting? 13
Word count: 14, 053 (excluding bibliography)
Nitrogen Management Guidelines for Sugarcane Production in
1
Australia—Can These Be Modified for Wet Tropical Conditions
2
Using Seasonal Climate Forecasting?
3
Danielle M Skocaj 1,*, Yvette L Everingham 2 and Bernard L Schroeder 3
4
1
BSES Limited and James Cook University, PO Box 566 Tully, QLD, 4854, Australia; E-Mail: 5
dskocaj@bses.com.au 6
2
James Cook University, Townsville, QLD 4811, Australia 7
3
BSES Limited, PO Box 86 Indooroopilly, QLD 4854, Australia 8
* Author to whom correspondence should be addressed; E-Mail: dskocaj@bses.com.au 9
Tel.: +61-7 4088 0703; Fax: +61-7 4068 1907. 10
11
Abstract: Sugarcane is a highly valuable crop grown in tropical and subtropical climates 12
worldwide primarily for the production of sucrose-based products. The Australian 13
sugarcane industry is located in close proximity to sensitive environments and the apparent 14
declining health of the Great Barrier Reef has been linked to damaging levels of land-based 15
pollutants entering reef waters as a result of sugarcane cultivation undertaken in adjacent 16
catchments. Unprecedented environmental scrutiny of N-fertiliser application rates is 17
necessitating improved N-fertiliser management strategies in sugarcane. Over time the focus 18
of N-fertiliser management has shifted from maximising production to optimizing 19
profitability and most recently to improved environmental sustainability. However, current 20
N calculations are limited in their ability to match N-fertiliser inputs to forthcoming crop 21
requirements. Seasonal climate forecasts are being used to improve decision-making 22
crop growth, N-demand and N-loss processes, but climate forecasts are not being used to 1
guide N management strategies. Seasonal climate forecasts could be used to develop N-2
management strategies for ‘wet’ and ‘dry’ years by guiding application rate, timing and/or 3
frequency of N inputs and the benefit of using alternative forms of N fertiliser. The use of 4
seasonal climate forecasts may allow more environmentally sensitive yet profitable N-5
management strategies to be developed for the Australian sugarcane industry. 6
Keywords: sugarcane; Australia; nitrogen; seasonal climate forecasting; environment 7
8
1. Introduction
9
Sugarcane, one of the longest cultivated plants in the world, is a highly valuable crop grown in 10
tropical and subtropical climates worldwide. Grown primarily for the production of sucrose-based 11
products, sugarcane can also be used to produce a diverse range of alternative products and offers a 12
renewable alternative to petrochemical resources (Brumbley et al. 2008; Brumbley et al. 2007). This 13
versatility provides a strong economic outlook for the future of the sugarcane industry as the world’s 14
population continues to increase and the demand for food and renewable energy sources intensifies. 15
The location of sugarcane production areas in close proximity to sensitive environments 16
necessitates the development and adoption of sustainable production practices. The Australian 17
sugarcane production system has evolved to include a suite of best management practices focused on 18
maintaining productivity, improving profitability and minimising the movement of sediment, nutrients 19
and pesticides off farm (Schroeder et al. 2008; Christiansen 2000; Hurney et al. 2008; Schroeder et al. 20
2009a; Smith 2008). Although these practices have been largely successful in achieving the desired 21
outcomes, loss of nitrogen (N) from sugarcane production remains a serious impairment to improved 22
al. 2010; Wang et al. 2012; Prasertsak et al. 2002; Vallis and Keating 1994; Thorburn et al. 2011b; 1
Schroeder et al. 2010a). 2
Although sugarcane requires large inputs of N for successful crop growth (van der Laan et al. 3
2011), it is relatively inefficient in the recovery of N fertiliser (Vallis and Keating 1994). Recovery 4
studies of applied N fertiliser in the crop and surrounding soil in Australia indicate maximum 5
recoveries are just over 60% of N applied (Chapman et al. 1991; Vallis and Keating 1994; Prasertsak 6
et al. 2002). The unrecovered N is either held in the soil by microbial immobilization (Jansson and 7
Persson 1982) and/or lost from the sugarcane production system (Wood et al. 2010a). Strategies have 8
been developed to reduce N losses from ammonia volatilisation but they have not reduced 9
denitrification and leaching losses (Chapman et al. 1991; Vallis and Keating 1994). In extreme 10
situations, denitrification can result in 25% of the applied N fertiliser being lost to the atmosphere 11
(Denmead et al. 2010). The magnitude of N losses and low recoveries of fertiliser N by the sugarcane 12
crop are of significant economic and environmental importance (Thorburn et al. 2011c; Bainbridge et 13
al. 2009; Benn et al. 2010; Brodie et al. 2001; Brodie et al. 2010). 14
The focus of N-fertiliser management in the Australian sugarcane industry has recently shifted from 15
production maximization to profit optimization and most recently improved environmental 16
sustainability (Wood et al. 1997; Wood et al. 2003; Schroeder et al. 1998; Thorburn et al. 2011b). 17
Two N management calculation systems developed in the Australian sugarcane industry are SIX 18
EASY STEPS and N Replacement. The SIX EASY STEPS nutrient-management program aims to 19
deliver soil- and site-specific N-fertiliser guidelines for sustainable sugarcane production (Schroeder et 20
al. 2007a; Schroeder et al. 2009b; Schroeder et al. 2005a; Schroeder and Wood 2001; Schroeder et al. 21
2010b; Wood et al. 2003; Schroeder et al. 2009c; Calcino et al. 2010; Schroeder et al. 2010a; 22
Schroeder et al. 2005b; Schroeder et al. 2006). The N Replacement system aims to replace the amount 23
of N removed by the previously harvested crop (Thorburn et al. 2003; Thorburn et al. 2004a). 24
in climatic conditions experienced during the current growing season or those predicted for the 1
forthcoming season. 2
The use of seasonal climate forecasting in agricultural production systems is increasing as 3
stakeholders aim to improve decision-making capabilities that are impacted by climate (Sivakumar 4
2006; Hammer et al. 2001). Seasonal climate forecasts are being used to improve decision-making 5
capabilities in the growing, harvesting, milling and marketing sectors of the Australian sugarcane 6
industry (Everingham et al. 2003; Everingham et al. 2001; Everingham et al. 2002a; Everingham et al. 7
2005). Potential exists to increase the application of climate-forecasting information into other areas 8
of the Australian production system to reduce the impact of climate variability on economic losses and 9
environmental degradation. 10
This review aims to provide a general overview of the sugarcane industry before focusing on the 11
Australian sugarcane production system and opportunities to improve N-management strategies for 12
superior environmental and economic outcomes. 13
14
2. Literature Review
15
2.1. The Sugarcane Plant
16
Sugarcane is a perennial tropical grass belonging to the Gramineae, genus Saccharum (Van 17
Dillewijn 1952; James 2004; Bakker 1999). There are two wild and four domesticated species of 18
Saccharum. The wild species are Saccharum spontaneum L., which is found throughout tropical 19
Africa, Asia and Oceania, and Saccharum robustum Brandes & Jeswiet ex Grassl, which is restricted 20
to Papua New Guinea and neighboring islands. The four domesticated species; Saccharum
21
officinarum L., Saccharum edule Hassk., Saccharum barberi Jeswiet and Saccharum sinense Roxb. 22
have a higher sucrose content and lower fibre content than the wild species (Bakker 1999; Bull 2000). 23
All current commercial sugarcane cultivars are complex hybrids of two or more species of Saccharum
24
sugar in its stalk. The elongation and expansion of the sugarcane stalk provides an ideal area to store 1
sucrose (Van Dillewijn 1952). 2
Commercially, sugarcane is asexually propagated by planting stalk cuttings known as setts or 3
billets. This produces a new sugarcane crop with the same characteristics as the crop from which the 4
cuttings were taken. The setts contain at least one bud, along with all the nutrients and water required 5
for the bud to germinate. On germination, a primary shoot is produced from the bud. In a process 6
known as tillering, the buds on the primary shoot then develop secondary shoots, which in turn may 7
produce tertiary shoots and so on. The primary shoot and tillers grow to produce a ‘stool’ that consists 8
of stalks of varying weight, height and diameter. The aboveground biomass of the plant crop is 9
harvested around 12-18 months after planting (Wood 1991; Pankhurst et al. 2003). The buds and root 10
primordia of the underground stool that remain after harvest develop to produce a further crop known 11
as a ratoon crop. Ratoon crops are normally harvested at around 12 months of age, but the growth 12
period can be as long as 22-24 months depending on the climatic conditions (mainly temperature and 13
solar radiation) and soil moisture experienced during the growing season (Ellis and Merry 2004). In 14
some circumstances, ratoon crops are ‘stood over’ to the following harvest. This usually occurs when 15
weather conditions prevent crops of sugarcane being harvested. Successive ratoon crops continue to 16
be produced until the field needs to be replanted due to declining yields. Over time, the soil looses its 17
structure and becomes compacted due to in-field operations (especially harvesting and haul-out of the 18
crop). Damage from pests and diseases increases, soil salinity and sodicity problems are exacerbated, 19
and the stool is damaged by harvesting equipment (Ellis and Merry 2004). Consequently, plant 20
populations decline and productivity reduces to a level where it is uneconomical to continue the crop 21
cycle and replanting is required. 22
23
2.2. Sugarcane Products and Uses
24
Sugarcane is the fastest growing, largest biomass and highest sucrose-accumulating agricultural 25
to refined white sugar and specialty products. With these products meeting the dietary requirements of 1
both high and low income consumers around the world, sugarcane is the largest contributor of dietary 2
carbohydrate for human consumption after cereal crops (Brumbley et al. 2008). There is also a small 3
but profitable specialty market for organically produced sugar, most of which is grown and processed 4
in Florida in compliance with strict field and factory protocols (Irvine 2004). 5
Processing sugarcane into raw sugar also produces by-products (bagasse, molasses, filter mud and 6
ash) that have many different uses. Bagasse, the fibrous residue of the sugarcane plant that remains 7
after sugar extraction, can be used to manufacture paper, animal feed and bioenergy (Brumbley et al. 8
2008; Barnes 1974). It is often used in energy cogeneration for sugar milling operations, with surplus 9
energy fed back into local electricity grids (Brumbley et al. 2008; Goldemberg et al. 2008; Alonso-10
Pippo et al. 2008; Mackintosh 2000). 11
Molasses is the thick, dark, uncrystallized syrup that remains after most of the sucrose has been 12
extracted from the cane juice in the production of raw sugar (Mackintosh 2000). It is used in the 13
production of syrups, animal supplements, ethanol for blending with gasoline or diesel, and distillation 14
of alcoholic beverages (Brumbley et al. 2008; Mackintosh 2000). 15
Filter mud (also known as filter press / cake, or mill mud), ash, molasses and vinasse (a by-product 16
of ethanol production, referred to as dunder in Australia) are also valuable sources of mineral nutrients 17
and organic matter (Calcino 1994; Calcino et al. 2000; Mackintosh 2000). The nutrient composition of 18
these products varies. Generally, filter mud contains significant amounts of calcium (Ca), phosphorus 19
(P) and N, whereas ash contains significant amounts of potassium (K), Ca, magnesium (Mg) and 20
silicon (Si) and molasses and vinasse are high in K (Calcino 1994; Calcino et al. 2000). These 21
products often need to be used in combination with inorganic fertilisers to meet the nutritional 22
requirements of the crop as not all of the nutrients they contain are available immediately for plant 23
uptake (Calcino 1994; Mackintosh 2000; Calcino et al. 2000; Barnes 1974). 24
Sugarcane can also be used to produce biofuels, bioenergy and biopolymers (Brumbley et al. 2008; 25
the potential of sugarcane to offer a renewable and environmentally friendly alternative to 1
petrochemical resources (Brumbley et al. 2008; Ferreira-Leitao et al. 2010; Brumbley et al. 2007). 2
Similarly transgenic approaches to genetic and metabolic engineering have resulted in the production 3
of new high-value products, allowing sugarcane to be used as a biofactory for the production of 4
alternative sugars, bioplastics, high-value proteins and fine chemicals including nutraceuticals, 5
industrial enzymes and pharmaceuticals (Brumbley et al. 2008; Irvine 2004; Brumbley et al. 2007). 6
It is apparent that the sugarcane plant has a diverse range of uses and there is strong potential for 7
market diversification. In the future, it is highly likely that sugarcane will be grown to produce sucrose 8
for human consumption and biomass for the manufacture of fuel, energy and alternative products 9
(Brumbley et al. 2008). 10
11
2.3. International Sugarcane Industry
12
Sugarcane is grown between latitudes 35o North and 35o South, from sea-level to 1500 m in over 13
100 countries throughout Africa, North, Central and South America, Asia and Oceania (Barnes 1974; 14
Bakker 1999; Muchow et al. 1997). Brazil, India, China, Thailand, Pakistan, Mexico, Colombia, 15
Australia, Argentina and the United States of America are the largest sugarcane-growing nations 16
supplying over 80% of the total 2009-2010 sugarcane production (F.O.Lichts 2010). Brazil, Thailand 17
and Australia are also major exporters of raw sugar (F.O.Lichts 2010; Hogarth and Ryan 2000). 18
Brazil is the largest sugarcane producer, raw-sugar exporter and manufacturer of sugarcane ethanol. 19
In 2009-2010 Brazil grew around 40% of the total sugarcane produced (F.O.Lichts 2010) and had 325 20
sugar-ethanol plants operational in 2010 (Ferreira-Leitao et al. 2010). The size of the Brazilian 21
sugarcane industry and its flexibility to produce sugar or ethanol have a major influence on the value 22
of raw sugar exports (Hogarth and Ryan 2000). It also makes it difficult for other raw-sugar exporters 23
to secure market share, especially during times of excess production. To remain competitive and 24
profitable, other major raw sugar exporters, such as Australia, have focused on establishing a 25
efficiency and reducing operating expenses (Hogarth and Ryan 2000; Mackintosh 2000; 1
CANEGROWERS 2010). Australia is recognized as one of the most cost-effective sugarcane 2
producers in the world, capable of securing market share even during times of excess production 3
(CANEGROWERS 2010; Hogarth and Ryan 2000). 4
5
2.4. Australian Sugarcane Industry
6
Generating annual revenue of US$1.5-2.5 billion, the processing of sugarcane into raw sugar is one 7
of Australia’s largest and most important rural industries (CANEGROWERS 2010). Family-owned 8
businesses with an average farm size of 110 ha and some very large corporately-owned cane-farming 9
businesses produce 32 to 35 Mt of sugarcane and 4.5 to 5 Mt of raw sugar annually 10
(CANEGROWERS 2010). 11
In Australia, sugarcane is grown along 2200 km of coastline (Figure 1) from Mossman 12
(S16o30’,E145o30’) in far north Queensland to Harwood (S29o25’,E153o14’) in northern New South 13
Wales (Schroeder et al. 2008; CANEGROWERS 2010). Encompassing an area of approximately 500 14
000 ha (Schroeder et al. 2008) the Australian sugarcane industry is split into five discontinuous 15
regions: Northern, Burdekin, Central, Southern and New South Wales. These regions are situated 16
within wet tropical and humid sub-tropical climates and are separated by areas of unsuitable soils or 17
unreliable rainfall (Kingston 2000; Schroeder et al. 2008). 18
Figure 1. Geographical location of the Australian sugarcane industry highlighting mean 19
1
In Queensland, sugarcane is cultivated along the east coast in lowland areas of catchments draining 2
eastward into the Great Barrier Reef World Heritage Area (Brodie et al. 2001; Wrigley 2007). The 3
mean annual rainfall ranges from over 4000 mm to less than 1000 mm, necessitating full or 4
supplementary irrigation in some districts (Barnes 1974; Kingston 2000; Schroeder et al. 2008). In the 5
Wet Tropics region more than 80% of the total annual rainfall occurs during the wet season that starts 6
in summer and extends into autumn (Kingston 2000). Summer-dominated rainfall, coupled with the 7
risk of flooding and cyclonic storms, results in the harvest season operating from June to December to 8
coincide with normally drier weather. 9
With Queensland producing approximately 95% of Australia’s annual raw sugar total, it is not 10
surprising that sugarcane is the major agricultural crop grown on the east coast (CANEGROWERS 11
2010; Hogarth and Ryan 2000; Barnes 1974). The ability to grow sugarcane over a large area of 12
different soil types and climatic conditions, in combination with easy access to required infrastructure, 13
results in sugarcane being grown in preference to alternative crops. However, the period between crop 14
production (Garside and Bell 1999). Alternatively, sugarcane may be used in longer-term rotation 1
with crops such as bananas in northern Queensland. 2
In New South Wales sugarcane is grown in a subtropical climate on coastal plains traversed by 3
three rivers (Barnes 1974). The mean annual rainfall total ranges from 1300 mm to 1700 mm and, 4
although the majority falls during the wet season, up to 40% of the total annual rainfall can fall over 5
the winter months creating drainage and harvesting problems (Calcino et al. 2008; Kingston 2000). 6
Frequent flooding may occur in late summer and crops can be frosted in some areas during winter 7
(Barnes 1974). The cooler climate of New South Wales results in most sugarcane crops growing for 2 8
years before harvest, compared to 1 year in Queensland (Barnes 1974). 9
The Australian sugarcane industry with 24 sugar mills and six bulk-storage terminals is small 10
compared to its major raw-sugar exporting competitors. Approximately 80% of the raw sugar 11
Australia produces is exported, mainly to China, Indonesia, Japan, Korea, Malaysia, Taiwan, the 12
United States of America and New Zealand (CANEGROWERS 2010; Hogarth and Ryan 2000). The 13
remainder is refined and processed in Australia to produce white sugar, liquid sugar products and 14
specialty products such as golden syrup, coffee sugar, cubed sugar and treacle for domestic 15
consumption. 16
The productivity of Australian sugarcane farms and mills is amongst the highest in the world and 17
production costs are similar to most other larger sugarcane producers (Hogarth and Ryan 2000). 18
Australia is regarded as one of the most competitive, cost-effective and innovative producers and 19
exporters of raw sugar and a leader in the adoption of sustainable farming practices 20
(CANEGROWERS 2010; Hogarth and Ryan 2000). 21
22
2.4.1. Australian Sugarcane Production System 23
The Australian sugarcane farming system focuses on the adoption of best management practices for 24
improved productivity, profitability, sustainability and environmental responsibility (Hurney et al. 25
sugarcane farming system and, although growers tailor practices to suit their individual requirements 1
and climatic conditions, certain fundamental principles exist. Multidisciplinary research conducted by 2
the Sugarcane Yield Decline Joint Venture (Garside et al. 1997; Garside 1997; Garside et al. 2001) to 3
investigate the loss of productive capacity of Australian sugarcane growing soils under long-term 4
monoculture promoted the adoption of a sustainable farming system. This farming system 5
recommends inclusion of a break period between crop cycles, preferably incorporating a well-managed 6
legume crop, reducing tillage practices, increasing row spacing to allow for controlled trafficking of 7
machinery, adopting green, cane trash-blanketing (no pre-harvest burning and conservation of crop 8
residues; GCTB) wherever possible and sustainable resource use (Hurney et al. 2008; Garside et al. 9
2004; Bell et al. 2003; Garside et al. 2006). At least some of these practices are commonly adopted 10
within most sugarcane farming enterprises as they have significant potential to reduce production 11
costs, improve operation timeliness and soil health and prevent sugarcane yield decline (Garside et al. 12
2004; Bell et al. 2003; Hurney et al. 2008). 13
The average Australian sugarcane crop cycle consists of plant and four to five ratoon crops with a 14
4-6 month break period between crop cycles to break the sugarcane monoculture (Garside et al. 2009; 15
Pankhurst et al. 2003; Wood 1991; Garside et al. 1997). The break period also provides an ideal 16
opportunity to determine the soil nutrient status, target weed control, reduce pest and disease pressure, 17
undertake land rectification activities, and plant an alternative crop (Hurney et al. 2008). Legume 18
crops grown during the break provide a diverse species break from sugarcane and a source of mineral 19
N, improve soil health and increase productivity (Garside and Bell 2001; Garside and Bell 1999). The 20
most commonly grown legumes are cultivars of soybean (Glycine max), cowpea (Vigna unguiculata), 21
lab lab (Lablab purpureus) and peanut (Arachis hypogaea) and, although broadcast planting is still 22
practiced, direct-drill planting into raised mounds or existing cane rows to reduce tillage operations 23
and maximise germination is becoming more popular (Garside and Bell 2001). Legumes are generally 24
grown as green-manure crops in the wetter northern districts, with grain crops produced where weather 25
1999). As the break period usually coincides with the wet season, alternative crops help minimise the 1
risk of erosion and pollutant movement off-farm. Where it is not possible to grow a well-managed 2
legume crop, a bare fallow maintained with knockdown herbicides is the best alternative (Hurney et al. 3
2008). Most Australian sugarcane farming systems use a configuration of single rows separated by 4
about 1.52 m. Transition to controlled-traffic farming systems consisting of single or dual rows 5
separated by 1.8 to 2.0 m is gradually occurring and minimises the adverse effects of soil compaction 6
in the cropping zone (Calcino et al. 2008). This farming system is also better suited to zonal tillage 7
systems that only cultivate the row area. Adoption of minimum or zonal tillage land preparation 8
practices in combination with a greater reliance on chemical weed control have reduced aggressive 9
tillage practices and helped minimise soil disturbance in break and plant crops. Zero tillage, the 10
practice of direct drilling sugarcane setts into undisturbed soil, is not common, as some cultivation is 11
required to reshape the cane drill and prepare an adequate seed bed (Calcino et al. 2008). However, a 12
recently developed direct-drill sugarcane planter based on the double-disk-opener planter concept 13
commonly used in the grains industry has the potential to successfully operate in any cultivation 14
system, including zero tillage (Robotham 2004; Robotham and Chappell 2000). 15
Sustainable use of resources is another important component of the Australian sugarcane production 16
system and focuses on the correct application rate, placement and timing of nutrient, water, herbicide 17
and pesticide inputs to maximise profitability and minimise detrimental offsite impacts (Hurney et al. 18
2008). This type of approach is particularly evident in current nutrient management guidelines that 19
consider nutrient availability based on soil test results, crop requirements, crop class, yield potential 20
and nutrient contributions from other sources such as mill by-products and legumes so that 21
recommended nutrient application rates can be adjusted accordingly (Schroeder et al. 2009c; Schroeder 22
et al. 2007a; Wood et al. 2003; Calcino et al. 2010). It is also illustrated in recently developed 23
guidelines for best-practice integrated weed management (Schroeder et al. 2009a; Calcino et al. 2008). 24
Crop-management practices are highly mechanized and all sugarcane is mechanically planted with 25
harvested using wheel or track chopper harvesters (Ridge and Norris 2000). Most of the industry has 1
transitioned to green-cane harvesting and trash retention. This has been a catalyst for the adoption of 2
zero or strategic tillage, sub-surface fertiliser application and chemical weed control in ratoon crops 3
(Willcox et al. 2000). It is also considered to be best practice providing agronomic, environmental and 4
financial benefits to the farming system, especially when compared to traditional burnt-cane harvest 5
systems (Schroeder et al. 2009a; Garside et al. 1997; Braunbeck et al. 1999; Smith et al. 1984). 6
When harvested, sugarcane is transported to a mill for processing. In Australia, a cane price 7
formula is used to determine the value of sugarcane delivered to the mill for each grower. The value is 8
shared between growers and millers, roughly on a 2/3 : 1/3 basis (Mackintosh 2000), meaning growers 9
are more focused on sucrose production and profitability, whereas millers are primarily interested in 10
tonnes of cane delivered to the mill (Schroeder et al. 2013). 11
2.4.2. Australian Sugarcane Production Challenges 12
Ongoing constraints to sugarcane productivity in Australia include changes to the bio-physical 13
environment, socio-economic factors, environmental considerations, the influence of pests and 14
diseases and harvest scheduling (Garside et al. 1997; Muchow et al. 1997). In addition, there are a 15
number of other challenges currently confronting the Australian sugarcane industry. These include 16
rising input costs, skilled labour shortage, market diversification, the unknown impact of climate 17
change and restructuring of research, development and extension services. However, it is the intense 18
pressure from tourism, environmental, public and political groups to minimise the environmental 19
impact of sugarcane production practices that takes centre stage (Calcino et al. 2010; Benn et al. 2010). 20
Environmentally sustainable sugarcane production practices are continually being developed in an 21
attempt to deliver superior environmental outcomes without restricting productivity or profitability. 22
Practices such as GCTB, zonal and minimum tillage land preparation, legume cover crops or spray-out 23
fallow management, subsurface fertiliser application and refinement of nutrient-management 24
guidelines all aim to reduce sediment and nutrient movement off farm (Christiansen 2000; Schroeder 25
vegetation along waterways and the installation of sediment traps also help to intercept and retain any 1
sediment, nutrients and pesticides in farm runoff water (Smith 2008; Christiansen 2000). Transition to 2
these farming practices is often voluntary, as they are also associated with agronomic and economic 3
benefits. 4
Despite voluntary adoption of these environmentally sustainable sugarcane production practices, 5
regulations (Great Barrier Reef Protection Amendment Act, 2009) targeting nutrient and pesticide 6
inputs were introduced by the Queensland Government to improve the quality of water entering the 7
Great Barrier Reef lagoon (Anon 2009a). The regulations also require sugarcane growers with more 8
than 70 ha in the Wet Tropics catchment to complete an Environmental Risk Management Plan 9
(ERMP) to continue farming (Anon 2009a). This development has primarily occurred due to 10
unprecedented environmental scrutiny of N-application rates and N losses attributed to the Australian 11
sugarcane industry. 12
13
2.4.2.1 Nitrogen management in Australian sugarcane production 14
Worldwide there is an increasing realisation that farmers must become more pro-active in managing 15
the effect of their farming system on the surrounding environment (Ellis and Merry 2004; Garside et 16
al. 1997). This is of high importance in the Wet Tropics region of northern Australia, the only place in 17
the world where sugarcane production is surrounded by two adjacent World Heritage Areas of national 18
and international ecological, economic and social significance (Benn et al. 2010; Brodie et al. 2001; 19
Wrigley 2007; Newby and Wegener 2003; Waterhouse et al. 2012). The Wet Tropics World Heritage 20
Area is Australia’s most floristically rich environment, providing habitat for 76 species of animals 21
regarded as rare, vulnerable or endangered (Trott 1996) and the Great Barrier Reef World Heritage 22
Area is the world’s largest reef ecosystem (Brodie et al. 2001). 23
Even with the adoption of environmentally sustainable sugarcane production practices, there is a 24
risk that ‘environmental pollutants’, including N, could be lost from the sugarcane production system 25
the greatest quantity to optimise yield, greater emphasis needs to be placed on the development of 1
environmentally sustainability yet profitable N-management strategies (Thorburn et al. 2004a; 2
Thorburn et al. 2003; Schroeder et al. 2009b; van der Laan et al. 2011). 3
2.4.2.1.1 Nitrogen sources for sugarcane production 4
Nitrogen in the soil is present in organic (i.e. organic matter) and inorganic (i.e. ammonium (NH4+), 5
nitrate (NO3-), nitrite (NO2-), nitrous oxide (N2O)) forms. Organic N can represent around 95-99% of 6
the total soil N and is converted to mineral N forms via the decomposition of organic matter in a 7
process known as mineralisation (Glendinning et al. 2000). Only a small proportion of organic N 8
becomes available for plant uptake. 9
Inorganic N represents only 2-3% of the total soil N. The two most abundant forms of inorganic N, 10
also referred to as mineral N (which is readily available for plant uptake), are NH4+ and NO3 -11
(Glendinning et al. 2000). Ammonium ions are positively charged and held in an exchangeable form 12
on the negatively charged surfaces of clay particles and organic matter (Brady and Weil 2002; 13
Glendinning et al. 2000). Ammonium is, therefore, a relatively immobile form of N and less 14
susceptible to leaching and denitrification losses (Glendinning et al. 2000). Nitrate ions remain in the 15
soil solution as they cannot be absorbed by clay particles or organic matter, and are, hence, a highly 16
mobile form of N (Brady and Weil 2002; Glendinning et al. 2000). 17
The N contained in commonly applied N fertilisers exists in three forms: organic (i.e. urea, mill by-18
products and manures), NO3- and NH4+. In sugarcane, the most commonly applied fertiliser products 19
include granular, liquid, mill by-product and organic forms (Schroeder et al. 2009a). The form of N 20
fertiliser applied is often based on cost as research has demonstrated no difference in cane yields from 21
using ammonium sulphate or urea, provided it is subsurface applied (Leverington 1964). 22
In plant cane, inorganic fertilisers are often applied as mixtures at planting (Calcino et al. 2008). In 23
ratoons, inorganic fertilisers mixtures, also known as “one shot blends”, are often urea-based products 24
2009a; Thorburn et al. 2003). Alternatively, ‘straight’ products such as urea and muriate of potash 1
may be applied instead of mixtures. The nutrient compositions for plant and ratoon fertiliser mixtures 2
vary so that the most appropriate product can be selected to meet the nutritional requirements of the 3
block. Liquid fertilisers include commercially available nutrient solutions that are based on inorganic 4
fertiliser products, and dunder-based products that are usually fortified with other nutrients including N 5
(Schroeder et al. 2009a). Mill by-products also provide a significant source of N, but, as it is in an 6
organic form, not all the N is immediately available for plant uptake (Calcino 1994; Mackintosh 2000; 7
Calcino et al. 2000; Barnes 1974). A proportion of the applied fertiliser N remains in the soil, but this 8
residual N contributes only small amounts of N for sugarcane growth (Chapman et al. 1992). 9
Legume break crops can contribute significant amounts of mineral N for sugarcane production. 10
Well-managed soybean (Glycine max cv. Leichardt) and cowpea (Vigna unguiculata cv. Meringa) 11
crops are capable of supplying 310 and 140 kg N/ha, respectively, excluding the N stored in the below-12
ground parts of the crop (Garside and Bell 1999; Garside et al. 1996). In most situations symbiotically 13
fixed N accounts for 50-60% of the N accumulated by the legume crop, with the remainder sourced 14
from soil mineral-N reserves (Garside and Bell 1999). Following a legume crop, the amount of N 15
fertiliser applied to plant cane can be reduced or possibly eliminated depending on legume residue 16
management at the end of the break period (Schroeder et al. 2009a; Schroeder et al. 2007b; Garside 17
and Bell 1999). 18
2.4.2.1.2 Nitrogen loss processes 19
Crops seldom assimilate more than 50% of the N applied as fertiliser (Chen et al. 2008). For 20
sugarcane grown in Australia, research using labelled 15N fertiliser has indicated maximum recoveries 21
in the crop and surrounding soil of just over 60% of the N fertiliser applied (Chapman et al. 1991; 22
Vallis and Keating 1994; Prasertsak et al. 2002). The unrecovered N is either held in the soil by 23
microbial immobilisation (Jansson and Persson 1982) and/or lost from the sugarcane production 24
et al. 2010a). Ammonia volatilisation and denitrification are the dominant processes for gaseous losses 1
of fertiliser N from Australian agriculture (Chen et al. 2008). 2
Surface application of urea to sugarcane trash can result in significant losses of N fertiliser. 3
Between 30% and 70% of the applied N can be lost by ammonia volatilization (Denmead et al. 1990; 4
Prammanee et al. 1988). The process of ammonia volatilization is driven by the addition of small 5
amounts of water (dewfall, intermittent rainfall and condensation of evaporated soil moisture) to the 6
trash layer where urea-based products have been surface-applied (Denmead et al. 1990). Water 7
dissolves the urea and allows the naturally occurring urease enzyme in the sugarcane residues to 8
catalyse the hydrolysis of the dissolved urea to ammonium carbonate (Denmead et al. 1990). 9
Sugarcane trash has a low capacity to retain ammonium and its high urease activity speeds up the 10
hydrolysis process (Freney et al. 1994). Ammonium carbonate is very unstable and, as the water 11
evaporates, ammonia (NH3+) gas is released and volatilization commences (Denmead et al. 1990). 12
Nitrate ions are highly susceptible to leaching losses (Brady and Weil 2002; Glendinning et al. 13
2000). As mentioned earlier, NO3- are not well held by clay particles or organic matter and move 14
freely with soil water (Glendinning et al. 2000). Nitrate may be washed beyond the root zone 15
following heavy rainfall (or irrigation). The highest leaching losses are most likely to occur on coarse-16
textured, free-draining soils (i.e. sandy soils) following heavy rainfall (Chen et al. 2008; Glendinning 17
et al. 2000). 18
In addition to existing ammonia volatilization and leaching loss pathways, the moist warm climate 19
of Australian sugarcane production regions combined with GCTB, waterlogging and the addition of N 20
fertiliser also provides conditions conducive to denitrification (Denmead et al. 2010; Allen et al. 2010; 21
Wang et al. 2008b). Denitrification involves the conversion of soil NO3- to gaseous forms of N (nitric 22
oxide (NO), nitrous oxide (N2O) or di-nitrogen nitrogen (N2)) by microorganisms in anaerobic 23
conditions (i.e. waterlogged soils) (Denmead et al. 2005). This process is driven by the availability of 24
(Brady and Weil 2002). Emission of N2O is of greatest concern from an environmental viewpoint 1
(Wang et al. 2008b; Wang et al. 2012). 2
In sugarcane, high N2O emissions can be expected from waterlogged soils with a high organic-3
carbon content, high mineral-N concentration and high temperature (Allen et al. 2010; Allen et al. 4
2008) and where GCTB is practiced because of greater soil moisture retention and increased microbial 5
activity (Weier et al. 1998). It has been estimated that 17% of applied N fertiliser is lost to the 6
atmosphere (Macdonald et al. 2009) with between 1.0% and 6.7% emitted as N2O (Allen et al. 2010). 7
Nitrous oxide emissions were recently measured under different break and N fertiliser management 8
regimes (Wang et al. 2012). After a bare fallow emissions increased from 6.3 kg to 12.3 kg N2O N/ha 9
following an increase in plant cane N rates (0 to 150 kg N/ha), with the highest emission, 20.9 kg N2O 10
N/ha, measured after a soybean break crop and the addition of 75 kg N/ha in plant cane. Relatively 11
high N2O emissions, 21% of the N fertiliser applied (Denmead et al. 2010), have also been measured 12
from highly organic, acid-sulphate soils in northern NSW (Denmead et al. 2005; Denmead et al. 2010). 13
14
2.4.2.1.3 Consequences of nitrogen losses 15
Loss of N from the sugarcane production system can have serious environmental consequences. 16
The apparent declining health of the Great Barrier Reef has been attributed to damaging levels of land-17
based pollutants entering reef waters as a result of agricultural activities, the dominant being beef 18
grazing and sugarcane cultivation, undertaken in adjacent catchments (Thorburn et al. 2011c; 19
Bainbridge et al. 2009; Benn et al. 2010; Brodie et al. 2001; Brodie et al. 2010). At a regional scale, 20
the Wet Tropics has been estimated to deliver the highest anthropogenic dissolved inorganic nitrogen 21
(DIN) load to the Great Barrier Reef lagoon (Waterhouse et al. 2012; Kroon et al. 2012). The loss of 22
N fertiliser applied to sugarcane fields contributes a large proportion of the anthropogenic load of DIN 23
in this region (Waterhouse et al. 2012). At the local level, catchment water-quality monitoring 24
programs have been undertaken to identify the source and quantity of land-based pollutants entering 25
Tully-Murray catchment in the Wet Tropics region undertaken by (Bainbridge et al. 2009) is just one 1
example. Although it is difficult to easily isolate pollutant discharge from single land uses within the 2
Tully-Murray catchment, elevated NO3- concentrations were measured in waterways draining 3
sugarcane land (Bainbridge et al. 2009). 4
The production of N-containing gases by denitrification contributes to atmosphere pollution. 5
Nitrous oxide in particular is a potent greenhouse gas with a global warming potential 298 times higher 6
than that of carbon dioxide (Wang et al. 2008b; Wang et al. 2012). The release of NO and N2O into 7
the atmosphere can also contribute to the formation of nitric acid, one of the principal components of 8
acid rain (Brady and Weil 2002). 9
When NO3+ is leached from the soil it is often accompanied by basic cations such as Ca, Mg and K 10
(Glendinning et al. 2000). These cations are replaced by hydrogen (H) ions, increasing the acidity of 11
the soil (Glendinning et al. 2000). The nitrification and mineralisation processes are also major causes 12
of soil acidification as the conversion of NH4+ to NO3- releases hydrogen ions (Glendinning et al. 13
2000; Noble et al. 1997). The form of N fertiliser applied can influence the rate of acidification. 14
However, fertiliser is applied in relatively small amounts (compared to the volume of soil and the 15
soil’s pH buffering capacity) and does not have a direct effect on soil pH (Glendinning et al. 2000). 16
Increased NO3- concentrations in groundwater or surface water due to leaching can have toxic effects 17
(causing methemoglobinemia or blue baby syndrome) if used as drinking water (Brady and Weil 18
2002). 19
The magnitude of N losses and low recoveries of fertiliser N by the sugarcane crop are also of 20
significant economic importance to the sugarcane industry (Haysom et al. 1990). Investment in N 21
fertiliser represents a relatively large component of farm production costs - approximately 30% of the 22
average on-farm budget is associated with nutrient inputs (Schroeder et al. 2005b). Therefore, loss of 23
applied N from the sugarcane production system may represent a serious economic loss to the grower 24
(Anich and Wegener 1992; Wood et al. 2010b; Chen et al. 2008). The magnitude of economic losses 25
losses of applied N may severely reduce the amount of N that is available for crop growth. Insufficient 1
N supply, especially under favourable growing conditions, may restrict sugarcane yield (Schroeder et 2
al. 2010b). Lower cane yield reduces the economic return on N fertiliser investment. Although the 3
immediate consequences of N losses are first experienced by the grower, lower cane yields can also 4
affect the operational efficiency and profitability of other industry sectors (i.e. harvesting contractors). 5
6
2.4.2.1.4 Strategies to reduce N losses and improve nitrogen-use efficiency 7
Nitrogen management in the Australian sugarcane industry has undergone significant changes since 8
the 1960s with the aim of improving the use efficiency of N fertiliser. Rate of fertiliser experiments 9
conducted by the Bureau of Sugar Experiment Stations (now BSES Limited) resulted in the 10
development of regional yield-response curves for N. This provided a set of generalised N fertiliser 11
recommendations for plant and ratoon crops that would maximise productivity and achieve an 12
economic return (Chapman 1994). These recommendations are shown in Table 1, and, although they 13
were easy to use, they lacked precision. Little emphasis was placed on the N mineralisation potential 14
of different soil types and there was very little differentiation among regions or soil types (Schroeder et 15
[image:22.596.81.514.596.768.2]al. 2005a; Schroeder et al. 1998; Wood et al. 1997). 16
Table 1. Generalised N management recommendations for sugarcane in Australia (Calcino 1994; 17
Chapman 1994; Wood et al. 1997) 18
Sugar Price
N fertiliser rate (kg/ha)
Fallow Plant Replant and Ratoons
Burdekin Other districts Burdekin Other districts
<A$300/t 135 120 210 160
>A$300/t 150 120-150 270 160-200
Dryland and/or richland 80 80 120 120
Recently, soil- and site-specific N fertiliser guidelines included in the Australian sugarcane 1
industry’s comprehensive SIX EASY STEPS nutrient-management program (Schroeder et al. 2007a; 2
Schroeder et al. 2009b; Schroeder et al. 2005a; Schroeder and Wood 2001; Schroeder et al. 2010b; 3
Wood et al. 2003; Schroeder et al. 2009c; Calcino et al. 2010; Schroeder et al. 2010a; Schroeder et al. 4
2005b) have effectively replaced those generalised N-fertiliser recommendations. The SIX EASY 5
STEPS package aims to promote sustainable nutrient management and ensure that sugarcane 6
production remains profitable irrespective of sugar prices. It is also recognised as part of the 7
Australian sugarcane industry’s accepted best management practice (BMP) options (Schroeder et al. 8
2009c). Importantly, it has undergone extensive development and rigorous testing in the field, 9
glasshouse and laboratory for more than a decade (Schroeder et al. 2007b; Salter et al. 2008; Skocaj et 10
al. 2012; Schroeder et al. 2006). 11
In the SIX EASY STEPS program, N fertiliser requirements are calculated by firstly establishing 12
the baseline N requirement for a district yield potential. The district yield potential is the estimated 13
highest average annual district yield multiplied by a factor of 1.2 (Schroeder et al. 2010b). The N 14
requirement suggested by (Keating et al. 1997) of 1.4 kg N/t cane/ha up to 100 t/ha and 1 kg N/t 15
cane/ha is then used in combination with the district yield potential to set the baseline N requirement. 16
Once this is done, the organic carbon (%) value from a soil test result is used to determine the N-17
mineralisation index of the soil (soils differ in their ability to easily mineralise N from organic matter) 18
and refine the baseline N requirement. Final adjustments are made to account for N contributions from 19
other sources, including legume break crops and mill by-products. The N fertiliser guidelines for the 20
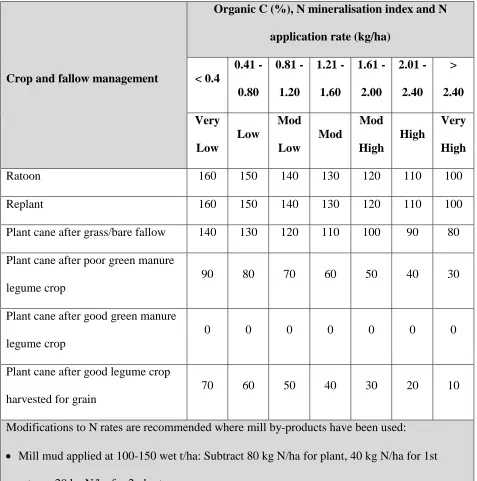
Wet Tropics region as determined by the SIX EASY STEPS program are shown in Table 2. There is 21
flexibility to adjust the baseline N requirement upward or downward by 1 kg N/t cane/ha for blocks, 22
farms or sub-districts that consistently produce above or below the district yield potential. Just as soil 23
tests are considered fundamental to the SIX EASY STEPS process, leaf analysis is also considered to 24
be an important diagnostic tool that may be used for checking on the adequacy of fertiliser inputs 25
Table 2. SIX EASY STEPS N fertiliser guidelines for the Wet Tropics region of the Australian 1
sugarcane industry (Schroeder et al. 2005a; Schroeder et al. 2007b) 2
Crop and fallow management
Organic C (%), N mineralisation index and N application rate (kg/ha)
< 0.4
0.41 - 0.80
0.81 - 1.20
1.21 - 1.60
1.61 - 2.00
2.01 - 2.40
> 2.40 Very
Low
Low
Mod Low
Mod
Mod High
High
Very High
Ratoon 160 150 140 130 120 110 100
Replant 160 150 140 130 120 110 100
Plant cane after grass/bare fallow 140 130 120 110 100 90 80 Plant cane after poor green manure
legume crop
90 80 70 60 50 40 30
Plant cane after good green manure legume crop
0 0 0 0 0 0 0
Plant cane after good legume crop harvested for grain
70 60 50 40 30 20 10
Modifications to N rates are recommended where mill by-products have been used: Mill mud applied at 100-150 wet t/ha: Subtract 80 kg N/ha for plant, 40 kg N/ha for 1st
ratoon, 20 kg N/ha for 2nd ratoon.
Mud/ash mixture applied at 100-150 wet t/ha: Subtract 50 kg N/ha for plant, 20 kg N/ha for 1st ratoon, 10 kg N/ha for 2nd ratoon.
The N fertiliser requirement for sugarcane grown in South Africa is determined in a somewhat 1
similar method to the SIX EASY STEPS program. Four soil-N mineralisation groups (depending on 2
the organic carbon (%) values) are used to determine the N requirement from soil-test results (Meyer 3
and Wood 1994; Meyer et al. 1986). The N guidelines are based on a series of N response curves that 4
had previously been established for a range of soil types. They incorporate references to bioclimatic 5
regions and moisture regimes (irrigated or rain-fed) as a means of recognizing differences in cane 6
production (yield) capabilities. Crop stage (plant or ratoon) and other growth limiting factors such as 7
salinity, pests and soil depth are also used to adjust N recommendations (Meyer and Wood 1994; 8
Meyer et al. 1986). 9
In contrast to the SIX EASY STEPS philosophy, the Commonwealth Scientific and Industrial 10
Research Organisation (CSIRO) has developed a N-management system that aims to replace the 11
amount of N removed by the previously harvested crop (Thorburn et al. 2003; Thorburn et al. 2004a). 12
This system is referred to as the ‘N Replacement’ theory. N Replacement uses the yield of the 13
previously harvested crop to set the N requirement for the following crop. The overall objective is to 14
reduce environmental losses of applied N by avoiding over application of N fertiliser when actual 15
yields are lower than the expected yield and relying on soil N reserves to supply additional N 16
requirements when actual yields are higher than the previously harvested crop (Thorburn et al. 2007; 17
Thorburn et al. 2011b). Nitrogen fertiliser requirements for each crop are calculated by multiplying 18
the yield of the previous crop with a N requirement of 1 kg N/t cane/ha for GCTB systems and 1.3 kg 19
N/t cane/ha for burnt systems before discounting other N sources (Thorburn et al. 2007; Thorburn et al. 20
2011b). The N requirement is based on an estimate of the N contained in the cane and sugarcane crop 21
residue (i.e. trash) that is removed from the field through harvesting (and burning in burnt harvesting 22
systems), and the amount of applied N fertiliser that is potentially lost to the environment (Thorburn et 23
al. 2011b). Within this system, environmental losses of N are assumed to be as low as 10% for all 24
The average application rate of N fertiliser for Queensland sugarcane production (plant and ratoon 1
crops combined) has declined steadily from 206 kg N/ha for the 1997 crop to 164 kg N/ha for the 2008 2
crop (Wood et al. 2010a). A grower survey conducted in the Tully and Murray River Catchments of 3
the Wet Tropics region reported that the average rates of N fertiliser for plant and ratoon cane in 2006 4
were 115 and 146 kg N/ha, respectively (McMahon and Hurney 2008). There has been a marked 5
reduction in N application rates in this region since 1996 and a tendency to apply lower N rates since 6
2000 (Shannon 2002). In 2006, 65% of growers surveyed applied <120 kg N/ha to plant crops 7
compared to only 28% in 1996 (McMahon and Hurney 2008; Shannon 2002). For ratoon crops, 65% 8
of growers surveyed applied <160 kg N/ha, an increase of more than 27% of growers since 1996 9
(McMahon and Hurney 2008; Shannon 2002). Average grower N fertiliser application rates have 10
reduced below the baseline N-application rate of 140 kg N/ha for plant cane and 160 kg N/ha for 11
ratoons (prior to adjustment for the N-mineralisation index classes) as specified in the SIX EASY 12
STEPS N guidelines for the Wet Tropics region (Schroeder et al. 2005a; Schroeder et al. 2007b). The 13
trend to lower grower N application rates has also occurred in the Herbert district (Wood et al. 2008). 14
Despite evidence of a voluntary reduction in N application rates, Australian sugarcane growers must 15
now comply with legislation limiting the application of N (and P) fertiliser to optimum amounts (Anon 16
2009a). In response to state-wide water-quality monitoring outcomes, the Queensland Government, as 17
indicated previously, introduced the Great Barrier Reef Protection Amendment Act 2009 to regulate N 18
inputs by sugarcane farmers and graziers in catchment areas adjacent to the Great Barrier Reef lagoon 19
(Anon 2009a). Specifically, the Act aims to reduce the impact of agricultural activities on the quality 20
of water entering the lagoon and contribute towards achieving water-quality improvement targets for 21
the reef including a minimum 50% reduction in N loads at the end of catchments by 2013 as agreed by 22
the Queensland State and Commonwealth Governments under The Reef Water Quality Protection Plan 23
(Reef Plan) (Wrigley 2007; ReefWaterQualityProtectionPlanSecretariat 2009). The regulated method 24
for determining the optimum amount of N for individual blocks of cane is based on the SIX EASY 25
In addition to following recommended N rates, a number of other factors that can help reduce N 1
losses and improve N uptake are within growers’ control. These include the correct placement and 2
timing of N fertiliser inputs. It is recommended that all forms of N fertiliser be applied subsurface 3
regardless of trash-management practices. In particular, surface application (banded or broadcast) of 4
urea-based products to GCTB systems is not recommended as it results in significant loss of N by 5
ammonia volatilization and reduced cane yields (Prasertsak et al. 2002; Freney et al. 1994; Calcino and 6
Burgess 1995). 7
In plant cane, N fertiliser should be delivered in bands on each side of, and away from, the 8
sugarcane sett when applied at planting and banded in the centre of the cane row before being covered 9
with soil at top dressing (Schroeder et al. 2009a). Subsurface application in ratoons can be achieved 10
by either stool splitting with a single coulter to deliver fertiliser into the cane row or by dual coulters 11
beside the cane row to a depth of 70 mm to 100 mm (Schroeder et al. 2009a; Calcino et al. 2000). 12
Subsurface fertiliser applicators can apply fertiliser mixtures or two fertilisers simultaneously if 13
manufactured as a ‘split’ fertiliser box (Freney et al. 1994). Stool splitting is the most popular 14
application method (three cane rows treated with each pass instead of two), as it is easier and quicker 15
to use than other methods of subsurface application (McMahon et al. 1994). 16
Where subsurface application of N is not possible (i.e. steep slopes and rocky terrain), strategies to 17
reduce ammonia volatilisation losses include applying urea-based products in bands close to the cane 18
stool and incorporating into the soil with at least 16 mm of overhead irrigation water (or rainfall) or 19
delaying application until there is substantial canopy development (approximately 50 cm high) (Freney 20
et al. 1991; Freney et al. 1994; Calcino and Burgess 1995; Wood et al. 1989; Prammanee et al. 1989). 21
A developed canopy helps attenuate the wind speed over the trash surface allowing the leaves to 22
absorb volatilised ammonia. It also contributes to lower trash temperatures that reduces the ammonia 23
vapour pressure, and shifts the site of overnight dew formation from the trash to the leaves, thereby 24
reducing urea hydrolysis (Freney et al. 1991; Freney et al. 1994; Prammanee et al. 1989; Denmead et 25
relatively rapid uptake of applied N fertiliser (Chapman 1994). However these strategies will not 1
totally eliminate losses from ammonia volatilisation. Losses of greater than 20% of the N from applied 2
urea have been reported even when surface application of urea is followed by reasonably heavy rainfall 3
(Prammanee et al. 1989). 4
The use of urease inhibitors in combination with best practice surface application of urea-based 5
products may reduce ammonia volatilisation losses where subsurface placement is not possible. 6
Urease inhibitors aim to slow the hydrolysis process, thereby allowing the urea to move into the soil 7
(Wood et al. 2010b; Chen et al. 2008). Ammonia is then retained in the soil and less susceptible to 8
volatilisation (Chen et al. 2008). In Australia, several commercially available urease inhibitors are 9
available. One supplier has reported a reduction of loss of ammonia by volatilisation for between 7 10
and 14 days after application (R. Dwyer 2013, pers. comm. 7 February). Inadequate incorporation of 11
urea through the trash blanket and into the soil (i.e. insufficient rainfall, extended dry conditions, thick 12
trash layer) may reduce the effectiveness of urease inhibitors. 13
To minimise N losses, application timing should coincide with the crop’s demand for N (Schroeder 14
et al. 2009a; Chapman 1994). To achieve this, N is often split applied in plant cane by applying a low 15
N-concentration fertiliser concurrently at planting and any remaining N requirements as a top-dressing 16
around the first fill-in stage (Schroeder et al. 2009a; Chapman 1994). The best time for ratoon 17
fertiliser application is when the crop is actively growing and is approximately 0.5 m high. At this 18
stage there is a newly developed root system capable of using fertiliser N (Schroeder et al. 2009a; 19
Chapman 1994). This results in more efficient N uptake and allows the crop to act as a nutrient store. 20
Growers are encouraged to avoid applying N fertiliser too early (i.e. straight after harvest when the 21
crop is unable to take up applied N) or too late (i.e. crop may become N deficient or field entry may be 22
restricted) as there is an increased risk of loss to the surrounding environment (Schroeder et al. 2009a; 23
Chapman 1994). 24
Split application of N fertiliser in ratoons has been suggested as a method that may produce tangible 25
strategy has not resulted in higher cane yields, even in waterlogged soils, the majority of growers 1
continue to apply N in a single application (Chapman 1994; Bieske 1972). Research into aspects of 2
waterlogged soils found that split application did not improve N uptake or final cane yields and could 3
not be associated with any economic or environmental benefits (Kingston et al. 2008). 4
To conserve supplies of legume N for use by the following sugarcane plant crop, it is recommended 5
that the crop residue is either left in situ or surfaced mulched, as opposed to incorporation, to reduce 6
the rate of N mineralisation and potential of leaching losses (Garside and Bell 2001; Garside and Bell 7
1999). 8
There has been widespread adoption of management strategies, including subsurface N-fertiliser 9
application, to reduce N losses from ammonia volatilisation. However, this has not mitigated N losses 10
from denitrification and leaching (Chapman et al. 1991; Vallis and Keating 1994). Subsurface 11
application of N fertiliser has been estimated to increase denitrification and/or leaching losses from 12
21.8% (following surface application) to 40.1% of the applied N (Prasertsak et al. 2002). To reduce 13
denitrification and leaching losses management practices should aim to remove residual nitrate from 14
the soil profile, maintain fertiliser N in the NH4+ form for longer, and lower the NO3-concentration in 15
the soil (Weier 1998; Chen et al. 2008). This may be achieved through the use of nitrification 16
inhibitors or controlled-release fertiliser products in combination with best-practice fertiliser placement 17
and timing (Dalal et al. 2003; Weier 1998). 18
The nitrification process transforms NH4+, a relatively immobile form of N, into NO3- (Barth et al. 19
2001). The first stage of the nitrification process, bacterial oxidation of NH4+ to NO2- by Nitrosomas 20
bacteria, is closely followed by the second stage, conversion of NO2- to NO3- by Nitrobacter bacteria 21
(Zerulla et al. 2001). Nitrification inhibitors have been specifically developed to delay only the first 22
stage of nitrification by depressing the activities of Nitrosomas bacteria in the soil (Zerulla et al. 2001; 23
Barth et al. 2001). This keeps N in the immobile form for longer, thereby reducing N susceptibility to 24
leaching and denitrification losses (Wood et al. 2010b; Barth et al. 2001; Zerulla et al. 2001; Chen et 25
In the past, nitrification products have been too expensive for large-scale agricultural use (Chapman 1
1994; Zerulla et al. 2001). A relatively new nitrification inhibitor, dimethylpyrazol phosphate 2
(DMPP), commercially referred to as ENTEC®, has recently been evaluated in two Australian 3
sugarcane-growing regions on soils with the potential for high denitrification or leaching losses (Wang 4
et al. 2008b; Wang et al. 2012). Although ineffective in reducing N2O emissions in field plots at 5
Murwillumbah and Mackay, emissions in fertilised chambers were significantly reduced at 6
Murwillumbah (Wang et al. 2008b). At another trial in Mackay, the addition of DMPP to urea resulted 7
in significantly lower N2O emissions compared to using normal urea (Wang et al. 2012). 8
Controlled-release fertiliser product technology may also contribute to lower N losses, improved N 9
use efficiency and higher cane yields (Shoji et al. 2001). These products include poly-coated urea and 10
sulphur-coated urea, which can be formulated to have different N release rates (Glendinning et al. 11
2000). Previous research into the use of controlled-release fertilisers in Australian sugarcane crops has 12
not been successful (Chapman 1994). Poly-coated slow-release urea was not successful in reducing 13
N2O emissions from a trial site in Mackay, Queensland (Wang et al. 2008b). However, recent trials 14
have demonstrated that compared to using normal urea, polymer-coated slow-release urea reduced 15
N2O emission from an acid-sulphate soil in NSW by 30% (Wang et al. 2008b). 16
Further research is required under different climatic and soil conditions to substantiate the 17
effectiveness of DMPP on reducing N2O emissions from Australian sugarcane fields (Wang et al. 18
2012). In addition, it appears that the success of slow-release N fertiliser products is affected by the 19
solubility of the product, climate, N uptake by the crop and the soil’s capacity to retain the mineral N 20
from leaching (Wang et al. 2008b). Incorporation of nitrification inhibitors and controlled release 21
fertiliser products into the sugarcane production system will ultimately be determined by their 22
robustness to reduce N losses in a range of soil types and varying climatic conditions, and economics 23
(Chen et al. 2008). Price and commercial availability are likely to have the greatest influence on the 24
Another potential avenue for reducing N losses is the selection of N-efficient sugarcane genotypes. 1
Nitrogen use efficiency (NUE) in plants is complex and refers to the combined efficiencies of internal 2
N use by the plant and N uptake from the soil (and N fertiliser) (Robinson et al. 2007; Robinson et al. 3
2008). Australian sugarcane varieties have not been selected for NUE. However, there is evidence that 4
some of the Australian sugarcane germplasm used for breeding purposes contains considerable 5
genotypic variation for internal NUE (iNUE), i.e. the ability to produce biomass per unit N in plant 6
tissue (Robinson et al. 2007). This suggests there is potential to breed new sugarcane varieties with 7
higher iNUE that could result in the production of significantly more biomass under low N supply 8
(Robinson et al. 2007). Although sugarcane varieties with improved iNUE are not currently available, 9
future N-management strategies may involve planting high iNUE varieties in fields susceptible to 10
denitrification and leaching. 11
It is apparent that N management in Australia focuses on N application rate (i.e. SIX EASY STEPS 12
and N Replacement), fertiliser placement (subsurface) and application timing (matched to crop 13
demand) to improve N uptake by the crop and lower N losses. The benefit of using alternative N 14
forms (nitrification inhibitors and controlled-release products) is still to be validated over a range of 15
climate and soil conditions, but early indications are that they have potential to contribute towards 16
improved N uptake and lower N losses (Wang et al. 2012; Wang et al. 2008b) in the short-term future. 17
A longer-term prospect may be the use of sugarcane varieties with higher iNUE (Robinson et al. 18
2007). Although N application rates have been reduced (both voluntarily and legislatively) in an 19
attempt to reduce N losses by better matching fertiliser inputs to crop requirements, current N 20
calculation methods are limited in their ability to match N fertiliser inputs to forthcoming crop 21
requirements. 22
The SIX EASY STEPS program uses predetermined district yield potential (DYP) values in the 23
determination of N fertiliser recommendations as it assumes that the forthcoming season will be 24
characterised by conditions conducive to producing the yield potential for the district (Schroeder et al. 25