ACKNOWLEDGEMENT
I bow in gratitude to Almighty for all the showers of blessings.
My heartfelt gratitude to my teacher Dr. K. Ranganathan, MDS., MS (Ohio), Ph.D. , Professor and Head of Department of Oral and Maxillofacial Pathology, Ragas Dental College and Hospital for his constant support and encouragement throughout my course. I consider myself extremely lucky to have had the opportunity to study under him. He has always been a source of inspiration to perform better not only in academics but also in life. Thank you so much sir.
I extend my sincere gratitude to Dr. UmaDevi. K. Rao, Professor, Department of Oral and Maxillofacial Pathology, Ragas Dental College and Hospital for her constant guidance, support and her advice in completion of my work. I want to take this opportunity to acknowledge and thank her for the help and support .Thank you mam.
I earnestly thank Professor, Dr.T.Rooban, Department of Oral and Maxillofacial Pathology, Ragas Dental College and Hospital for his encouragement and concern in helping me to complete this study.
My sincere thanks to the principal Dr.N.S.Azhagarasan and Chairman Mr. Kanakaraj, Ragas Dental College and Hospital for their permission to use the facilities of the institution.
I extend my sincere thanks to Readers Dr. N. Lavanya and Dr. C. Lavanya,
Department of Oral and Maxillofacial Pathology, Ragas Dental College and Hospital for their encouragement and support .
I extend my sincere thanks to Senior lecturer Dr. Sudharsan, Dr. Kavitha, Dr.Joseph Department of Oral and Maxillofacial Pathology, Ragas Dental College and Hospital for his help throughout my project.
I extend my sincere thanks to our Geneticist and Lab Manager, Mrs. Kavitha, ourLab Technician, Mr. Rajan, Department of Oral and Maxillofacial Pathology and Attender Mrs .Laila, Ragas Dental College and Hospital for their constant help in completion of my study.
I acknowledge gratefully the help of my batchmates Dr.T.Balammal, Dr.S.Ishwarya, Dr.S.Sivashankari and Dr.D.Rajasekar.
I am dedicating this work to my parents, Mr.R.Dharmalingam, Mrs.D.Sujatha and my grandparents Dr.S.Rathinavel and Mrs. R.Vimala, father in law Mr.Balasubramaniyam, my husband Mr. B.Rajthilak, my son
CONTENTS
1. INTRODUCTION 1
2. AIM AND OBJECTIVE 4
3. MATERIALS AND METHODS 6
4. REVIEW OF LITERATURE 18
5. RESULTS 46
6. DISCUSSION 53
7. SUMMARY AND CONCLUSION 63
8. BIBLIOGRAPHY 65 9. ANNEXURES
I - Institutional Review Board approval form II - Dissertation protocol
III - Verifinger-Proof of issuance certificate IV - Department declaration form
V - Plagiarism check form
VI –Types of enamel rod end patterns (Plate I)
Introduction
1
INTRODUCTION
The word “Forensic” is derived from the latin word “before the
forum”. Forensic science is defined as “areas of endeavour that can be used in
a judicial system and which can be accepted by the court and the forensic
community to separate truthfulness from falsehood4”.
Forensic dentistry is a branch of forensic medicine or science. Forensic
odontology was defined by Keiser “as that branch of odontology which in the
interest of justice deals with the proper handling and examination of dental
evidence and with the proper evaluation and presentation of dental findings4”. The principle of Forensic dentistry is based on that no two mouths are alike
(even identical twins are different) and that teeth like tools, leave recognizable
marks.
Human beings have certain characteristics which are unique, such as
the teeth which are the most indestructible part of the human body. Teeth have
been identified in the mandible of Tabu, a man aged about 35000 years old1. Thus age and individual identification of the person based on teeth was
available from the teeth even after decades and centuries25. Human teeth can survive great physical trauma, as they are strong and durable. Hence, dental
evidence is considered to be a scientifically reliable method of identification.
Introduction
2
the enamel being the hardest part of the body, can last longer than the other
tissues32. Forensic odontology has thus a major role in the identification of deceased human.
Forensic odontology has various applications which include: Age
estimation, bite mark analysis, rugoscopy, cheiloscopy, ameloglyphics, dental
radiographs, Photographic study, Analysis of genetic material and PCR for
Pulp DNA analysis.
Cheiloscopy, rugoscopy, fingerprint analysis and dental pattern for
personal identification are not feasable in the case of fire accidents, mass
disaster where the bodies are damaged completely and only few fragments are
available for identification. Dental evidence particularly enamel is more
appropriate in identifying the individual in their circumstances.
Macroscopically the enamel rod end pattern form a pattern on tooth
surface known as perikymata2. The enamel rods form a unique pattern due to undulating course of ameloblasts during formative stage. Microscopically
groups of enamel rods run in unique direction and it differs from the adjacent
one resulting in different patterns of the enamel rods33.
The enamel rod end pattern is unique for each tooth in an individual. These
enamel rod end patterns could be studied by various methods like acetate peel
Introduction
3
This study was done to analyse the enamel rod pattern by acetate peel
technique in extracted teeth of males and females and their application for
Aim and Objective
4 AIM:
To study the utility of enamel rod patterns in identification of gender in forensic odontology.
OBJECTIVES:
To study the enamel rod end patterns of teeth extracted from N=100
individuals
To compare the enamel rod end patterns of extracted teeth between
males (n=50) and females (n=50).
HYPOTHESIS: (NULL HYPOTHESIS)
There is no difference between the enamel rod end patterns of teeth between gender.
STUDY SETTING
The study was conducted in the Department of Oral and
Maxillofacial Pathology, Ragas Dental College and Hospital, Chennai. This
study was approved by Institutional Review Board (IRB) of Ragas Dental
Aim and Objective
5 STUDY SUBJECTS:
The study sample comprised of 100 extracted teeth, 50 from males and
50 from females. The samples were divided into 4 groups namely: Group I,
Group II, Group III and Group IV.
Group I: 20 Incisors.
Group II: 10 Canines.
Group III: 40 Premolars
Materials and Methods
6
MATERIALS AND METHODS
I. MATERIALS:
0.1mm Cellulose acetate paper
Acetone solvent
37% Orthophosphoric acid
Light microscope
Nikon digital camera
Verifinger standard SDK version 10 software (Neurotechnologija
company, Luthiana)
Extracted Teeth from patients with periodontitis and for orthodontic
purposes
II. INCLUSION CRITERIA:
• Permanent incisor, canine, premolar and molars of male and female
individuals extracted due to periodontitis and for orthodontic purposes
with following consent
• Age – 20 to 90 years
III. EXCLUSION CRITERIA:
• Grossly decayed tooth
• Abraded tooth
Materials and Methods
7 • Restored tooth
• Hypoplastic tooth
IV . METHOD:
In this study, 100 extracted teeth were collected, of which 50 are from males and 50 are from females. There are four different groups – group I
includes incisors(n=20), group II includes canines(n=10), group III includes
premolars(n=40) and group IV includes molars(n=30).
METHODOLOGY:
Step 1: The selected teeth were scaled and polished.
Step 2: To avoid error in positioning the acetate film over recording
area during recordings, a circle of 5-mm diameter was marked on the
comparatively flat area (middle third) on the labial surface of the tooth.
Step 3: The marked area was conditioned with 37% orthophosphoric
acid for 20 seconds.
Step 4: Then the etched surface was washed with distilled water and
dried.
Step 5: A drop of acetone was applied on to the tooth surface and was
covered by a small piece of cellulose acetate film and left undisturbed
for 20 min.
Step 6: The acetone dissolves a layer of cellulose acetate and the
Materials and Methods
8
Step 7: The film was gently peeled after 20 min and observed under
light microscope.
Step 8: Then photomicrograph of the acetate peel was obtained at 10x
magnification and then subjected to biometric analysis using
Verifinger standard SDK version 10.0 software (NEUROtechnology) (Annexure III –Proof of identification)
Step 9: The patterns of enamel rod endings was recognized as series of
lines running in varying directions.
Step 10: The identification of each pattern was obtained by the
software using certain points called minutiae points.
These minutiae points were used by the software to compare the
similarity/variability of two patterns3. The photomicrograph that was subjected to biometric analysis using VeriFinger Standard SDK v10.0 software
(Neurotechnologija Software Systems, Vilnius, Lithuania) , recognizes the
patterns of enamel rod endings as a series of lines running in varying
directions and memorizes them in the database with a specific identification
number and minutiae points on it. Enamel rod end patterns developed by the
software can be stored in the computer for record purposes in the form of
black and white lines (without minutiae points), which can be used for visual
analysis.
Minutiae points are the local ridge discontinuities, which are of two types:
Materials and Methods
9
minutiae. It is these minutiae points which are used for determining
uniqueness of a fingerprint. Automated fingerprint recognition and self
authentication systems can be categorized as verification or identification
systems.Minutiae include:
Ridge ending – the abrupt end of a ridge
Ridge bifurcation – a single ridge that divides into two ridges
Short ridge, or independent ridge – a ridge that commences, travels a short
distance and then ends
Island – a single small ridge inside a short ridge or ridge ending that is not
connected to all other ridges
Ridge enclosure – a single ridge that bifurcates and reunites shortly
afterward to continue as a single ridge
Spur – a bifurcation with a short ridge branching off a longer ridge
Crossover or bridge – a short ridge that runs between two parallel ridges
Delta – a Y-shaped ridge meeting
Materials and Methods
10
SCHEMATIC REPRESENTATION OF MINUTIAE POINTS
Materials and Methods
11
The standardised images were examined visually by the following
method to exclude the variations that could arise due to intra-observer
variation. In each image the top left and right corner, lower left and right
corner and centre were visually examined for the pattern and
Materials and Methods
12
The images were randomly studied to verify the reliability. We
observed that when the procedure was repeated we found 20% margin of
error with respect to recognition of the wavy branched and wavy unbranched
pattern. Therefore in this study we were not able to distinguish these two
patterns and hence considered both the pattern as wavy pattern. Thus in this
study the patterns seen were only seven patterns.
The seven enamel rod patterns which were obtained in this study were
classified based on minutiae points 21.
1. Wavy (Branched, unbranched)
2. Linear (Branched)
3. Linear (Unbranched)
4. Whorl (Open)
5. Whorl (Closed)
6. Loop
Materials and Methods
13
[image:28.595.193.402.178.662.2]TYPES OF ENAMEL ROD END PATTERNS
Fig 1a. Wavy (branched) Pattern
Materials and Methods
14
TYPES OF ENAMEL ROD END PATTERNS
[image:29.595.199.395.183.403.2]
Fig 2. Linear Branched
[image:29.595.199.392.419.646.2]Materials and Methods
15
TYPES OF ENAMEL ROD END PATTERNS
[image:30.595.194.399.180.410.2]
Fig 4. Whorl Open Pattern
[image:30.595.193.404.433.664.2]Materials and Methods
16
TYPES OF ENAMEL ROD END PATTERNS
[image:31.595.195.400.181.639.2]
Fig 6. Stem Pattern
Materials and Methods
17 STATISTICAL ANALYSIS
Datas were entered and analyzed using IBM SPSS software (version
21.0). Pearson’s Chi-square test was done to compare the enamel rod end
patterns between the teeth and between male and female individuals. p value
≤ 0.05 was considered statistically significant.
Review of literature
18
REVIEW OF LITERATURE
INTRODUCTION:
Identification of an individual involves comparison between the known
characteristics of a missing individual (termed ante-mortem data) with
retrieved characteristics from an unknown body (termed post-mortem data).
Like fingerprints human dentition is a hard tissue analogue in finding the
identity of an individual4. The human dentition has diverse characters which
make them unique. Teeth help in estimation of age, determining the sex and
race of a person in decomposed and burnt bodies. Dental evidence has a strong
association in identifying victim’s identity as teeth are relatively resistant to
environmental factors and post mortem proteolysis4.
Dental enamel organization and mineralization contributes to the
hardness of the enamel. Enamel is derived from ectodermal cells and is
formed by ameloblasts. The enamel rods are laid down by ameloblast in an
undulating and inter-twining path which help the teeth to withstand high
tensile strength, which is as patterns of the ends of a series of adjacent enamel
rods. There are various methods to duplicate the enamel rod pattern like
cellulose acetate peel technique, cellophane tape technique, rubber base
impression materials, etc23.
Dental hard tissues can be replicated by peeling technique which is a
simple, inexpensive, and rapid. A set of serially taken peels can easily be
Review of literature
19
topography of tooth structure. After peeling, the peel can be seen under
microscope with incident or transmitted light or with combinations of them. A
peel gives an overall view of a surface, if it is examined before next grinding
and it can be used as a guide for further detailed work (i.e., if a specific area is
marked during the microscopic examination of a peel, the remaining peeled
surface can be used for SEM investigation or thin-section making). At any
time the peeling direction can be changed for three-dimensional visualisation
of examined structures. The etching time can be extended by re-etching the
same surface after each peel and each time either the same or different etching
solutions can be used. Comparison of these peels enables detection of different
mineral species and their distribution. Peels are stable and can be stored37.
Paleobotanist Walton in the year 1928,introduced the acetate peel technique to study the cellular structures of fossil plant. A large number of thin
serial sections are needed to study the three-dimensional structures of dental
hard tissues. Whole sections cannot be made from a single tooth without
decalcification process. Decalcification or partial decalcification of enamel is
time-consuming, needs special equipment and considerable artifacts are
introduced. The acetate peel technique overcomes the disadvantages of
decalcification as it is a rapid way of preparing a large number of sequential,
replicas from an undecalcified, but etched tooth surface. The replicas made by
acetate peel technique is easy to make, inexpensive, does not need
thin-sectioning devices. A peel represents the replica of an acid-etched surface
Review of literature
20
cellular structures of fossil plants was later used by palaeobotanists, carbonate
petrologists and palaeontologists to study the texture and structure of
carbonate rocks and fossils. In the study of dental hard tissues the cellulose
acetate peel procedure was found to be the most efficient. The mineralogical
composition of dental hard tissues is different from those of fossil plants and
carbonate rocks and it is modified to study dental hard tissue37.
Manjunath.K et al in 2011 recorded the enamel rod endings on tooth surface using cellulose acetate peel technique and coined the term
“ameloglyphics.” Ameloglyphics is the study of enamel rod end patterns on
tooth surface. Enamel rod end pattern was unique for each tooth in an
individual and may be used as an adjunct with other methods for personal
identification. This technique is simple, inexpensive and a rapid method which
can be performed by even a dental auxiliary staff. Personal identification by
ameloglyphics is recommended for those individuals working in dangerous
occupations such as fire fighters, soldiers, jet pilots, divers, and people who
live or travel to politically unstable areas prior to their assignments and they
should be checked regularly for the enamel loss due to wear and tear23. Nidhi
et al in 2009 recorded enamel rod end patterns on tooth surface using cellophane tape and revealed that enamel rod end patterns seem to be unique
to an individual; however, they not only found dissimilarities between
different individuals, but also within the same individual5.
Biometrics is the identification of individuals with the help of
Review of literature
21
In 1998, Neurotechnologia developed Verifinger SDK identification software
for biometric system integrators. Verifinger standard SDK version 5.0 is a
biometric software designed to compare and analyze finger prints. This
software can be used successfully to study the pattern of enamel rod endings
on the enamel surface. The software obtains the patterns and subpatterns of
enamel rod endings as series of lines running in varying directions, and
assigns a specific identification number, minutiae score and stores the pattern
in the database27. Ramenzoni and Line et al in 2005 used Verifinger SDK v4.2 software for automated biometric study of Hunter-Schreger bands (HSB)
in enamel for personal identification24. Manjunath.K showed that Verifinger
SDK v5.0 software is a reliable biometric tool for the analysis of enamel rod
end patterns in ameloglyphics23.
HISTORICAL BACKGROUND:
Oommen Nainan et al in 2015 in his study “dental biometrics as an aid in the determination of human identity” mentioned about historical aspects
of forensic sciences. The first case of dental identification began with the
Agrippina and the Lollia Paulina case. After her marriage with Claudius,
Emperor of Rome, in 49 A.D Agrippina, made a plan to secure her position.
Agrippina planned to kill the rich divorcee, Lollia Paulina as Agrippina
thought that she would be rival to her husband. Agrippina sent her own
soldiers to kill Lollia Paulina, they were instructed to bring back her head.
Agripinna was unable to recognize the distorted face; she opened Lollia
Review of literature
22
and then she was satisfied that it was Lollia Paulina. This was the first dental
identification which was recorded35.
The use of features unique to the human dentition as an aid to personal
identification is widely accepted within the forensic field. The teeth as an
evidence is not recent. It has been said that Nero's mistress, Sabina, in 66
A.D., satisfied herself that the head presented to her on a platter was that of
Nero's wife as she was able to recognize a black anterior tooth (Luntz, 1977).
Folklore also ascribes the first use of bite mark identification to King William
the Conqueror, circa 1066 A.D. whose habit was to secure his mail with
sealing wax imprinted with bite. His anterior teeth were malaligned thus
allowing verification of authenticity of his documents (Barker, 1982). In 1897
Dr. Oscar Amoedo wrote his doctoral thesis entitled “L’ Art Dentaire en
Medecine Legale” explaining the utility of dentistry in forensic medicine for
identification (Adams, 2003)35.
Adolf Hitler and his wife Eva Brawn were identified by their teeth at
the end of World War II. In 1453, 80 years old warrior John Talbot, Earl of
Shrews bury, who fell in the battle of Castillon was identified by his teeth and
that was the first formally reported case of dental identification. In 1775
Revere made a silver wire fixed bridge for his friend Dr. Joseph Warren, a
medical practitioner. Warren refused the appointment of surgeon-in-chief to
the continental army in the war and he requested the rank of a line officer.
Unfortunately, Warren was killed by a bullet that pierced his skull in the Battle
Review of literature
23
Fischer was the first anthropologist to describe the furrows on the red
part of the human lips in 1902. Diou de Lille in 1930, developed studies which
led to lip print use in criminology. Edmond Locard in 1932, one of France's
greatest criminologists, appreciated the importance of Cheiloscopy in crime
investigation. Suzuki and Tsuchihashi(1968 to 1971) in the Department of
Forensic Odontology at Tokyo University had examined 1364 persons and
proposed that red part of the human lips has a unique arrangement & patterns
of lines for each human being4.
In 1991, Skinner and Anderson had attempted at individualization
using Striae of Retzius in enamel by correlating it with the known stressors of
life to recognize a missing child, though there was a limitation of age
dependency. An attempt has been made in this study to see if enamel in teeth,
the most durable part of the body could be used in identification of an
Review of literature
24
SEX DETRMINATION- VARIOUS STUDIES IN FORENSIC SCIENCES:
The whole skeleton gives 99-100% accuracy in determining the sex of
an individual. Of all the bones in a body, pelvis identifies the sex of an
individual with 95% accuracy, followed by skull (92%accuracy). Femur, tibia,
ulna, radius, vertebrae, sternum, metatarsals and metacarpals are also useful
in determining the sex of an individual. Sex of an individual is determined by
morphological and morphometric characteristics of bone. The children and
juveniles may have different morphological and morphometric growth
characteristics as they have growth process taking place and hence, methods
for sex determination are practiced on the adult skeleton 11.
Sex classification is 95% more accurate using the adult pelvis (e.g. Phenice, 1969; White and Folkens, 2000; Bruzek, 2002), but about 80% with
the adult skull (e.g. Stewart,1948)8.
SEX DETRMINATION STUDY INVOLVING THE HAND:
Agnihotri et al in 2005 conducted a study in the Department of Forensic Medicine & Toxicology, which included 250 young and healthy
students (125 males and 125 females) in the age group of 18-30 years. They
measured the hand length from distal crease of wrist joint and the most
anterior projecting point i.e. tip of middle finger and the breadth of hand from
the most laterally placed point on the hand of 2nd metacarpal to the most
Review of literature
25
anthropometric sliding and spreading calipers, and measuring tape were used
for the measurement. The hand index was then calculated by dividing the hand
breadth by hand length and multiplied by 100. The data was statistically
analyzed to determine sex by measurements of hand and found that hand index
more than 44 implies a male and less than 44 is that of a female.The average
hand length and breadth were found to be about 1cm greater in males as
compared to females7.
SEX DETRMINATION STUDY INVOLVING THE SKULL:
Murli Lalwani et al in 2012 conducted a craniometric study to identify the difference in intracranial volumes of dry human skulls between
males and females. The study included 160 dry human skulls of which 100 are
males and 60 are females in the department of forensic medicine, during the
year 2005 – 2006. The skulls chosen for the study were of adult age. To
determine the cranial cavity capacity they used dry, hard mustard seed of
uniform size to fill the cranial cavity. Mean cranial capacity of male skulls was
1302.95 + 108.8 c.c., and that of female skulls was 1179.92 + 97.08 c.c. There
was statistical significant difference (p value <0.01) between the intracranial
volume of male and female skulls. Cranial capacity constitutes one of the most
important characters for determining the ethnical differences12.
SEX DETRMINATION STUDY INVOLVING THE FEMUR:
Hema Nidugala et al in 2013 studied the metric assessment of femur using discriminant function analysis in 75 (40 males and 35 females) femora
Review of literature
26
breadth, antero-posterior diameter of lateral condyle, proximal breadth,
vertical diameter of head and neck were studied and analysed with univariate
statistics, multivariate analysis such as discriminant analysis and logistic
regression analysis employing SPSS 13.00 version program. The statistics
was significant for dimorphism (p<0.05). Thus she came with a conclusion
that epicondylar breadth of femur is the best parameter for sex determination
and it is correlated to delayed ossification of growing lower end in males
giving a higher value and due to early maturity dimorphism is less in the
upper end of the bone9.
SEX DETRMINATION STUDY INVOLVING THE PELVIS:
Sudarshan Gupta et al in 2013 studied the significance of total pelvic height and pelvic width in sex determination of human hip bones in
Gujarat region. The study included 100 dried adult human hip bones, out of
them 40 were female and 60 were male bones. Morphometric parameters like
total pelvic height, pelvic width was measured and ratio of pelvic width and
total pelvic height was calculated. Mean value of total pelvic height was
greater in male(193.85 mm) than female(179.45mm), mean value of pelvic
width was also greater in male (137.31 mm ) than female ( 133.24mm). Thus
the mean value of ratio between pelvic width and total pelvic height was
greater in females (0.74) than in males (0.70). The P value <0.0001 value was
Review of literature
27
SEX DETRMINATION STUDIES INVOLVING THE MANDIBLE: Vinay G et al in 2013 studied about human mandible using metrical parameters to identify the sex. In this study they used 250 dry, complete,
undamaged human adult mandibles of a South Indian population and they
were subjected to metrical parameters like bigonial breadth, bicondylar
breadth and mandibular length using a mandibulometer and vernier calipers.
The mandibular length, bigonial breadth and bicondylar breadth showed a
significant statistical gender difference19.
Samatha K et al in 2017 studied the mandibular ramus for determining the sex. He used orthopantomograph for his study. The study
included orthopantomographs of 60 males and 60 females in the age group
ranging between 18 – 45 years. Mandibular ramus measurements were carried
out using Master View 3.0 software.The measurements of the mandibular
ramus was subjected to discriminant function analysis. Maximum ramus
breadth, minimum ramus breadth, condylar height, projective height of ramus,
coronoid height were the parameters included in the study. The P value was
statistically significant ( P < 0.05) which concludes that mandibular ramus
can be used as an adjuvant in sex determination18.
SEX DETRMINATION STUDY INVOLVING THE MAXILLARY SINUS:
Suresh K Sharma et al (2014) studied about the maxillary sinus volume and dimensions using computed tomography scan for gender
Review of literature
28
their maxillary sinus was studied with a series of CT head images on DICOM
viewing software using inbuilt electronic caliper . The study gave a result that
dimension and volume of maxillary sinus of male was larger than female and
was statistically significant with p<0.01 13
SEX DETRMINATION STUDY INVOLVING THE FINGERPRINT RIDGE DENSITY:
Nithin Mathew et al in 2014 in his study, Sex Determination Using Fingerprint Ridge Density in South Indian Population which includes 100
males and 100 females of South Indian Population, aged between 18 and 81
years, studied the possibility of differentiation of gender using fingerprint
ridge density. The upper portion of the radial border of each print was chosen
and the epidermal ridges in a defined area counted to determine the fingerprint
ridge density. The use of Baye’s theorem suggests that a fingerprint ridge
density <14/25mm2 is more likely to be that of a male, and one having ridge
density of >14/25mm2 is more likely to be that of a female. Discriminant
analysis on the study data could derive formulae to predict the sex using
fingerprint ridge density. The results show that fingerprint ridge density can be
used as a tool for sex determination17.
Review of literature
29
SEX DETERMINATION IN FORENSIC ODONTOLOGY:
In forensic odontology there are many methods for determining the sex of
an individual. Some of them are
Bitemark Analysis
Cheiloscopy
Rugoscopy
Role of DNA in dental identifications
Radiography
Ameloglyphics
Dental record of identification
Habits
Photographs
SEX DETERMINATION STUDIES INVOLVING FORENSIC
ODONTOLOGY:
Mujoo Sheetal et al in her study, Cheiloscopy and Palatoscopy: A Novel Tool for Sex Identification involving 40 males and 40 females studied
about the lip prints and rugae pattern. In this study they used the Tsuchihashi
(1970) classification to classify the lip prints and found that Type 1 and 1' lip
pattern (Type1 : clear cut vertical grooves that run across the lips Type 1' :
similar to type 1, but do not cover the entire lip )were the pattern
Review of literature
30
grooves Type 5 : grooves do not fall any of the type 1-4 and cannot be
differentiated morphologically.) were commonly seen in males. They also
studied about the rugae pattern. They studied about the length and shape of the
rugae. There was no statistical significant difference observed in the length of
rugae between males and females. They found a statistically significant
prevalence of curve & wavy form in males and straight rugae pattern in
females14.
The canine can survive for a long period in a dentition which makes
canine as a tool in determining sex. Kaushal et al (2003) found a statistically significant dimorphism in the mandibular canines in 60 subjects in a North
Indian population, of which left canine in the mandible was seen to exhibit
greater sexual dimorphism. They concluded that if the width of the canine is
greater than 7 mm, the probability of the sex of the person under consideration
being male was 100%15.
P Ahuja et al in 2009 studied the application of oral hard and soft tissue structures in sex determination. Adults between 18- 25 years of age
were included in the sample and they were assessed for gender identification
using lip prints, mandibular canine index and upper lip length by soft tissue
analysis. The results were statisticaly analysed which gives that mandibular
canine index and upper lip length were more accurate and specific for sex
determination as compared to lip prints45.
Review of literature
31
sample of 50 extracted teeth of which 25 are from male and 25 from female
individuals aged between 14 and 44 years. The teeth were then split into 5
groups (each group with 5 female and 5 male teeth) and each group was
exposed to controlled temperatures of 200, 400, 600, 800, and 1000 degrees C
for 5 minutes. The coronal pulp was then extracted and the tissue processed
and stained with hematoxylin-eosin. Four male and 4 of female individuals
histological slides were selected randomly, for each temperature level and
were observed by conventional microscopy at 100X magnification, each
showing 50 cells per plate. If 1 cell with visible sex chromatin was seen, it was
considered positive for females. Groups subjected to 200 and 400 degrees C
were only able to evaluate and the test showed 100% accuracy. At 200 degrees
C average number of cells seen to be positive was 15 and at 400 degrees C it
was 11. Thus sex can be detected at these temperatures by observing
chromatin of the Barr body in dental pulp38.
Shankar M Bakannavar et al in 2012 studied about the mesiodistal width of canines to determine the sex of an individual. Study population
comprised of 500 students from Manipal and Udupi, of which 250 are men
and 250 are women in the age group 15–25 years belonging to various parts of
Karnataka. The greatest mesiodistal width of the crown was considered and
was measured three times. The average of the three values was calculated and
taken. The mean value of the mesiodistal crown width of right maxillary
canines of men and women were 7.8+0.45 mm and 7.55+ 0.45 mm
Review of literature
32
maxillary canines of men and women were 7.85+0.45 mm in and 7.6+0.44
mm respectively. The value was statistically significant (P< 0.001) and hence
concluded that sex can be determined by studying about the mesiodistal width
of an individual39.
Prachi Ravikant Naik et al in 2012 studied about the viability of human dental pulp in determination of the sex of an individual by identifying
SRY gene through DNA analysis. In this study they had 20 human tooth pulp
from extracted tooth from the department of oral surgery , YMT dental
college, Navi Mumbai. The 20 teeth were divided into four groups. DNA was
extracted from the pulp using Qiagen DNA kit and subjected to PCR analysis.
The product of PCR was then run in GDS system to visualise the result,
analyse and store them. The result gave 100% accuracy in determining the sex
of an individual43.
Chetan A Pol et al in 2014 did a study on scanning electron microscopic analysis of incinerated teeth to aid in forensic identification. The
study was done with 135 extracted teeth and they were divided into four
groups. Group 1 consisted of healthy unrestored teeth, group 2 consisted of
teeth restored with all ceramic crowns, group 3-teeth restored with class I
composite resin and group 4-teeth restored with class I glass ionomer cement.
The scanning electron microscope study gave fine structural details, needed a
small sample and does not destroy the already fragile specimen. Thus scanning
electron microscope was helpful in the characterization and study of severely
Review of literature
33
Ramandeep S Narang et al in 2014 did a comparative study of mandibular canine index and molar odontometrics to determine the sex of an
individual. The sample included 410 individuals (200 males and 210 females)
of a North Indian population and their age was in the range of 20 to 40 years.
In the study model maximum mesiodistal(MD) diameter of mandibular
canines and first mandibular molars were measured using vernier calipers and
the linear distance between tips of mandibular canines were also measured.
The result was 67.8% accurate in identifying the sex by mandibular canine
index whereas molar odontometrics gave 84% and 79% accuracy for males in
MD dimension of left and right molar respectively followed by 57% and 56%
accuracy for females in MD dimension of left and right molar. Thus the study
concluded that sexual dimorphism of teeth is population specific and among
the North Indian population, MD dimensions in mandibular canine and first
molar helps in sex determination41.
Nidhin et al (2015) studied about gender determination using the mental foramen that included 30 radiographs of males and females . Distance
from the superior and inferior borders of the mental foramen to the lower
border of the mandible of both sides were measured. The superior and inferior
borders of the mental foramen to the lower border of the mandible were
greater in males than in females while the distance for the right and left sides
of an individual were almost similar in both the male and female groups. In
the study, the value is more than 1.447cm in males and the value is equal to or
Review of literature
34
difference in the distance from the mental foramen to the lower border of the
mandible in males and females.16.
Nandita Kottieth Pallam et al in 2016 studied about the bitemark analysis. The sample comprised of thirty subjects with 10 males and 20
females aged 20–30 year with complete set of natural upper and lower anterior
teeth were selected. The alginate impressions were taken from mandibular and
maxillary anterior teeth and die stone models were obtained from each
impression. Overlays were obtained from the biting surfaces of six upper and
six lower anterior teeth by hand tracing from study casts, hand tracing from
wax impressions of the bite surface, radiopaque wax impression method, and
xerographic method. These bitemarks were compared with the overlay
produced digitally. The result was that xerographic method was superior of the
four techniques, with the highest reproducibility for bite mark analysis. This
study evaluated the accuracy of direct comparisons between suspect’s models
and bite marks with indirect comparisons in the form of conventional traced
overlays of suspects and found the xerographic technique to be the best44.
Vineetha Christopher et al in 2017 studied about tooth prints in personal identification. The study includes 80 individuals tooth prints of upper
first premolars obtained after acid etching using cellulose acetate strips. Two
different intervals of digital images of the tooth prints obtained were subjected
to biometric conversion using Verifinger standard software development kit
Review of literature
35
identification system (AFIS) software for comparison of the tooth prints.
Likewise finger prints of the individuals were recorded and subjected to the
same software. Then the AFIS scores obtained from the images were
statistically analyzed using Cronbach’s test. The Cronbach’s test assess the
AFIS scores of two tooth prints at two intervals of time. The result showed
similarity between two tooth prints taken from an individual at two intervals
with wavy pattern tooth print being more common. The tooth prints were
different when compared with other individuals. The result also predicted that
the individuals with whorl pattern finger print had wavy pattern tooth print and
few loop type fingerprints had linear pattern of tooth prints42.
ENAMEL ROD STRUCTURE
Enamel was produced by ectoderm derived cells called ameloblasts.
Enamel rods are the basic structural unit of enamel . Enamel cannot remodel
or remain but retract away from the enamel surface once it is formed and the
tooth has erupted. Enamel prisms morphology reflects the morphology of
ameloblasts in a species-specific manner. Alterations to the matrix are
reflected as defects in the structural organization of enamel.
Macroscopically, incremental pattern of enamel rods is exhibited on
tooth surface as perikymata, but microscopically, groups of enamel rods run in
unique direction, which differ from adjacent group of enamel rods and results
in forming different patterns of enamel rod endings on tooth surface29. It has
Review of literature
36
number varies from tooth to tooth. The length of the rods is greater than the
thickness of the enamel as a result of the oblique direction and wavy
arrangement of the rods. It varies in different portions of the crown of the
tooth, being long in the thicker portions (cuspal area) and short in the thinner
portions (cervical area) . The size and diameter of the enamel rods increase as
they reach the outer surface. Although it is observed that the average diameter
of the enamel rod is 4-5 μm, there is considerable variation along its course. It
has been suggested that the diameter of the enamel rods increases in the ratio
of 1:2 while passing from the dentino-enamel junction to the outer surface.
The shape of the enamel prisms approximates to one of the three main patterns
• Pattern I: Prisms are circular.
• Pattern II: Prisms are aligned in parallel rows.
• Pattern III: Prisms are arranged in staggered rows such that the tail of
prism
Studies with the electron microscope reveal that the enamel rods have
a keyhole or paddle-shaped pattern with a rounded head and a narrow tail
region. The rounded head of each rod fits closely into the concavities between
the heads and tails of the rods on either side. The region between the two
enamel rods in one row, thought to be the interrod substance, actually
represents the tail portion of the enamel rod in the previous row. The rods
measure about 4-5 μm in breadth and 9 μm in length. Many patterns are
Review of literature
37
their head portion near the occlusal or the incisal surface and their tail portion
pointing cervically3.
ORIENTATION OF ENAMEL RODS
The general orientation of the enamel rods is perpendicular to the
dentin surface. In deciduous teeth, the enamel rods lie in a horizontal plane in
the cervical and middle third. They gradually become more oblique in the
incisal and occlusal third and are almost vertical in the incisal edge or the cusp
tip. In permanent teeth, the arrangement is similar to deciduous teeth in the
occlusal and middle third; in the cervical third, the enamel rods show a
rootward inclination or pass outward3.
Review of literature
38
Review of literature
39 AMELOGLYPHICS:
The enamel rod end patterns can be recorded by different methods like
cellulose acetate paper, rubber base impression materials etc . In the present
study a cellophane tape has been used to obtain the replica of enamel surface.
The same cellophane tape is much frequently used method by the fingerprints
experts to obtain an imprint of the finger.
Biometrics refers to identification of individuals using biological traits,
such as those based on retinal or iris scanning, fingerprints, or faces
recognition . Verifinger standard SDK version 10.0 is biometric software
designed to compare and analyze fingerprints5. This could aid as a tool in
decomposed or burned bodies as enamel can resist
decomposition21.
Manjunath K et al in 2008 did a preliminary study on enamel rod end patterns using acetate peel technique and automated biometrics and they
classified the enamel
rod patterns into eight categories21::
1. Wavy (Branched)
2. Wavy (Unbranched)
3. Linear (Branched)
4. Linear (Unbranched)
Review of literature
40 6. Whorl (Closed)
7. Loop
8. Stem-Like
STUDIES INVOLVING AMELOGLYPHICS:
Manjunath et al (2008) in his study “ Enamel rod end patterns: a preliminary study using acetate peel technique and automated biometrics”
collected 30 extracted tooth and tooth prints were obtained by acetate peal
technique. Microphotograph of the acetate peel imprint is subjected to
biometric analysis (Verifinger standard SDK 5.0). They arrived at eight
sub-patterns and they are wavy-branched, wavy unbranched, linear-branched,
linear-unbranched, whorl-open, whorl-closed, loop and stem-like. Each tooth
print was of combination of the eight different sub-patterns. The tooth prints
1 2 3 4
Review of literature
41
obtained were compared both between and within the same individual. None
of the patterns showed intra- and interindividual similarity21.
Joshi Priya Shirish et al (2014) studied about the enamel rod end patterns using acetate peel technique and automated biometrics for personal
identification. They collected 30 extracted teeth from different individuals &
some from same individuals for inter-individual & intra-individual
comparison. Enamel rod end patterns were assessed on photomicrograph of
acetate peel imprints. None of the 30 tooth prints obtained showed distinct
similarity to each other and the tooth prints yielded mainly three distinct sub-
patterns namely linear(branched), linear (un branched) & wavy(branched)22.
Manjunath K et al in 2014 studied about the enamel rod end pattern at different levels of enamel and its significance in ameloglyphics. They used
eighteen maxillary left first premolars in this study. Among those, to select
the abrasive paper among 80-, 400-, 600-grit silicon carbide abrasive papers
three teeth were used and to check the reliability of the abrasive paper five
teeth were used. Ten teeth were used to analyse enamel rod end patterns. The
patterns were analyzed at an interval of 1 μm thickness of enamel from the
tooth surface till the change of third set of pattern to its subsequent pattern.
Biometric analysis of enamel rod end patterns obtained from 10 extracted
teeth revealed that 10%, 60% and 30% of enamel rod end patterns were
similar up to 3 μm, 4 μm and 5 μm depth of enamel, respectively. In this
Review of literature
42
Manjushree Juneja et al in 2016 studied about ameloglyphics for individual identification following high temperature and acid exposure. In this
study 90 tooth prints of 20 freshly extracted maxillary premolar teeth were
obtained and used to record enamel rod end patterns on tooth surface by
cellophane tape technique. Ten teeth were immersed in 36.46% hydrochloric
acid and the tooth prints were obtained at various intervals (5 min, 10 min, and
20 min). The other 10 teeth (one from each patient) were incinerated and
impression was made at various intervals (80o C, 400o C, 600o C, and 750o C).
Tooth prints obtained from different teeth (total of 90 tooth prints) were
analyzed using Verifinger® standard SDK version 5.0 software. All the 20
original tooth prints were distinct from each other and no inter‑individual or
intra‑individual similarity was found. The tooth prints from the same tooth
after it was exposed to acid or heat were reproducible and showed high to very
high similarity with the original tooth print of that particular tooth stored in the
database20.
K.Manjunath et al in 2011 studied about the efficacy of various materials in recording enamel rod endings on tooth surface for personal
identification. The efficacy of cellulose acetate film, cellophane tape, and light
body impression material in recording enamel rod end patterns of tooth
surface for personal identification was analysed. Surface enamel rod endings
of 30 extracted teeth were recorded from the same area of the same tooth for
two times using cellulose acetate film, cellophane tape, and light body
Review of literature
43
subjected to Verifinger standard SDK software for analysis. Minutiae scores
of all enamel rod end patterns obtained using these three imprint materials
were statistically analyzed. This study concluded that cellulose acetate film
was a reliable material for recording enamel rod endings on tooth surface for
personal identification compared with cellophane tape and light body
rubber-base impression material23.
MATERIALS USED IN RECORDING ENAMEL ROD PATTERNS ON
TOOTH SURFACE
In this study for recording the enamel rod end patterns, tooth surface is
first etched by an acid, then followed by acetate peel technique and automated
biometrics for reproducing complete and accurate enamel rod end patterns for
personal identification3.
Acid etching
The acid etching on the enamel results in the removal of the surface
mineral component in the rod and rod sheath. The etching gives an uneven
dissolution of the surface enamel along with the removal of the smear layer
because the rods and rod sheaths have a different mineral density
The acid etching on enamel depends on:
• Kind of acid used.
• Concentration of acid used.
• Duration of etching.
• Type of etchant.
• Duration of rinsing.
Review of literature
44
About 37% orthophosphoric acid in gel form is the most commonly used acid
to condition the enamel for in vivo studies.
Three types of etch patterns can be obtained:
1. Predominant dissolution of prism cores.
2. Predominant dissolution of prism peripheries.
3. No prism structure is evident3.
Peel technique
A peel is a replica of an acid-etched mineral surface, made on acetate
film. Replicas of dental hard tissue surfaces can be made by peel technique
which is simple, inexpensive and rapid method . The peel-making technique
was first developed by palaeobotanists to study the cellular structures of fossil
plants and later used by carbonate petrologists, and palaeontologists to study
the texture and structure of carbonate rocks and fossils. Further modifications
were done to study dental hard structures due to its unique mineralogical
composition26. The peel can be examined under microscope with incident or
transmitted light or with combinations of both and can be stored for posterity.
Biometric analysis
The term “biometrics” refers to identification techniques which are
based on specific physical characteristics. It is a technology of identification or
authentication of a person which transforms a biological, morphological or
behavioural characteristic in a digital value. When the patterns studied are
consistently recognized and provide greater confidence, they are referred to as
Review of literature
45
methodologies such as fingerprint verification, iris scanning and facial
recognition have been steadily improved and refined in automated systems and
softwares, which have the capacity to distinguish individuals reliably. Unique
identification of an individual based on biometric information, should have
certain desirable prerequisite characteristics: Highly unique to each individual,
easily transmittable, able to be acquired as un-intrusively as possible and
Results
46
RESULTS
SAMPLE CHARACTERISTICS:
The study population included 100 extracted teeth from the individuals
who extracted their teeth for orthodontic purpose and due to periodontitis.
They were categorized into four groups. Group I (n=20) comprised of incisors.
Group II (n= 10) comprised of canines. Group III (n=40) comprised of
premolars. Group IV (n=30) comprised of molars. All the samples were
analyzed for the enamel rod end patterns by the biometric software.
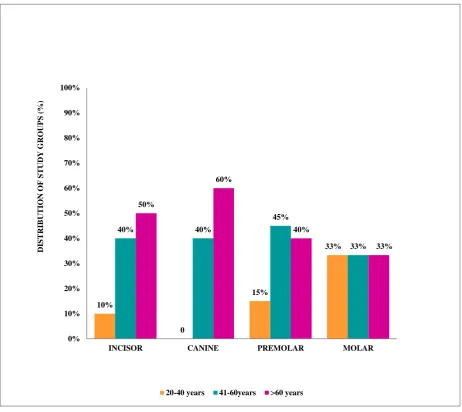
DISTRIBUTION OF AGE IN THE STUDY GROUPS: (TABLE 1 & GRAPH 1):
The distribution of age of the patients was divided into 3 groups:
20-40years, 41-60 years and those above 60 years of age. Group I consisted of 2
(10%) cases in the age group 20-40 years and 8 (40%) cases in the age group
of 41-60 and 10 (50%) cases above 60years . Group II consisted of 4 (40%)
cases in 41-60 years and 6 (60%) cases above 60 years. Group III consisted of
6 (15%) cases in 20-40 years, 18(45%) cases in 41-60 year and 16 (40%) case
of above 60 years. Group IV consisted of 10 (33.3%) cases in 20-40 years, 10
Results
47
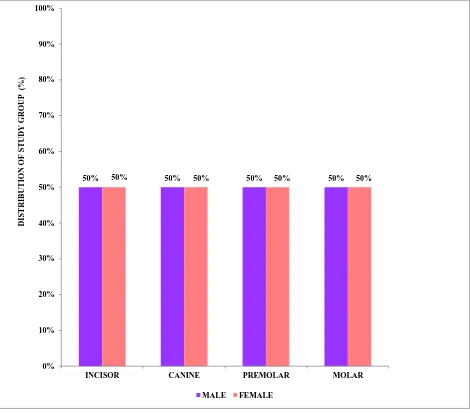
DISTRIBUTION OF GENDER IN THE STUDY GROUPS: (TABLE 2 & GRAPH 2):
In group I, 10 (50%) were males and there was 10 (50%) female. In
group II, 5 (50%) were males and 5(50%) were females. In group III, 20
(50%) were males and 20 (50%) were females. In group 1V, 15 (50%) were
males and 15 (50%) were females.
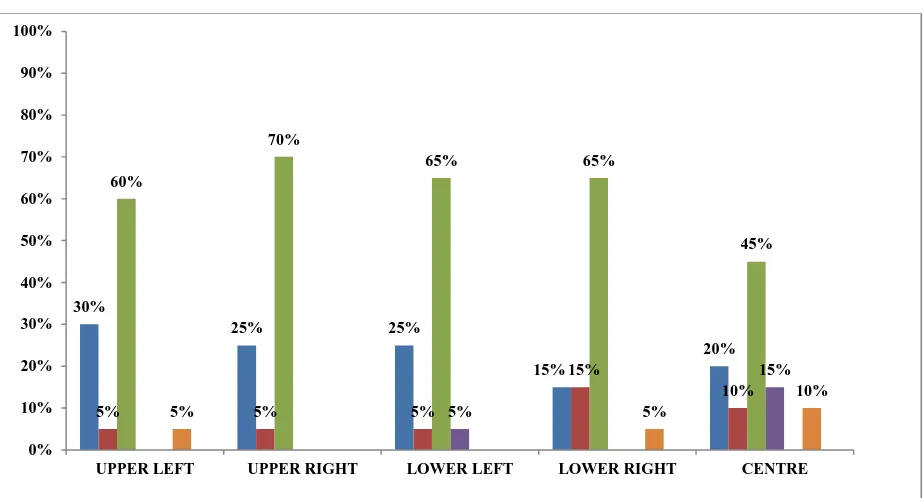
DISTRIBUTION OF ENAMEL ROD PATTERNS IN THE DEFINED POSITIONS IN THE INCISOR TEETH: (TABLE 3 & GRAPH 3)
In group I, 6(30%) in upper left ,5(25%) in upper right, 5(25%) in
lower left, 3(15%) in lower right and 4(20%) in the centre region showed
linear branched pattern, 1(5%) in upper left, 1(5%) in upper right, 1(5%) in
lower left, 3(15%) in lower right and 2(10%) in centre region showed linear
unbranched pattern, 12(60%) in upper left, 14(70%) in upper right, 13(65%) in
lower left, 4(65%) in lower right and 9(45%) in centre region showed wavy ,
1(5%) in lower left and 3(15%) in centre region showed whorl open, 1(5%) in
upper left, 1(5%) in lower right and 2(10%) in centre region showed loop
pattern.
DISTRIBUTION OF ENAMEL ROD PATTERNS IN THE DEFINED POSITIONS IN THE CANINE TEETH (TABLE 4 & GRAPH 4)
In group II, 5(50%) of upper left, 4(40%) of upper right , 6(60%) of
Results
48
linear branched, 2(20%) in upper right and 1(10%) in lower right region
showed linear unbranched pattern, 5(50%) in upper left, 4(40%) in upper
right,4(40%) in lower left, 5 (50%) in lower right and 2(20%) in centre region
showed wavy pattern. 2(20%) and 1(10%) in centre region showed whorl
open and loop pattern.
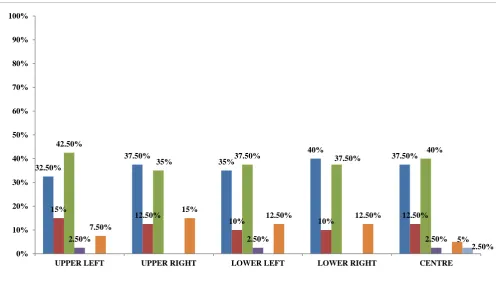
DISTRIBUTION OF ENAMEL ROD PATTERNS IN THE DEFINED POSITIONS IN THE PREMOLAR TEETH (TABLE 5 & GRAPH 5)
In group III, 13(32.5%) of upper left, 15(37.5%) of upper right,
14(35%) of lower left, 16(40%) in lower right and 15(37.5%) in the centre
region showed linear branched pattern, 6(15%) in upper left, 5(12.5%) in
upper right, 4(10%) in lower left, 4(10%) in lower right and 5(12.5%) in the
centre region showed linear unbranched pattern, 17(42.5%) of upper left,
14(35%) in upper right 15(37.5%) in lower left, 15(37.5%) of lower right and
16(40%) of centre region showed wavy pattern, 1(2.5%) in upper left, 1(2.5%)
in lower left and 1(2.5%) in centre region showed whorl open pattern, 3(7.5%)
in upper left, 6(15%) in upper right, 6(15%) in lower left, 5(12.5%) in lower
right and 2(5%) in the centre region showed loop pattern, 1(2.5%) in the
centre region showed stem pattern.
DISTRIBUTION OF ENAMEL ROD PATTERNS IN THE DEFINED POSITIONS IN THE MOLAR TEETH (TABLE 6 & GRAPH 6)
In group IV, 12(40%) of upper left, 9(30%) of upper right, 10(33.3%)
Results
49
4(13.3%) of upper left, 5(16.7%) of upper right, 2(6.7%) of lower left, lower
right, and the centre region showed linear unbranched pattern, 12(40%) of
upper left, 16(53.4%) of upper right, 13(43.3%) of lower left, 14(46.6%) of
lower right and 9(30%) of the centre region showed wavy pattern, 1(3.3%)
of upper left and 4(13.3%) of the centre region showed whorl open pattern,
1(3.3%) of the centre region showed whorl close pattern, 1(3.3%) of upper
left, 5(16.7%) of lower left, 4(13.3%) of lower right and 4(13.3%) of the
centre region showed loop pattern.
PROPORTIONS OF RECORDED ENAMEL ROD PATTERNS IN EACH TYPE OF TEETH (TABLE 7 & GRAPH 7)
In group I 6(30%) showed linear branched, 4(20%) showed linear
unbranched, 15(75%) showed wavy , 4(20%) showed whorl open and 4(20%)
showed loop pattern. In group II 6(60%) showed linear branched pattern,
2(20%) showed linear unbranched, 5(50%) showed wavy, 2(20%) showed
whorl open and 1(10%) showed loop pattern. In group III 20(50%) showed
linear branched, 13(32.5%) showed linear unbranched, 25(62.5%) showed
wavy, 3(7.5%) showed whorl open, 14(35%) showed loop and 1(2.5%)
showed stem pattern. In group IV 16(53.3%) showed linear branched,
7(23.3%) showed linear unbranched, 19(63.3%) showed wavy , 5(16.7%)
showed whorl open, 1(3.3%) showed whorl close and 10(33.3%) showed loop
Results
50
COMPARISON OF DISTRIBUTION OF THE ENAMEL ROD END PATTERNS BETWEEN GENDER(N=100) (TABLE 8 & GRAPH 8 ) In males 25(50%) showed linear branched, 14(28%) showed linear unbranched, 32(64%) showed wavy, 9(18%) showed whorl open, 14(28%)
showed loop and 1(2%) showed stem pattern. In females 23(46%) showed
linear branched, 12(24%) showed linear unbranched, 32(64%) showed wavy,
5(10%) showed whorl open, 1(2%) showed whorl close and 15(30%) showed
loop pattern. There was no significant difference in the distribution of the
enamel rod end patterns between gender.
COMPARISON OF DISTRIBUTION OF THE ENAMEL ROD END
PATTERNS BETWEEN AGE GROUPS (N=100) (TABLE 9 & GRAPH 9 )
In the age group 20-40years, 7(35%) showed linear branched, 3(15%)
showed linear unbranched, 17(85%) showed wavy branched, 4(20%) showed
wavy unbranched, 2(10%) showed whorl open, 8(40%) showed loop pattern.
In the age group 41-60years, 24(63.2%) showed linear branched, 16(42.1%)
showed linear unbranched, 18(47.4%) showed wavy branched, 2(5.3%)
showed wavy unbranched, 6(15.8%) showed whorl open and 8(21.1%)
showed loop pattern. In age group greater than 60years, 17(40.5%) showed
linear branched, 7(16.7%) showed linear unbranched, 28(66.7%) showed
wavy, 6(14.3%) showed whorl open, 1(2.4%) showed whorl close and
Results
51
unbranched and wavy branched pattern in the age groups. (p=0.016 & p
=0.015)
COMPARISON OF THE INDIVIDUAL TEETH OF MALE AND FEMALE WITH PATTERNS (N=100) (TABLE 10 & GRAPH 10, TABLE 11 & GRAPH 11, TABLE 12 & GRAPH 12, TABLE 13 & GRAPH 13, TABLE 14 & GRAPH 14, TABLE 15 & GRAPH 15, TABLE 16 & GRAPH 16)
In males, 2(4.17%) of incisors, 4(8.33%) of canines, 11(22.91%) of
premolars and 8(16.66%) of molars showed linear branched pattern. In
females, 4(8.33%) of incisors, 2(4.17%) of canines, 9(18.75%) of premolars
and 8(18.66%) of molars showed linear branched pattern.
In males, 1(3.84%) of incisors, 2(7.7%) of canines, 7(26.92%) of
premolars and 4(15.38%) of molars showed linear unbranched pattern. In
females, 3(11.53%) of incisors, 6(2307%) of premolars and 3(11.52%) of
molars showed linear unbranched pattern.
In males, 8(12.5%) of incisors, 2(3.12%) of canines, 13(20.38%) of
premolars and 9(14.06%) of molars showed wavy branched pattern. In
females, 7(10.93%) of incisors, 3(4.7%) of canines, 12(18.75%) of premolars
and 10(15.62%) of molars showed wavy branched pattern.
In males, 3(21.4%) of incisors, 2(14.3%) of premolars and 4(28.6%) of
molars showed wavy pattern. In females, 1(7.14%) of incisors, 2(14.3%) of
canines, 1(7.1%) of premolars and 1(7.1%) of molars showed whorl close
Results
52
In females, 1(100%) of molars showed whorl close pattern.
In males, 2(6.9%) of incisors, 1(3.4%) of canines, 7(24.13%) of
premolars and 4(13.8%) of molars showed loop pattern. In females, 2(6.9%)
of incisors, 7(24.3%) of premolars and 6(20.7%) of molars showed loop
pattern.
In males 1(100%) of premolars showed stem pattern. There was no
TABLE 1:DISTRIBUTION OF AGE IN THE STUDY GROUPS (N=100) AGE (N=100) AGE INCISOR n=20 CANINE n=10 PREMOLAR n=40 MOLAR
n=30 p VALUE
20-40 2(10%) 0 6(15%) 10(33.3%)
0.181
41-60 8(40%) 4(40%) 18(45%) 10(33.3%)
>60 10(50%) 6(60%) 16(40%) 10(33.3%)
GRAPH 1: DISTRIBUTION OF AGE IN STUDY GROUPS (N=100)
10%
0
15%
33%
40% 40%
45% 33% 50% 60% 40% 33% 0% 10% 20% 30% 40% 50% 60% 70% 80% 90% 100%
INCISOR CANINE PREMOLAR MOLAR
D IS T R IB U T ION OF ST U D Y GR OU PS ( % )
TABLE 2: DISTRIBUTION OF GENDER IN THE STUDY GROUPS (N=100) GENDER (N=100) GENDER INCISOR n=20 CANINE n=10 PREMOLAR n=40 MOLAR
n=30 p VALUE
MALE 10(50%) 5(50%) 20(50%) 15(50%) 1.00
FEMALE 10(50%) 5(50%) 20(50%) 15(50%)
GRAPH 2: DISTRIBUTION OF GENDER IN STUDY GROUPS(N=100)
50% 50% 50% 50% 50% 50% 50% 50%
0% 10% 20% 30% 40% 50% 60% 70% 80% 90% 100%
INCISOR CANINE PREMOLAR MOLAR