Permanent and Fixed-term Exclusions from Schools in Wales, 2013/14
This annual Statistical First Release reports on exclusions of pupils from primary, secondary and special schools in Wales from 2011/12 to 2013/14. The information it contains are based on pupil-level
exclusions data collected via the January Pupil-Level Annual School Census (PLASC). This is the first time that such data have been published from this source, so it is not advised to make comparisons between this Statistical First Release and previously-published exclusions data. Please see the notes for more information.
Please also note that exclusions relate to occurrences rather than pupils (i.e. a pupil excluded from two schools within a year would be recorded twice).
Statistician: Stephen Hughes Tel: 029 2082 3599 E-mail: [email protected]
Next update: September 2016 (provisional)
Twitter: www.twitter.com/statisticswales | www.twitter.com/ystadegaucymru
SDR 154/2015 29 September 2015
Chart 1: Rate of exclusions from maintained schools in Wales
0 5 10 15 20 25 30 35
2011/12 2012/13 2013/14
R
at
e
p
e
r
1,
00
0
p
u
p
ils
Fixed (5 days or less) Fixed (over 5 days) Permanent
The rate of fixed-term exclusions has been falling since 2011/12. The rate of permanent exclusions has not changed in this time.
In 2013/14 there were:
0.2
permanent exclusions,26.7
fixed-term exclusions (5 days or less), and1.6
fixed-term exclusions (over 5 days)per 1,000 pupils (Table 1).
Tables 4 and 5 show that there were higher rates of exclusions among pupils who:
Contents
PageChart 1 Rate of exclusions from maintained schools in Wales 1 Table 1 Exclusions from maintained schools in Wales, by school type 3
Exclusions by local authority
Table 2a Permanent exclusions from maintained schools in Wales, by local authority and
consortium 4
Table 2b Fixed-term exclusions (5 days or less) from maintained schools in Wales, by local
authority and consortium 5
Table 2c Fixed-term exclusions (over 5 days) from maintained schools in Wales, by local
authority and consortium 6
Reasons for exclusions
Table 3 Exclusions from maintained primary, secondary and special schools in Wales, by
reason for exclusion 7
Chart 2 Percentage of all exclusions, by reason for exclusion 8
Exclusions by pupil characteristics
Table 4 Exclusions from maintained primary, secondary and special schools in Wales, by free
school meal (FSM) entitlement 9
Table 5 Exclusions from maintained primary, secondary and special schools in Wales, by
provision for special educational need (SEN) 10
Table 6 Exclusions from maintained primary, secondary and special schools in Wales, by ethnic background
11
Additional information
Notes 13
Introduction
Chart 1 shows how the rate of permanent and fixed-term exclusions from maintained schools in Wales has changed over time.
Table 1 shows the breakdown of permanent and fixed-term exclusions by school type.
Tables 2a, 2b and 2c show the numbers and rates of permanent and fixed-term exclusions by local authority and consortium. These tables include exclusions from all maintained primary, secondary and special schools.
Table 3 and Chart 2 report on the reasons given for exclusions.
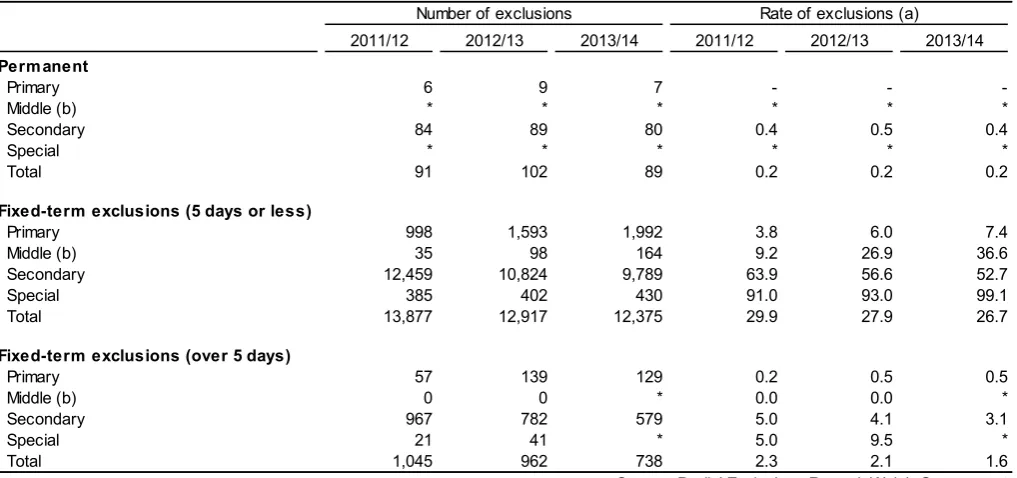
Table 1: Exclusions from maintained schools in Wales, by school type
Number of exclusions Rate of exclusions (a) 2011/12 2012/13 2013/14 2011/12 2012/13 2013/14
Permanent
Primary 6 9 7 - -
Middle (b) * * * * * *
Secondary 84 89 80 0.4 0.5 0.4
Special * * * * * *
Total 91 102 89 0.2 0.2 0.2
Fixed-term exclusions (5 days or less)
Primary 998 1,593 1,992 3.8 6.0 7.4
Middle (b) 35 98 164 9.2 26.9 36.6
Secondary 12,459 10,824 9,789 63.9 56.6 52.7
Special 385 402 430 91.0 93.0 99.1
Total 13,877 12,917 12,375 29.9 27.9 26.7
Fixed-term exclusions (over 5 days)
Primary 57 139 129 0.2 0.5 0.5
Middle (b) 0 0 * 0.0 0.0 *
Secondary 967 782 579 5.0 4.1 3.1
Special 21 41 * 5.0 9.5 *
Total 1,045 962 738 2.3 2.1 1.6
Source: Pupils' Exclusions Record, Welsh Government
(a) Rate per 1,000 pupils. Full- and part-time pupils of all ages.
(b) In 2012/13, middle schools provided exclusions data for the primary or secondary schools that merged to form them in 2011/12. That is w hy, although there w ere no middle schools in 2011/12, exclusions data have been recorded against middle schools for this year.
The rate of permanent exclusions per 1,000 pupils has not changed in three years. In the 2013/14 academic year, as in the two years before, there were 0.2 permanent exclusions per 1,000 pupils. Fixed-term exclusions have been falling since 2011/12. In 2011/12 there were 29.9 fixed-term
exclusions of 5 days or less per 1,000 pupils. This rate dropped by 3.2 to 26.7 exclusions per 1,000 pupils in 2013/14. The rate of fixed term exclusions of 6 days or more fell from 2.3 to 1.6 exclusions per 1,000 pupils between 2011/12 and 2013/14.
Special schools had the highest rate of fixed-term exclusions of 5 days or less. In all maintained schools in 2013/14:
0.2
the rate of permanent exclusions per 1,000 pupils.26.7
the rate of fixed-term exclusions of 5 days or less per 1,000 pupils.1.6
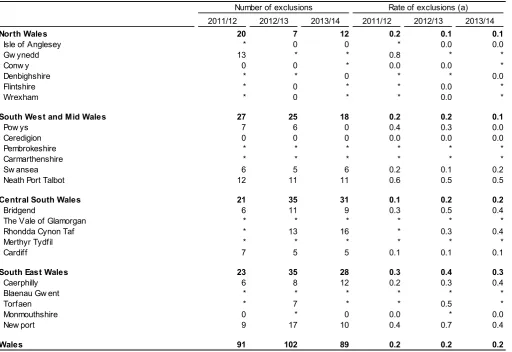
the rate of fixed-term exclusionsTable 2a: Permanent exclusions from maintained schools in Wales, by local authority
and consortium
Number of exclusions Rate of exclusions (a) 2011/12 2012/13 2013/14 2011/12 2012/13 2013/14
North Wales 20 7 12 0.2 0.1 0.1
Isle of Anglesey * 0 0 * 0.0 0.0
Gw ynedd 13 * * 0.8 * *
Conw y 0 0 * 0.0 0.0 *
Denbighshire * * 0 * * 0.0
Flintshire * 0 * * 0.0 *
Wrexham * 0 * * 0.0 *
South West and Mid Wales 27 25 18 0.2 0.2 0.1
Pow ys 7 6 0 0.4 0.3 0.0
Ceredigion 0 0 0 0.0 0.0 0.0
Pembrokeshire * * * * * *
Carmarthenshire * * * * * *
Sw ansea 6 5 6 0.2 0.1 0.2
Neath Port Talbot 12 11 11 0.6 0.5 0.5
Central South Wales 21 35 31 0.1 0.2 0.2
Bridgend 6 11 9 0.3 0.5 0.4
The Vale of Glamorgan * * * * * *
Rhondda Cynon Taf * 13 16 * 0.3 0.4
Merthyr Tydfil * * * * * *
Cardiff 7 5 5 0.1 0.1 0.1
South East Wales 23 35 28 0.3 0.4 0.3
Caerphilly 6 8 12 0.2 0.3 0.4
Blaenau Gw ent * * * * * *
Torfaen * 7 * * 0.5 *
Monmouthshire 0 * 0 0.0 * 0.0
New port 9 17 10 0.4 0.7 0.4
Wales 91 102 89 0.2 0.2 0.2
Source: Pupils' Exclusions Record, Welsh Government
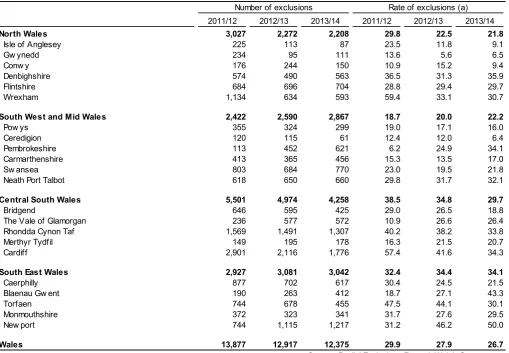
Table 2b: Fixed-term exclusions (5 days or less) from maintained schools in Wales, by
local authority and consortium
Number of exclusions Rate of exclusions (a) 2011/12 2012/13 2013/14 2011/12 2012/13 2013/14
North Wales 3,027 2,272 2,208 29.8 22.5 21.8
Isle of Anglesey 225 113 87 23.5 11.8 9.1
Gw ynedd 234 95 111 13.6 5.6 6.5
Conw y 176 244 150 10.9 15.2 9.4
Denbighshire 574 490 563 36.5 31.3 35.9
Flintshire 684 696 704 28.8 29.4 29.7
Wrexham 1,134 634 593 59.4 33.1 30.7
South West and Mid Wales 2,422 2,590 2,867 18.7 20.0 22.2
Pow ys 355 324 299 19.0 17.1 16.0
Ceredigion 120 115 61 12.4 12.0 6.4
Pembrokeshire 113 452 621 6.2 24.9 34.1
Carmarthenshire 413 365 456 15.3 13.5 17.0
Sw ansea 803 684 770 23.0 19.5 21.8
Neath Port Talbot 618 650 660 29.8 31.7 32.1
Central South Wales 5,501 4,974 4,258 38.5 34.8 29.7
Bridgend 646 595 425 29.0 26.5 18.8
The Vale of Glamorgan 236 577 572 10.9 26.6 26.4
Rhondda Cynon Taf 1,569 1,491 1,307 40.2 38.2 33.8
Merthyr Tydfil 149 195 178 16.3 21.5 20.7
Cardiff 2,901 2,116 1,776 57.4 41.6 34.3
South East Wales 2,927 3,081 3,042 32.4 34.4 34.1
Caerphilly 877 702 617 30.4 24.5 21.5
Blaenau Gw ent 190 263 412 18.7 27.1 43.3
Torfaen 744 678 455 47.5 44.1 30.1
Monmouthshire 372 323 341 31.7 27.6 29.5
New port 744 1,115 1,217 31.2 46.2 50.0
Wales 13,877 12,917 12,375 29.9 27.9 26.7
Source: Pupils' Exclusions Record, Welsh Government
(a) Rate per 1,000 pupils. Full- and part-time pupils of all ages.
Newport had the highest rate of fixed-term exclusions of 5 days or less from maintained schools in 2013/14.
Ceredigion had the lowest rate of fixed-term exclusions of 5 days or less in 2013/14.
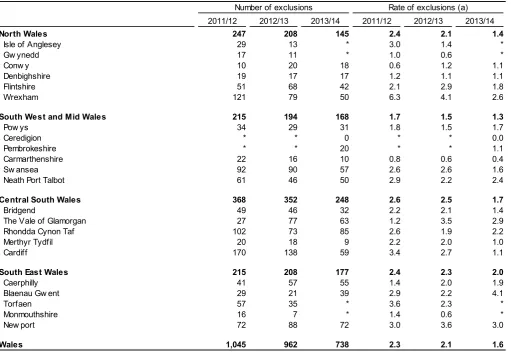
Table 2c: Fixed-term exclusions (over 5 days) from maintained schools in Wales, by local
authority and consortium
Number of exclusions Rate of exclusions (a) 2011/12 2012/13 2013/14 2011/12 2012/13 2013/14
North Wales 247 208 145 2.4 2.1 1.4
Isle of Anglesey 29 13 * 3.0 1.4 *
Gw ynedd 17 11 * 1.0 0.6 *
Conw y 10 20 18 0.6 1.2 1.1
Denbighshire 19 17 17 1.2 1.1 1.1
Flintshire 51 68 42 2.1 2.9 1.8
Wrexham 121 79 50 6.3 4.1 2.6
South West and Mid Wales 215 194 168 1.7 1.5 1.3
Pow ys 34 29 31 1.8 1.5 1.7
Ceredigion * * 0 * * 0.0
Pembrokeshire * * 20 * * 1.1
Carmarthenshire 22 16 10 0.8 0.6 0.4
Sw ansea 92 90 57 2.6 2.6 1.6
Neath Port Talbot 61 46 50 2.9 2.2 2.4
Central South Wales 368 352 248 2.6 2.5 1.7
Bridgend 49 46 32 2.2 2.1 1.4
The Vale of Glamorgan 27 77 63 1.2 3.5 2.9
Rhondda Cynon Taf 102 73 85 2.6 1.9 2.2
Merthyr Tydfil 20 18 9 2.2 2.0 1.0
Cardiff 170 138 59 3.4 2.7 1.1
South East Wales 215 208 177 2.4 2.3 2.0
Caerphilly 41 57 55 1.4 2.0 1.9
Blaenau Gw ent 29 21 39 2.9 2.2 4.1
Torfaen 57 35 * 3.6 2.3 *
Monmouthshire 16 7 * 1.4 0.6 *
New port 72 88 72 3.0 3.6 3.0
Wales 1,045 962 738 2.3 2.1 1.6
Source: Pupils' Exclusions Record, Welsh Government
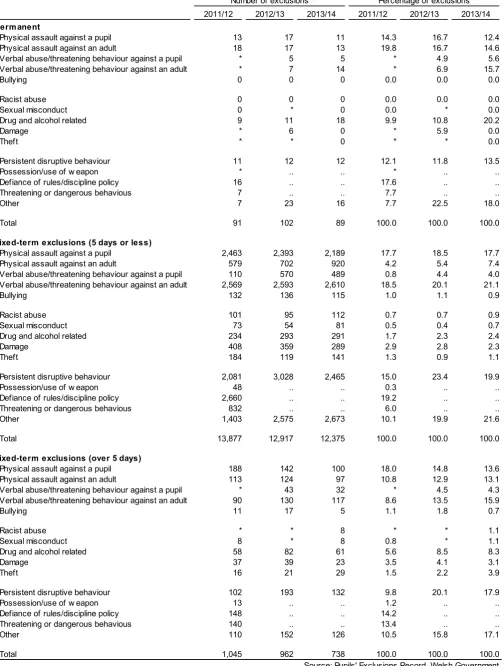
Table 3: Exclusions from maintained primary, secondary and special schools in Wales,
by reason for exclusion
Number of exclusions Percentage of exclusions 2011/12 2012/13 2013/14 2011/12 2012/13 2013/14
Permanent
Physical assault against a pupil 13 17 11 14.3 16.7 12.4
Physical assault against an adult 18 17 13 19.8 16.7 14.6
Verbal abuse/threatening behaviour against a pupil * 5 5 * 4.9 5.6
Verbal abuse/threatening behaviour against an adult * 7 14 * 6.9 15.7
Bullying 0 0 0 0.0 0.0 0.0
Racist abuse 0 0 0 0.0 0.0 0.0
Sexual misconduct 0 * 0 0.0 * 0.0
Drug and alcohol related 9 11 18 9.9 10.8 20.2
Damage * 6 0 * 5.9 0.0
Theft * * 0 * * 0.0
Persistent disruptive behaviour 11 12 12 12.1 11.8 13.5
Possession/use of w eapon * .. .. * .. ..
Defiance of rules/discipline policy 16 .. .. 17.6 .. ..
Threatening or dangerous behavious 7 .. .. 7.7 .. ..
Other 7 23 16 7.7 22.5 18.0
Total 91 102 89 100.0 100.0 100.0
Fixed-term exclusions (5 days or less)
Physical assault against a pupil 2,463 2,393 2,189 17.7 18.5 17.7
Physical assault against an adult 579 702 920 4.2 5.4 7.4
Verbal abuse/threatening behaviour against a pupil 110 570 489 0.8 4.4 4.0 Verbal abuse/threatening behaviour against an adult 2,569 2,593 2,610 18.5 20.1 21.1
Bullying 132 136 115 1.0 1.1 0.9
Racist abuse 101 95 112 0.7 0.7 0.9
Sexual misconduct 73 54 81 0.5 0.4 0.7
Drug and alcohol related 234 293 291 1.7 2.3 2.4
Damage 408 359 289 2.9 2.8 2.3
Theft 184 119 141 1.3 0.9 1.1
Persistent disruptive behaviour 2,081 3,028 2,465 15.0 23.4 19.9
Possession/use of w eapon 48 .. .. 0.3 .. ..
Defiance of rules/discipline policy 2,660 .. .. 19.2 .. ..
Threatening or dangerous behavious 832 .. .. 6.0 .. ..
Other 1,403 2,575 2,673 10.1 19.9 21.6
Total 13,877 12,917 12,375 100.0 100.0 100.0
Fixed-term exclusions (over 5 days)
Physical assault against a pupil 188 142 100 18.0 14.8 13.6
Physical assault against an adult 113 124 97 10.8 12.9 13.1
Verbal abuse/threatening behaviour against a pupil * 43 32 * 4.5 4.3
Verbal abuse/threatening behaviour against an adult 90 130 117 8.6 13.5 15.9
Bullying 11 17 5 1.1 1.8 0.7
Racist abuse * * 8 * * 1.1
Sexual misconduct 8 * 8 0.8 * 1.1
Drug and alcohol related 58 82 61 5.6 8.5 8.3
Damage 37 39 23 3.5 4.1 3.1
Theft 16 21 29 1.5 2.2 3.9
Persistent disruptive behaviour 102 193 132 9.8 20.1 17.9
Possession/use of w eapon 13 .. .. 1.2 .. ..
Defiance of rules/discipline policy 148 .. .. 14.2 .. ..
Threatening or dangerous behavious 140 .. .. 13.4 .. ..
Other 110 152 126 10.5 15.8 17.1
Total 1,045 962 738 100.0 100.0 100.0
21.3
20.8
19.8 17.4
7.8 4.0
Chart 2: Percentage of all exclusions, by reason for exclusion
Other
Verbal abuse/threatening behaviour against an adult
Persistent disruptive behaviour
Physical assault against a pupil
Physical assault against an adult
Verbal abuse/threatening behaviour against a pupil
Less common reasons
20.2 per cent of permanent exclusions in 2013/14 were ‘Drug and alcohol related’.
21.6 per cent of fixed-term exclusions of 5 days or less in 2013/14 were for ‘Other’ reasons.
17.9 per cent of fixed-term exclusions over 5 days in 2013/14 were because of ‘Persistent disruptive behaviour’.
These were the most common reasons given for each type of exclusion.
The chart above shows the percentage of exclusions in 2013/14 that were recorded against each reason for exclusion. The chart includes all permanent and fixed-term exclusions. Although all reasons for exclusions are included in the chart, only the six most common reasons are highlighted. 21.3 per cent of all exclusions were for ‘Other’ reasons. This was the most common reason given for
exclusions in 2013/14. It suggests that the majority of exclusions could not be recorded against any of the other categories.
The second most common reason for exclusions was ‘Verbal abuse/threatening behaviour against an adult’.
In 2013/14:
Drug and alcohol related
was the most common reason for permanent exclusions.Other
was the most common reason for fixed-term exclusions (5 days or less).Persistent disruptive behaviour
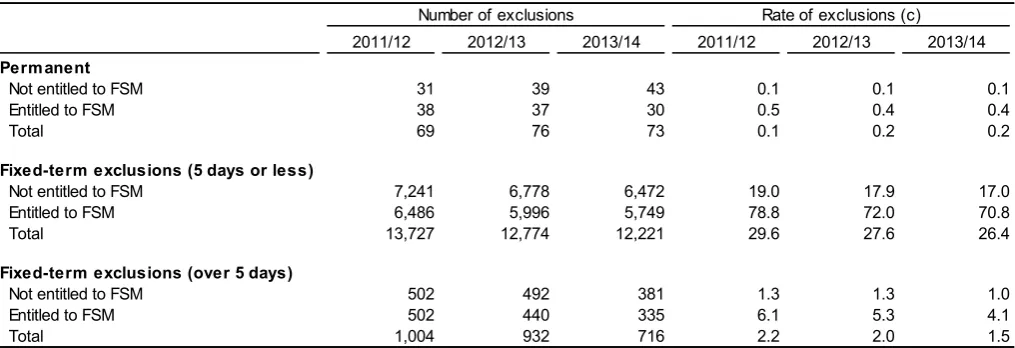
was the most common reason forTable 4: Exclusions from maintained primary, secondary and special schools in Wales,
by free school meal (FSM) entitlement (a) (b)
Number of exclusions Rate of exclusions (c) 2011/12 2012/13 2013/14 2011/12 2012/13 2013/14
Permanent
Not entitled to FSM 31 39 43 0.1 0.1 0.1
Entitled to FSM 38 37 30 0.5 0.4 0.4
Total 69 76 73 0.1 0.2 0.2
Fixed-term exclusions (5 days or less)
Not entitled to FSM 7,241 6,778 6,472 19.0 17.9 17.0
Entitled to FSM 6,486 5,996 5,749 78.8 72.0 70.8
Total 13,727 12,774 12,221 29.6 27.6 26.4
Fixed-term exclusions (over 5 days)
Not entitled to FSM 502 492 381 1.3 1.3 1.0
Entitled to FSM 502 440 335 6.1 5.3 4.1
Total 1,004 932 716 2.2 2.0 1.5
Source: Pupils' Exclusions Record, Welsh Government
(a) See the Notes section for an explanation of free school meal entitlement.
(b) Data w ere created by matching records in the Pupils' Exclusions Record to the Pupil-Level Annual School Census (PLASC). Exclusions w ere not included if no match could be made, so totals may differ from figures published elsew here. See the notes section for information regarding this process and the number of exclusions that w ere excluded.
(c) Rate per 1,000 pupils. Full- and part-time pupils of all ages.
Pupils entitled to free school meals were four times more likely to be excluded than pupils not entitled to free school meals.
For every 1,000 pupils who were not entitled to free school meals in 2013/14 there were 17.0 fixed-term exclusions of 5 days or less. For every 1,000 pupils who were entitled to free school meals there were 70.8 fixed-term exclusions of 5 days or less. That is more than four times the number of
exclusions among pupils not entitled to free school meals. In 2013/14:
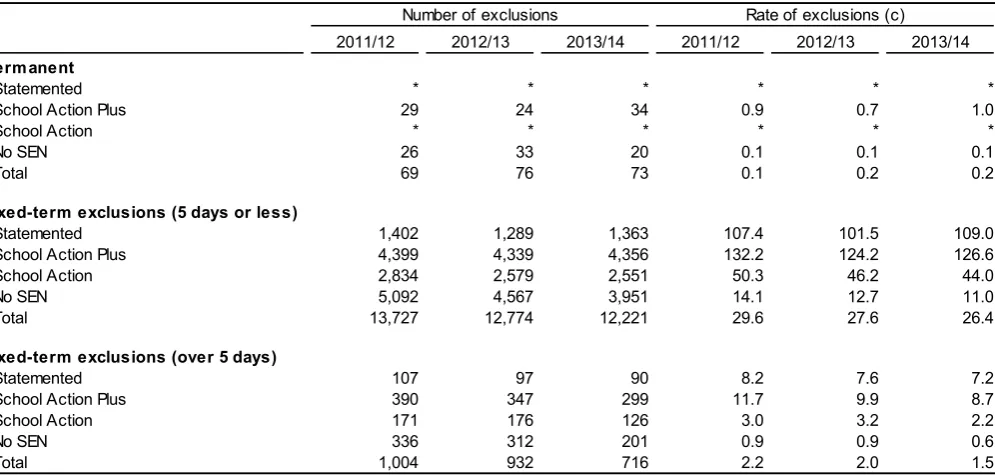
Table 5: Exclusions from maintained primary, secondary and special schools in Wales,
by provision for special educational need (SEN) (a) (b)
Number of exclusions Rate of exclusions (c) 2011/12 2012/13 2013/14 2011/12 2012/13 2013/14
Permanent
Statemented * * * * * *
School Action Plus 29 24 34 0.9 0.7 1.0
School Action * * * * * *
No SEN 26 33 20 0.1 0.1 0.1
Total 69 76 73 0.1 0.2 0.2
Fixed-term exclusions (5 days or less)
Statemented 1,402 1,289 1,363 107.4 101.5 109.0
School Action Plus 4,399 4,339 4,356 132.2 124.2 126.6
School Action 2,834 2,579 2,551 50.3 46.2 44.0
No SEN 5,092 4,567 3,951 14.1 12.7 11.0
Total 13,727 12,774 12,221 29.6 27.6 26.4
Fixed-term exclusions (over 5 days)
Statemented 107 97 90 8.2 7.6 7.2
School Action Plus 390 347 299 11.7 9.9 8.7
School Action 171 176 126 3.0 3.2 2.2
No SEN 336 312 201 0.9 0.9 0.6
Total 1,004 932 716 2.2 2.0 1.5
Source: Pupils' Exclusions Record, Welsh Government
(a) See the Notes section for an explanation of provision for special educational need.
(b) Data w ere created by matching records in the Pupils' Exclusions Record to the Pupil-Level Annual School Census (PLASC). Exclusions w ere not included if no match could be made, so totals may differ from figures published elsew here. See the notes section for information regarding this process and the number of exclusions that w ere excluded.
(c) Rate per 1,000 pupils. Full- and part-time pupils of all ages.
Pupils with special educational needs (SEN) had higher rates of exclusions than pupils without special educational needs. Pupils with a School Action Plus provision for their special educational need had the highest rates of fixed-term exclusions in 2013/14.
In 2013/14, there were 126.6 fixed-term exclusions of 5 days or less per 1,000 pupils with School Action Plus. This rate was more than ten times higher than the rate of fixed-term exclusions of 5 days or less for pupils without SEN.
The rate of fixed-term exclusions over 5 days was also much higher among pupils with School Action Plus than pupils with no SEN. In 2013/14, the rate for pupils with School Action Plus was more than fifteen times the rate for pupils with no SEN.
In 2013/14:
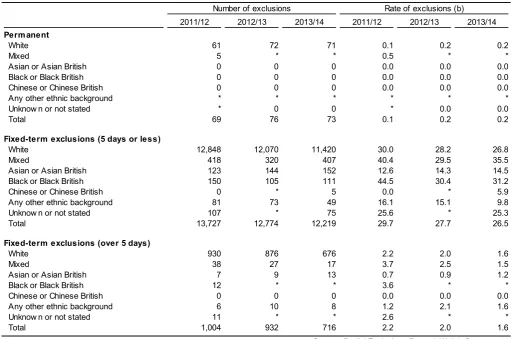
Table 6: Exclusions from maintained primary, secondary and special schools in Wales,
by ethnic background (a)
Number of exclusions Rate of exclusions (b) 2011/12 2012/13 2013/14 2011/12 2012/13 2013/14
Permanent
White 61 72 71 0.1 0.2 0.2
Mixed 5 * * 0.5 * *
Asian or Asian British 0 0 0 0.0 0.0 0.0
Black or Black British 0 0 0 0.0 0.0 0.0
Chinese or Chinese British 0 0 0 0.0 0.0 0.0
Any other ethnic background * * * * * *
Unknow n or not stated * 0 0 * 0.0 0.0
Total 69 76 73 0.1 0.2 0.2
Fixed-term exclusions (5 days or less)
White 12,848 12,070 11,420 30.0 28.2 26.8
Mixed 418 320 407 40.4 29.5 35.5
Asian or Asian British 123 144 152 12.6 14.3 14.5
Black or Black British 150 105 111 44.5 30.4 31.2
Chinese or Chinese British 0 * 5 0.0 * 5.9
Any other ethnic background 81 73 49 16.1 15.1 9.8
Unknow n or not stated 107 * 75 25.6 * 25.3
Total 13,727 12,774 12,219 29.7 27.7 26.5
Fixed-term exclusions (over 5 days)
White 930 876 676 2.2 2.0 1.6
Mixed 38 27 17 3.7 2.5 1.5
Asian or Asian British 7 9 13 0.7 0.9 1.2
Black or Black British 12 * * 3.6 * *
Chinese or Chinese British 0 0 0 0.0 0.0 0.0
Any other ethnic background 6 10 8 1.2 2.1 1.6
Unknow n or not stated 11 * * 2.6 * *
Total 1,004 932 716 2.2 2.0 1.6
Source: Pupils' Exclusions Record, Welsh Government
(a) Data w ere created by matching records in the Pupils' Exclusions Record to the Pupil-Level Annual School Census (PLASC). Exclusions w ere not included if no match could be made, so totals may differ from figures published elsew here. See the notes section for information regarding this process and the number of exclusions that w ere excluded.
Notes
1 Context
1.1 Policy/Operational
Updated guidance on Exclusion from Schools and Pupil Referral Units (Circular No: 081/2012) was issued in September 2012 and provides guidance on exclusions and appeals procedures. The procedures set out in this guidance apply to all maintained schools and PRUs and all pupils in them. It is for
individual schools to determine their behaviour policies and to work with their local authority on
exclusions. Differing practices operating within the guidelines will affect the varying rates across Wales.
1.2 Related Publications
England publish exclusions data for state-funded primary, secondary and special schools in the
statistical release entitled ‘Permanent and fixed-period exclusions in England: 2013 to 2014’. The latest available statistics can be found here: https://www.gov.uk/government/statistics/permanent-and-fixed-period-exclusions-in-england-2013-to-2014
Scotland publish exclusions data for maintained primary, secondary and special schools in the statistical bulletin ‘Summary Statistics for Schools in Scotland, No.4 : 2013 Edition’. The latest available statistics can be found here: http://www.gov.scot/Topics/Statistics/Browse/School-Education/PubExclusions Northern Ireland publish the number of pupils expelled or suspended from primary, post-primary and special schools. The latest available statistics for Northern Ireland can be found here:
http://www.deni.gov.uk/index/facts-and-figures-new/education-statistics/suspensions-and-expulsions.htm
2 Data Source
Since January 2013 exclusions data have been collected in the January Pupil-Level Annual School Census (PLASC). It was not possible to publish these new data immediately because their quality had to be evaluated. Now that the quality of the data has been confirmed, the pupil-level exclusions data obtained from the January PLASC are being used as the basis of this statistical first release. Pupil numbers used to calculate exclusion rates are also taken from the January PLASC. The data collection is carried out by Knowledge and Analytical Services within the Welsh Government.
3 Definitions
3.1 Coverage
The exclusions information in this Statistical First Release relates to the number of permanent and fixed-term exclusions of pupils of all ages from maintained primary, secondary and special schools and pupil referral units during the whole academic year. Only permanent exclusions upheld by the Governing Body’s Pupil Discipline Committee are included in the data since they are collected after the outcome of all independent appeals have been finalised. Data on the number of exclusions overturned after
independent appeal are also available on request.
Data are collected from maintained primary, secondary and special schools in the January PLASC following the academic year during which the exclusions took place. For example, exclusions for the 2013/14 academic year were collected in the January 2015 PLASC. If two schools merge before the next January PLASC, the schools’ exclusions data will be submitted by the new school. If a school closes before the next January PLASC, the exclusions data from that school are not provided.
event that a newly-merged school provided exclusions data, all schools that merged to form that school will also be included in the totals.
Data relate to the number of exclusions, not the number of pupils excluded. For example, a pupil excluded twice during an academic year would appear twice for that year.
3.2 Types of Exclusion and Other Definitions
A permanent exclusion refers to a pupil who is excluded and their name is removed from the school register. Such a pupil would then be educated at another school or via some other form of provision. A fixed-term exclusion refers to a pupil who is excluded from a school but remains on the register of that school because they are expected to return when the exclusion period is completed.
A managed move is an arrangement whereby parents of pupils in danger of exclusion agree with schools and local authorities that it is in the best interests of their child that they be removed from the roll of the current school and placed in another educational establishment. Data for managed moves are not currently available.
Alternative provision information relates to the educational provision being made for excluded pupils on the sixteenth school day after exclusion. A single category is recorded for each case of exclusion.
3.3 Free school meal (FSM) eligibility
Children whose parents receive the following support payments are eligible to receive free school meals in maintained schools in Wales:
Income Support.
Income Based Jobseekers Allowance Support under Part VI of the Immigration and Asylum Act 1999.
Income-related Employment and Support Allowance.
Child Tax Credit, provided they are not entitled to Working Tax Credit and their annual income does not exceed £16,190.
Guarantee element of State Pension Credit.
Working Tax Credit ‘run-on’- the payment someone may receive for a further four weeks after they stop qualifying for Working Tax Credit.
Universal Credit.
Children who receive income related employment and support allowance, Universal Credit, Income Support or Income Based Job Seekers Allowance in their own right are also eligible to receive Free School Meals.
Pupils should only be recorded as eligible if they have applied for free school meals to the local authority and (1) the relevant authority has confirmed their eligibility, or (2) final confirmation of eligibility is still awaited but the school has seen documents that strongly indicate eligibility.
3.4 Special educational needs (SEN)
Pupils known to have special educational needs can be in one of the following categories:
School Action: When a class or subject teacher identifies that a pupil has special educational needs they provide interventions that are additional to, or different from, those provided as part of the school’s usual curriculum.
Statement: Pupils for whom the local authority maintains a statement of special educational needs under Part IV of the Education Act 1996. A statement may be issued by the local authority after assessment of a child’s needs.
3.5 Missing Data
.. means that the data item is not available. . means that the data item is not applicable. * means that the data item is disclosive.
4 Key Quality Information
This section provides a summary of information on this output against five dimensions of quality: Relevance, Accuracy, Timeliness and Punctuality, Accessibility and Clarity, and Comparability.
Between September and November 2010 we conducted a public consultation on our Education Statistics outputs in which we asked for feedback on the quality of the outputs. A summary of the responses has been published and is available here: http://gov.wales/consultations/statistics/education/?lang=en
4.1 Relevance
The statistics are used both within and outside the Welsh Government to monitor educational trends and as a baseline for further analysis of the underlying data. Some of the key users are:
Ministers and the Members Research Service in the National Assembly for Wales; The Department for Education in England;
other government departments; Local Authorities;
Estyn, Her Majesty’s Inspectorate of Education and Training in Wales; Wales Audit Office;
The Department for Education and Skills in the Welsh Government; other areas of the Welsh Government;
the research community;
students, academics and universities; individual citizens and private companies.
These statistics are used in a variety of ways. Some examples of these are: advice to Ministers;
local authority comparisons and benchmarks;
to inform the education policy decision-making process in Wales; to inform ESTYN during school inspections;
contributes to the Core Strategic Indicators; international benchmarking;
the education domain of the Welsh Index of Multiple Deprivation; to assist in research in educational attainment.
4.2 Accuracy
Various stages of automated validation and sense-checking are built into the data collection process to ensure a high quality of data.
4.3 Timeliness and Punctuality
November to the January PLASC the publication date is later than the previous exclusions statistical release.
4.4 Accessibility and Clarity
This Statistical First Release is pre-announced and then published on the Statistics section of the Welsh Government website.
4.5 Comparability
In order to improve the quality and usefulness of exclusions data, it was decided to collect exclusions data in a new way via the January Pupil-Level Annual School Census (PLASC). Although it is expected that these new data will be more useful to users, comparing them with data collected using the old method is not advised. There are several reasons for this: 1) These data do not include exclusions from pupil referral units, 2) The data do not include data from schools that closed before the following January PLASC, and 3) When investigating the differences between the two sets of data it was found that the data collected from PLASC included some exclusions that were not included in the old data, while the old data included some exclusions that were not collected via PLASC. Caution should therefore be taken when comparing data in this new statistical release and the old report called
‘Exclusions from Schools in Wales’. The following table shows the difference between the numbers and rates of exclusions using the old and the new method for 2012/12 and 2012/13 when data were collected using both methods.
The number and rate of exclusions collected using the old and new methods
Number of exclusions Rate of exclusions (a)
2011/12 2012/13 2011/12 2012/13
Old method
Permanent exclusions 101 99 0.3 0.3
Fixed-term exclusions (5 days or few er) 15,356 13,132 38.9 33.4
Fixed-term exclusions (6 days or more) 1,189 953 3.0 2.4
New method
Permanent exclusions 91 102 0.2 0.2
Fixed-term exclusions (5 days or less) 13,877 12,917 29.9 27.9
Fixed-term exclusions (over 5 days) 1,045 962 2.3 2.1
(a) Rate per 1,000 pupils. Rates for exclusions collected using the old method only included full-time pupils aged 5 and over. Rates for exclusions collected using the new method include full- and part-time pupils of all ages.
Due to the effect that the implementation of different behaviour management and exclusion intervention practices, such as managed moves, have on the number of exclusions, comparisons over time and
between local authorities should be interpreted with caution.