Estimating the burden of disease in chronic pain with and without
neuropathic characteristics: Does the choice between the EQ-5D
and SF-6D matter?
Nicola Torrance
a,⇑, Kenny D. Lawson
b, Ebenezer Afolabi
c, Michael I. Bennett
d, Michael G. Serpell
e,
Kate M. Dunn
c, Blair H. Smith
aaMedical Research Institute, University of Dundee, Dundee, Scotland, UK b
Centre for Research Excellence in the Prevention of Chronic Conditions in Rural and Remote Populations, James Cook University, Townsville City, Australia c
Research Institute for Primary Care & Health Sciences, Keele University, Staffordshire, England, UK d
Academic Unit of Palliative Care, University of Leeds, Leeds, England, UK e
School of Medicine, University of Glasgow, Glasgow, Scotland, UK
Sponsorships or competing interests that may be relevant to content are disclosed at the end of this article.
a r t i c l e
i n f o
Article history:
Received 27 December 2013 Received in revised form 23 June 2014 Accepted 3 July 2014
Keywords:
Chronic pain EQ-5D
Health-related quality of life Health utilities
Neuropathic pain SF-6D
S-LANSS
a b s t r a c t
The EQ-5D and Short Form (SF)12 are widely used generic health-related quality of life (HRQoL) question-naires. They can be used to derive health utility index scores, on a scale where 0 is equivalent to death and 1 represents full health, with scores less than zero representing states ‘‘worse than death.’’ We compared EQ-5D or SF-6D health utility index scores in patients with no chronic pain, and chronic pain with and without neuropathic characteristics (NC), and to explore their discriminant ability for pain severity. Self-reported health and chronic pain status was collected as part of a UK general population survey (n = 4451). We found moderate agreement between individual dimensions of EQ-5D and SF-6D, with most highly correlated dimensions found for mental health and anxiety/depression, role limitations and usual activities, and pain and pain/discomfort. Overall 43% reported full health on the EQ-5D, com-pared with only 4.2% on the SF-6D. There were significant differences in mean utilities for chronic pain with NC (EQ-5D 0.47 vs SF-6D 0.62) and especially for severe pain (EQ-5D 0.33 vs SF-6D 0.58). On the EQ-5D, 17% of those with chronic pain with NC and 3% without NC scored ‘‘worse than death,’’ a state which is not possible using the SF-6D. Health utilities derived from EQ-5D and SF-12/36 can discriminate between group differences for chronic pain with and without NC and greater pain severity. However, the instruments generate widely differing HRQoL scores for the same patient groups. The choice between using the EQ-5D or SF-6D matters greatly when estimating the burden of disease.
Ó2014 The Authors. Published by Elsevier B.V. on behalf of International Association for the Study of Pain. This is an open access article under the CC BY license (http://creativecommons.org/licenses/by/3.0/).
1. Introduction
Chronic pain is common, affecting up to half of the adult
population[17,47]. Approximately 20% of the adult European
pop-ulation has significant chronic pain, and 7% to 8% of the poppop-ulation
has chronic pain with neuropathic features [7,10,47].
Health-related quality of life (HRQoL) is significantly poorer in people with
chronic pain than in those without[42], and poorer in people with
neuropathic pain than in those with nonneuropathic pain [2,16,25,43,48].
HRQoL measures can be categorized into disease-specific and generic measures. It is important that these measures are valid, appropriate to the disease, and particularly for clinical trials, sensi-tive to detect changes. Although a disease-specific measure for
neuropathic pain has been developed[39], many studies use a
gen-eric HRQoL measure alongside clinical assessment or a validated
neuropathic pain screening tool[2,43]. A single summary score
of overall HRQoL is generated by weighting responses to mental and physical health states by their perceived importance, using patient or general population preferences. This single summary score can be used to compare the impact of different conditions and how they vary across populations and to quantify the
http://dx.doi.org/10.1016/j.pain.2014.07.001
0304-3959/Ó2014 The Authors. Published by Elsevier B.V. on behalf of International Association for the Study of Pain. This is an open access article under the CC BY license (http://creativecommons.org/licenses/by/3.0/).
⇑Corresponding author. Address: University of Dundee, Ninewells Hospital and Medical School, Mackenzie Building, Kirsty Semple Way, Dundee, DD2 4BF Scotland, UK. Tel.: +44 (0)1382 383476; fax: +44 (0)1382 383802.
E-mail address:n.torrance@dundee.ac.uk(N. Torrance).
w w w . e l s e v i e r . c o m / l o c a t e / p a i n
effectiveness of interventions. Economists term such scores health utilities or health utility index scores. Health utilities are measured on a scale where 0 represents a health state equivalent to death and 1 represents full health, with the potential for values less than zero representing states ‘‘worse than death’’ (WTD). A concern in only using generic measures is whether they are sensitive enough to discriminate between patients in whom important but complex differences might be detected by more specific measures.
The EQ-5D[18] and Short Form (SF) 12/36 [53,54]
question-naires are widely used generic HRQoL measures. They are a common means of generating health state values using an
algo-rithm to derive health utility scores (SF-6D from SF-12/36) [5]
and are used by economists to calculate quality adjusted life years
(QALYs)[35,49,57]and in economic evaluations to evaluate the
cost effectiveness of health care interventions.
The association between neuropathic pain conditions and health utilities has been described in a multicenter European
cross-sectional survey[33]and a systematic review[16], both
find-ing a significant relationship between increasfind-ing pain severity and reduced HRQoL. The EQ-5D has been used to measure HRQoL of
patients with specific neuropathic pain diagnoses[16], but there
are few published studies that have used SF-6D in patients with
neuropathic pain[29], despite its widespread use and acceptance.
Studies have directly compared EQ-5D and SF-6D utilities in patients with chronic painful conditions, such as arthritis [8,14,23,26,31,37,57], low back pain [8,14,37], and nonspecific
neck pain[55], with most finding moderate levels of agreement.
These patients were generally recruited according to strict criteria and are unlikely to represent HRQoL associated with these condi-tions in general populacondi-tions and primary care, where most chronic
and neuropathic pain is treated and managed[46].
This study collected data on HRQoL and chronic pain status as
part of a large UK general population questionnaire survey[46].
We compared EQ-5D and SF-6D health utility index scores in individuals with chronic pain, with and without neuropathic characteristics. We also explored the ability of these generic measures to discriminate between the health utilities of patients with different pain severities.
2. Methods
2.1. Sample selection
In the UK, around 96% of the population is registered with a
general practitioner (family doctor, GP)[36]; a GP practice
popula-tion therefore approximates to a general populapopula-tion sample. This study surveyed 10,000 individuals in 5 UK locations, with 2 GP practices in each locality generating a random sample of 1000 reg-istered adult patients. Each practice’s electronic register was used to generate a random sample of patients over age 18 years. The sample list was then screened by the GPs in each practice, to exclude patients in whom inquiry might be insensitive or inappro-priate (for example, in terminal illness or with severe learning difficulties). Details of the sample selection procedures have been
reported previously[46].
2.2. Patient questionnaire
Individuals in the study sample were mailed a self-complete questionnaire that contained demographic items (age, sex, smok-ing, marital and employment status, educational attainment, and
home ownership as a proxy for social class[44]), HRQoL measures
including the SF-12 and EQ-5D questionnaires, chronic pain identi-fication and severity questions, and the Self-Complete Leeds Assessment of Neuropathic Symptoms and Signs (S-LANSS)
questionnaire, which is used to identify pain with neuropathic
characteristics (NC)[4].
2.2.1. Pain ascertainment and characteristics
Chronic pain was identified by affirmative answers to 2 ques-tions: (1) Are you currently troubled by pain or discomfort, either all the time or on and off? (2) Have you had this pain or discomfort
for more than 3 months?[24] Identical case identification
ques-tions have been used in previous population-based research on
chronic pain[13,17,47].
The S-LANSS questionnaire is a validated 7-item questionnaire including 5 questions about pain characteristics and 2 self-exami-nation items; its responses are weighted to provide a maximum
score of 24, with a scoreP12 indicating pain with NC[4]. Pain
severity was measured using the average pain intensity numeric rating scale (NRS) of the Chronic Pain Grade (CPG). This is a 0 to 10 NRS anchored at 0 for no pain and 10 for pain as bad as can
be in the past 3 months[51].
2.2.2. HRQoL and generating health utility scores
All respondents were asked to complete the SF-12 and EQ-5D HRQoL questionnaires before completion of the chronic pain screening questions. The SF-12 is a validated 12-item
self-adminis-tered tool for measuring health status derived from the SF-36[53].
The SF-12 has been used in large general population questionnaire
studies of chronic pain[2,12,29,30]and in studies of specific
neu-ropathic pain conditions, such as postherpetic neuralgia[6]. SF-12
scores can be calculated in 8 health domains: physical functioning, role physical, bodily pain, general health, vitality, social function-ing, role emotional, and mental health. To generate a single health utility score from the SF-12, we used the standard SF-6D algorithm
[9]. This algorithm involves preference weighting of 6 of the SF-12
question responses (3 physical health and 3 mental health) by the desirability for different health states. These preference weights were derived from a survey representative of the UK general
pop-ulation[9]. Summing across weighted question responses
gener-ated a health utility score for each respondent [9]. The SF-6D
generates a score on a 0.29 to 1.00 scale, with 1.00 indicating full health. The SF-6D can define 18,000 and 7500 health states for
the SF-6D (SF-36) and SF-6D (SF-12), respectively[56].
The EQ-5D is a generic measure of health status and defines health in terms of 5 dimensions: mobility, self-care, usual activities (work, study, housework, family, or leisure), pain or discomfort, and anxiety or depression, and is well validated in population stud-ies [18,27]. A preference-based set of weights (or algorithm) is used to calculate a single EQ-5D index-based utility score. The
EQ-5D generates a score on a 0.59 to 1.00 scale, with 1.00
indicat-ing full health and 0 equal to death. The negative EQ-5D utility val-ues theoretically correspond to health states valued as WTD. (Negative utility values are not available with SF-6D.) The EQ-5D
can define 243 distinct states[56].
2.3. Data analysis
A complete case analysis was conducted. Descriptive statistics show the sociodemographic characteristics of the whole study sample and by defined pain group (no chronic pain; chronic pain without neuropathic characteristics (S-LANSS < 12; chronic pain without NC); chronic pain with neuropathic characteristics
(S-LANSSP12; chronic pain with NC). Linear regression analysis
was conducted to determine differences in health utilities among the 3 defined pain subpopulations (no chronic pain vs chronic pain without NC, no chronic pain vs chronic pain with NC, chronic pain without NC vs chronic pain with NC) with adjustment for all significant demographic variables.
The data analysis was divided into 3 elements: an assessment of the correlation between EQ-5D and SF-6D dimensions, the range of observed health utility index scores, and the sensitivity of both instruments to detect differences between chronic pain types and degrees of pain severity.
2.3.1. Correlation between EQ-5D and SF-6D dimensions
EQ-5D dimensions are what the respondents reported, and the EQ-5D health utility indices are derived using the algorithm. Sim-ilarly, SF-6D dimensions were obtained from the SF-12 responses, and health utility indices were calculated using the SF-6D algorithm. The first section of the analysis is based on EQ-5D and SF-6D self-reported dimensions with no reference to single index scores. This assessment of the degree of agreement between dimensions of the 2 instruments used Spearman rank correlations across the whole sample and by defined pain group. The value of the correlation coefficient can be interpreted thus: 1 is perfect, 0.7 to 0.9 is strong, 0.4 to 0.69 is moderate, 0.1 to 0.39 is weak,
and 0 is no correlation[15]. We hypothesized that there would
be correlations between the dimensions purporting to capture sim-ilar aspects in SF-12 and EQ-5D. These simsim-ilar dimensions are physical functioning and mobility, physical functioning and usual activities, role limitations and usual activities, role limitations and anxiety/depression, social functioning and usual activities, pain and pain/discomfort, mental health and anxiety/depression,
vitality and usual activities[55].
2.3.2. Range of the health utility index scores
Further analysis then explored the health utility indices with basic descriptive statistics, including means, medians, and ranges. The level of agreement between EQ-5D and SF-6D index scores also was examined by calculating the intraclass correlation coefficient (ICC), using a 2-way mixed model based on absolute agreement, where the 2 measures are treated as a source of variability [8,55]. The values of the ICC can theoretically range from 0 to 1, with a higher value indicating that less variance is due to other factors such as differences between observations. For the 2 instruments, the level used to interpret the ICC was 0.00 to 0.10 = virtually no agreement, 0.11 to 0.40 = slight, 0.41 to 0.60 = fair, 0.61 to 0.80 = moderate, and 0.81 to 1.00 = substantial
agreement[41,56]. Floor and ceiling effects (proportion of
respon-dents with the best and worst possible theoretical scores, respec-tively) were also explored for both the EQ-5D and SF-6D indices.
2.3.3. Discriminating health utility index scores among degrees of pain severity
In comparing the EQ-5D and SF-6D, a key criterion is whether the instruments are sensitive enough to discriminate differences in reported patients’ pain severity considered to be clinically meaningful. Because this was a cross-sectional study, we were unable to measure changes in utility scores over time. However, within an exploratory analysis, we were able to estimate the differ-ence in utility scores for respondents with different levels of pain severity. This provides an indication of the potential change in util-ity scores that each instrument may detect if there was an inter-vention that moved patients between pain severity groups. This analysis is exploratory and intended to inform whether further research using a longitudinal study is necessary.
Patients were first divided into 3 categories of reported pain severity. We used clinically validated cut-points for pain severity to create categories of mild, 0 to 3; moderate, 4 to 6; and severe, 7 to 10 chronic pain on the average pain intensity NRS of the
Chronic Pain Grade[51,59]. We then compared mean utility scores
from the EQ-5D and SF-6D across these 3 pain intensity groups as a means to infer discriminant ability regarding HRQoL. We also tested whether the difference in utility scores among pain groups
is also meaningful to patients in terms of their perception of HRQoL. This was done by comparing the differences in utility scores to the minimally important difference (MID) according to
Walters and Brazier[52], who in comparing the results of 11
lon-gitudinal studies (the majority of which were chronic pain–related conditions, including back pain and arthritis) found the mean MID for EQ-5D to be 0.074 (range 0.011 to 0.140) and for SF-6D to be
0.041 (range 0.011 to 0.097)[52].
Because previous research has found HRQoL in individuals with neuropathic pain to be worse than in those with nonneuropathic
pain of the same severity[43], we hypothesized that those
respon-dents in the chronic pain with NC group would be more likely (than chronic pain without NC) to report WTD scores in EQ-5D and therefore to demonstrate a floor effect equivalent to worst
possible health (60)[55].
2.4. Ethics approval
The study was approved by North of Scotland Research Ethics Committee, REC reference number 09/S0802/103.
3. Results
3.1. Characteristics of study sample
In total, 10,000 postal questionnaires were mailed, with 347 returned as undelivered or unable to be completed due to illness or learning disability. Of the rest, 4541 completed questionnaires were returned, giving an overall corrected response rate of 47%. Further information on the respondents and the study sample
has been reported previously[46].
Of the 4451 returned questionnaires, 4408 individuals completed both of the 2 screening questions for chronic pain status. Any chronic pain was reported by 2202 (48.5%; 95% confidence interval 47.0% to 49.9%) and 2206 respondents reported no chronic pain. S-LANSS questionnaires were incomplete in 192 of those with any chronic pain, and these individuals were excluded from further categoriza-tion into the chronic pain with or without neuropathic pain groups for analysis. Therefore 1611 individuals were categorized as chronic
pain without NC and 399 as chronic pain with NC (S-LANSSP12).
Completion rates were high for both HRQoL questionnaires, with the EQ-5D completed by 4349 (95.8%) and the SF-12 completed by 4176 (92.0%) of all respondents. The characteristics of the whole
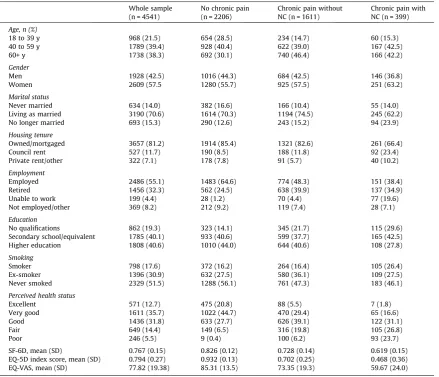
study sample and by pain group are shown inTable 1. There were
sig-nificant differences in all of the measured sociodemographic charac-teristics between respondents reporting chronic pain with NC and those reporting chronic pain without NC except for age (mean (SD)
56.0 (15.4) years vs 56.3 (15.3) years,P= .673). Individuals with
chronic pain with NC were more likely to be women, no longer mar-ried, and living in council rented accommodation than individuals whose chronic pain that did not have NC. They were also more likely to be unable to work due to illness or disability, to have no educa-tional qualifications, and to be smokers. Pairwise comparisons between pain groups found those reporting chronic pain with NC to have significantly lower EQ-5D and SF-6D mean utility scores than
the no Chronic pain and chronic pain without NC groups (P< .001).
Linear regression found the significant differences in health utilities
between the pain groups persisted (P< .001) after adjustment for all
significant sociodemographic variables (sex, marital status, employ-ment, housing, general health, education, and smoking).
3.2. Correlation between EQ-5D and SF-6D dimensions
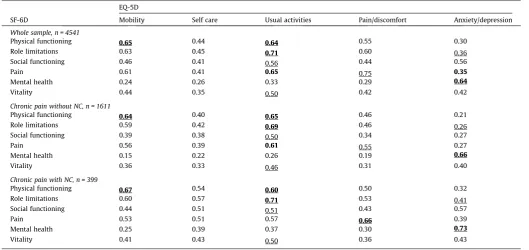
Table 2presents the relationships between EQ-5D and the SF-6D dimensions as measured by Spearman correlation coefficients for the whole dataset, and then separately for the 2 chronic pain groups.
The similar dimensions that were expected to have the highest
cor-relations are underlined[8,55]with the 5 actual most correlated
dimensions shown in boldface type. We identified 8 paired dimen-sions that were expected to be among the highest correlations. Of these, the highest correlations were: between mobility and usual activities (EQ-5D) with physical functioning (SF-6D), between usual activities (EQ-5D) and role limitations and pain (SF-6D), between pain/discomfort (EQ-5D) and pain (SF-6D), and between anxiety/ depression (EQ-5D) mental health (SF-6D). These all had a correla-tion coefficient >0.60, with the strongest correlacorrela-tion (0.75) found between the 2 pain dimensions in the whole sample. These results provide evidence for agreement, but lower correlations were found between other similar dimensions, notably between anxiety/ depression (EQ-5D) and mental health (SF-6D). The 2-way mixed ICC for the whole sample was 0.61, which suggests moderate agree-ment between the 2 measures, with the ICC 0.44 for the chronic pain with NC and 0.57 for chronic pain without NC groups.
Further analysis was conducted into the responses to the pain questions in both EQ-5D and SF-6D (SF-12), where 94.3% (366 of 388) and 71.2% (282 of 396) of those with chronic pain with NC reported moderate to extreme pain, respectively, compared with 80.7% (1278 of 1584) and 39.2% (629 of 1605) of those with chronic pain without NC.
3.3. Range of the health utility index scores
The mean EQ-5D and the SF-6D scores are shown inTable 3. For
the whole sample, the EQ-5D mean score was greater than the SF-6D by 0.02; however, for the 2 pain groups the mean SF-SF-6D scores were greater, by 0.03 in the chronic pain without NC group, and by 0.15 in the chronic pain with NC. Overall, median scores were higher than mean, indicating a skewed distribution for both indi-ces, except for the SF-6D index for the chronic pain with NC group (mean 0.62, median 0.60). Floor effects were small in both of the measures, and we did not reach the absolute theoretical floor effect
of EQ-5D ( 0.594), with the lowest score found to be 0.371.
We observed 119 respondents with a score <0 or WTD on the EQ-5D (2.7% of the whole sample). Only 1 of these individuals reported no chronic pain, 54 individuals reported chronic pain without NC (from total n = 1551), representing 45.4% of all WTD scores and 3.4% of chronic pain without NC. The remaining 64 individuals with WTD utility scores reported chronic pain with NC, representing 53.8% of all WTD scores and 17.2% of the chronic pain with NC group (n = 64 of 373 with complete data). The major-ity of respondents who were WTD in both pain groups reported
severe average pain (P7 of 10), 98.1% (n = 53 of 54) of the chronic
[image:4.595.85.525.85.462.2]pain without NC and 83.6% (n = 51 of 1) of chronic pain with NC Table 1
Sample characteristics of respondents by chronic pain group, n (%).
Whole sample (n = 4541)
No chronic pain (n = 2206)
Chronic pain without NC (n = 1611)
Chronic pain with NC (n = 399)
Age, n (%)
18 to 39 y 968 (21.5) 654 (28.5) 234 (14.7) 60 (15.3) 40 to 59 y 1789 (39.4) 928 (40.4) 622 (39.0) 167 (42.5)
60+ y 1738 (38.3) 692 (30.1) 740 (46.4) 166 (42.2)
Gender
Men 1928 (42.5) 1016 (44.3) 684 (42.5) 146 (36.8)
Women 2609 (57.5 1280 (55.7) 925 (57.5) 251 (63.2)
Marital status
Never married 634 (14.0) 382 (16.6) 166 (10.4) 55 (14.0) Living as married 3190 (70.6) 1614 (70.3) 1194 (74.5) 245 (62.2) No longer married 693 (15.3) 290 (12.6) 243 (15.2) 94 (23.9)
Housing tenure
Owned/mortgaged 3657 (81.2) 1914 (85.4) 1321 (82.6) 261 (66.4) Council rent 527 (11.7) 190 (8.5) 188 (11.8) 92 (23.4) Private rent/other 322 (7.1) 178 (7.8) 91 (5.7) 40 (10.2)
Employment
Employed 2486 (55.1) 1483 (64.6) 774 (48.3) 151 (38.4) Retired 1456 (32.3) 562 (24.5) 638 (39.9) 137 (34.9) Unable to work 199 (4.4) 28 (1.2) 70 (4.4) 77 (19.6) Not employed/other 369 (8.2) 212 (9.2) 119 (7.4) 28 (7.1)
Education
No qualifications 862 (19.3) 323 (14.1) 345 (21.7) 115 (29.6) Secondary school/equivalent 1785 (40.1) 933 (40.6) 599 (37.7) 165 (42.5) Higher education 1808 (40.6) 1010 (44.0) 644 (40.6) 108 (27.8)
Smoking
Smoker 798 (17.6) 372 (16.2) 264 (16.4) 105 (26.4)
Ex-smoker 1396 (30.9) 632 (27.5) 580 (36.1) 109 (27.5) Never smoked 2329 (51.5) 1288 (56.1) 761 (47.3) 183 (46.1)
Perceived health status
Excellent 571 (12.7) 475 (20.8) 88 (5.5) 7 (1.8)
Very good 1611 (35.7) 1022 (44.7) 470 (29.4) 65 (16.6)
Good 1436 (31.8) 633 (27.7) 626 (39.1) 122 (31.1)
Fair 649 (14.4) 149 (6.5) 316 (19.8) 105 (26.8)
Poor 246 (5.5) 9 (0.4) 100 (6.2) 93 (23.7)
SF-6D, mean (SD) 0.767 (0.15) 0.826 (0.12) 0.728 (0.14) 0.619 (0.15) EQ-5D index score, mean (SD) 0.794 (0.27) 0.932 (0.13) 0.702 (0.25) 0.468 (0.36) EQ-VAS, mean (SD) 77.82 (19.38) 85.31 (13.5) 73.35 (19.3) 59.67 (24.0)
Pairwise comparisons (independent samplesttests) for SF-6D and EQ-5D foundP< .001 for no chronic pain vs chronic pain without NC, no chronic pain vs chronic pain with NC, chronic pain without NC vs chronic pain with NC.
NC = neuropathic characteristics.
(v2test,P= .03). The lowest score observed for SF-6D was 0.345 in
1.4% (n = 5 of 358) of those with chronic pain with NC, none of the respondents reached the theoretical lowest threshold of 0.29.
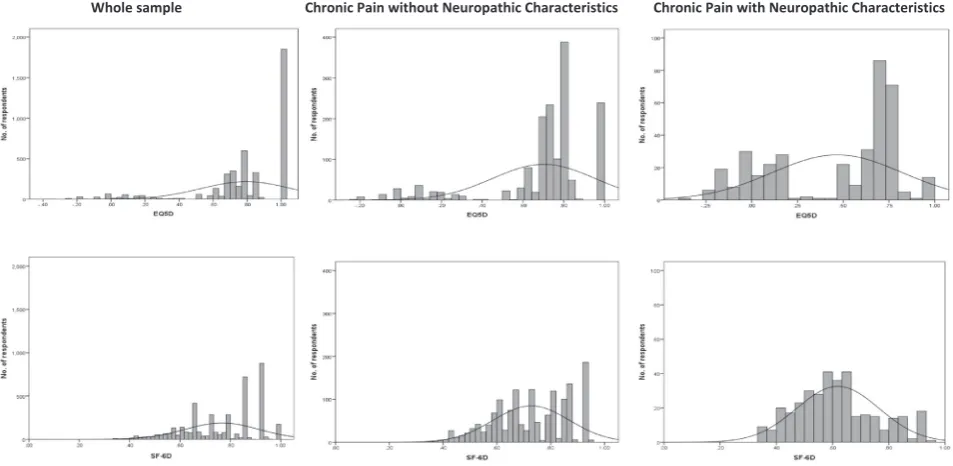
The EQ-5D scores were negatively skewed with a ceiling effect that was most apparent in the whole general population sample,
where 42.5% (n = 1850) attained a maximum score of 1 (Table 3).
The highest possible score on EQ-5D was also found in 15.4% of those with chronic pain without NC and in 3.8% of the chronic pain with NC group, and there were few scores between 0.88 and 1. This compares to a ceiling effect in the SF-6D found in 4.2%, 1.2%, and 0.8% in the whole sample, and the chronic pain without and with NC groups, respectively. The SF-6D is also negatively skewed in the whole sample, but then these scores approximate a normal distribution in the 2 pain groups because the SF-6D was more positively skewed and is limited at the floor (0.29). The distribution of EQ-5D scores was distributed across the range of scores in the chronic pain groups. It also appears that the SF-6D was more continuous, whereas the EQ-5D appeared more discrete with gaps
between states, with an apparent bimodal distribution in both the chronic pain groups. The frequency distributions of the utility scores
for the whole sample and the 2 pain groups are shown inFig. 1.
3.4. Discriminating health utility scores by level of pain severity
[image:5.595.31.561.86.336.2]Table 4shows the mean EQ-5D and SF-6D utilities by mild, mod-erate, and severe average pain. Of the total 2010 respondents with chronic pain, 1972 completed the average pain NRS, 22.6% (n = 445) reporting mild chronic pain, 41.7% (n = 822) reporting moderate chronic pain, and 35.8% (n = 705) reporting severe chronic pain. Overall, those with severe pain had the lowest utilities for both EQ-5D and SF-6D as expected; furthermore, the EQ-5D utilities were lower in chronic pain (with and without NC) compared with the SF-6D. In the chronic pain with NC group, mean EQ-5D health utilities for those reporting mild pain intensity was 0.72, for those with moderate pain the mean was 0.63, and for those with severe pain it was 0.33. Therefore, the mean between-group differences Table 2
The correlation between EQ-5D and SF-6D dimensions (Spearman rank correlation).
SF-6D
EQ-5D
Mobility Self care Usual activities Pain/discomfort Anxiety/depression
Whole sample, n = 4541
Physical functioning 0.65 0.44 0.64 0.55 0.30
Role limitations 0.63 0.45 0.71 0.60 0.36
Social functioning 0.46 0.41 0.56 0.44 0.56
Pain 0.61 0.41 0.65 0.75 0.35
Mental health 0.24 0.26 0.33 0.29 0.64
Vitality 0.44 0.35 0.50 0.42 0.42
Chronic pain without NC, n = 1611
Physical functioning 0.64 0.40 0.65 0.46 0.21
Role limitations 0.59 0.42 0.69 0.46 0.26
Social functioning 0.39 0.38 0.50 0.34 0.27
Pain 0.56 0.39 0.61 0.55 0.27
Mental health 0.15 0.22 0.26 0.19 0.66
Vitality 0.36 0.33 0.46 0.31 0.40
Chronic pain with NC, n = 399
Physical functioning 0.67 0.54 0.60 0.50 0.32
Role limitations 0.60 0.57 0.71 0.53 0.41
Social functioning 0.44 0.51 0.51 0.43 0.57
Pain 0.53 0.51 0.57 0.66 0.39
Mental health 0.25 0.39 0.37 0.30 0.73
Vitality 0.41 0.43 0.50 0.36 0.43
The 5 most correlated dimensions are indicated in boldface type.
[image:5.595.33.556.411.515.2]The underlined correlations were identified as purporting to capture similar aspects of quality of life. NC = neuropathic characteristics.
Table 3
Distribution of EQ-5D and SF-6D indices.
No. of items Theoretical range Observed range Floor effect,*n (%) Ceiling effect, n (%) Mean (SD) Median (IQR) ICC of indices
Whole sample, n = 4541
EQ-5D, n = 4349 5 0.594 to 1 0.371 to 1.00 119 (2.7) 1850 (42.5) 0.79 (0.27) 0.85 (0.73 to 1.00) 0.61 SF-6D, n = 4176 6 0.29 to 1 0.345 to 1.00 9 (0.2) 174 (4.2) 0.77 (0.15) 0.80 (0.66 to 0.92)
Chronic pain without NC, n = 1611
EQ-5D, n = 1551 5 0.594 to 1 0.235 to 1.00 54 (3.8) 239 (15.4) 0.70 (0.25) 0.76 (0.69 to 0.80) 0.57 SF-6D, n = 1499 6 0.29 to 1 0.345 to 1.00 1 (0.1) 18 (1.2) 0.73 (0.14) 0.72 (0.62 to 0.86)
Chronic pain with NC, n = 399
EQ-5D, n = 373 5 0.594 to 1 0.371 to 1.00 64 (17.2) 14 (3.8) 0.47 (0.36) 0.62 (0.89 to 0.73) 0.44 SF-6D, n = 358 6 0.29 to 1 0.345 to 1.00 5 (1.4) 3 (0.8) 0.62 (0.15) 0.60 (0.52 to 0.71)
IQR = interquartile range; ICC = intraclass correlation coefficient, NC = neuropathic characteristics.
*Floor effect, less than 0 (worse than death) for EQ-5D and minimum value for SF-6D = 0.345. Ceiling effect = 1 for both instruments.
(for pain intensity) were 0.09 (moderate-mild) and 0.39 (severe-moderate), and above the published mean MID of 0.074
[52]. For SF-6D utilities, in the chronic pain with NC group, the
mean difference in health utilities between those with moderate and mild pain was 0.08, with the same mean difference between severe and moderate pain intensity, and also above the mean MID
of 0.041[52]. Notably, in comparing the EQ-5D and SF-6D, utility
scores as measured by the EQ-5D were considerably lower in those with any severe pain (mean 0.48 vs 0.63), and the EQ-5D showed approximately twice the range of between-group differences (0.55 vs 0.33) compared with the SF-6D scores (0.65 vs 0.58).
4. Discussion
This study compared the health utility scores derived from 2 widely used generic HRQoL measures, the EQ-5D and SF-6D, in a large general UK population sample focusing on chronic pain with and without neuropathic characteristics. We looked at the agreement between instruments in measuring individual health dimensions, the scoring range of the health utility scores, and whether scores could detect at least an MID between clinically meaningful differences in pain. Both instruments were able to discriminate important differences in pain groups and in pain
intensity. Among those with chronic neuropathic pain, 17% had HRQoL scores equivalent to WTD on the EQ-5D.
4.1. Key findings and implications
4.1.1. Comparison between individual dimensions
Overall, we found only moderate agreement between individual dimensions. The most highly correlated dimensions were mental health and anxiety/depression and role limitations and usual activ-ities. The pain and pain/discomfort dimensions were more highly correlated in the chronic pain with NC group (compared to without NC).
4.1.2. Health utility scores: range, floor, and ceiling effects
We confirmed the considerable ceiling effect of EQ-5D observed
in previous general population surveys[5,14,38], with 43% of our
whole sample reporting full health, compared with only 4.2% who were classified in full health on the SF-6D. The EQ-5D appears insensitive at the top (healthy end) of the scale, and a gap exists between 0.88 and 1. The SF-6D does not seem to have a ceiling effect and may capture smaller health changes toward the top of
the scale [11]. However, this may be less relevant in chronic
[image:6.595.63.540.67.300.2]neuropathic pain, in which the proportion of respondents attaining Fig. 1.Frequency distributions by pain group.
Table 4
Health utilities by pain severity, mean (SD).
Mild (n = 445)
Moderate (n = 822)
Severe (n = 705)
Mean difference mild-moderate
Mean difference moderate-severe
Mean difference mild-severe
Pvalue*
Any chronic pain
EQ-5D 0.82 (0.17) 0.72 (0.20) 0.48 (0.35) 0.10 0.24 0.34 <.001 SF-6D 0.79 (0.12) 0.73 (0.13) 0.63 (0.15) 0.06 0.10 0.16 <.001
Chronic pain without NC
EQ-5D 0.83 (0.16) 0.74 (0.17) 0.55 (0.32) 0.09 0.19 0.28 <.001 SF-6D 0.79 (0.11) 0.74 (0.13) 0.65 (0.15) 0.05 0.09 0.14 <.001
Chronic pain with NC
EQ-5D 0.72 (0.24) 0.63 (0.27) 0.33 (0.36) 0.09 0.30 0.39 <.001 SF-6D 0.74 (0.13) 0.66 (0.14) 0.58 (0.14) 0.08 0.08 0.16 <.001
Mean Minimally Important Difference (MID) for EQ-5D 0.074 and mean MID for SF-6D 0.041 (Walters & Brazier, 2005[52]). NC = neuropathic characteristics.
*ANOVA for mild, moderate and severe pain by pain group.
[image:6.595.84.523.350.460.2]a maximum utility score with EQ-5D was relatively small (only 3.8% reported full health with EQ-5D and 0.8% with SF-6D).
In total, 17% of chronic pain with NC and 3% of chronic pain without NC respondents had a score of below 0 or WTD on EQ-5D. Almost all of those with a WTD score also reported severe pain
(P7 of 10). Other studies of rheumatoid arthritis (RA) report similar
findings: in a study of patients with established RA[1], 17% had
WTD scores at baseline (before biological therapy) and 7% at 12-month follow-up. Extreme pain scores were strongly associated with a state WTD in a study of early arthritis, in which 11% had a neg-ative EQ-5D score[21], and in patients with RA[22], 9% of trial partic-ipants had states WTD. In these studies, extreme pain/discomfort was the key EQ-5D domain associated with a WTD state, plus moderate
problems inP3 other domains[22]. Whitehurst et al. (2011)[56]
suggest that the EQ-5D may be better suited to capture the magnitude of severity for poorer health states. Notably, however, the 20% of
patients who on the EQ-5D had a score60 did not actually reach
the SF-6D floor of 0.29. This raises interesting issues regarding the true HRQoL state of such patients. For instance, if such states are really considered as WTD, as estimated by EQ-5D, it may be legitimately expected that the utility scores of SF-6D in these patients would have clustered at the SF-6D floor of 0.29. However, the mean score of patients with chronic pain with neuropathic characteristics was 0.34.
4.1.3. Mean scores between patient groups
There were differences in the mean utility scores for the 2 instruments, with EQ-5D utility scores higher in the whole sample and the no chronic pain groups, whereas SF-6D scores were higher in both chronic pain groups. This is most striking in chronic pain with NC, in which the mean SF-6D scores were 0.15 higher. Other studies have found the average differences in means to be around 0.05 [8,38] although this varies, with higher mean differences (0.15) reported in studies of severe pain conditions such as severe
knee osteoarthritis[37,57]and inflammatory RA[23]. These results
suggest that it may be unreliable, perhaps even invalid, to compare studies of severe pain-related conditions that have used different health utility measures.
4.1.4. Inferring the potential sensitivity to detect a change in utility In an exploratory exercise, we attempted to use these cross-sectional data to infer the potential sensitivity of the 2 instruments if there was an intervention that led to a clinically meaningful reduction in pain. Respondents were classified according to clinically validated cut-points for mild, moderate, and severe
chronic pain[59]. It has been suggested that a clinically important
outcome would be to reduce a patient’s level of pain down to no
worse than mild[34]. We estimated the difference in mean utility
scores between different pain severity groups and compared this
to the MID[52]. We found the mean between-group differences
were above the MID for both scores. However, the differences were higher using the EQ-5D. In particular, the difference in utility between moderate-severe pain was 5-fold, 0.39 using EQ-5D and 0.08 using SF-6D. If such findings were to be found in a randomized trial, in which a patient’s pain severity reduced from severe to mod-erate, this would have substantial implications regarding the cost effectiveness (cost-utility analysis) of the intervention. This analy-sis points to the need for further research using trial and
longitudi-nal data. This is discussed further in Section4.4. Other studies that
compared the utility estimates of EQ-5D and SF-6D in randomized trials found the choice between the instruments to be very
impor-tant regarding the cost-utility estimates produced[8,26,40].
4.2. Study limitations
This study comprises a large dataset derived from a random sample of adults generated from GP practices in the UK. The
relatively low response rate is similar to previous surveys of pain
prevalence[10,32]and is an increasingly common problem in
epi-demiological research[20,28,32,50]. However, the prevalence of
chronic pain and chronic pain with NC was similar to that in other
population studies with higher response rates[47,58]. In relation
to possible response bias and practicality, completion rates were high for both the EQ-5D and SF-12, with slightly higher response rate in favor of the EQ-5D. Similar differences in completion rates
have been reported elsewhere[3,55].
4.3. Future research directions
Researchers and clinicians should consider using generic health utility instruments in pain-related burden of disease studies. The rationale for generating health utility scores is that it provides a generic, preference-weighted index that enables the severity of dif-ferent conditions to be estimated consistently. The ultimate inten-tion is to assist health care planners to allocate resources on a consistent and transparent basis among different diseases and interventions.
There are a number of utility instruments[9,18,19]commonly
used in clinical practice and research. The findings from this study, that the choice between EQ-5D and SF-6D results in major differ-ences in the estimation of utility scores for severe chronic (and neuropathic) pain, questions the validity of comparing studies that have used different instruments. This discordance warrants further investigation in other pain populations.
Our exploratory analysis, using cross-sectional data, compared the mean utility scores between the instruments for patients clas-sified by different cut-points for pain severity. The difference between the mean utility scores of patients with severe and mod-erate pain was 5 times greater when estimated using EQ-5D com-pared with SF-6D. Therefore, the choice between using the EQ-5D and SF-6D not only may be important in estimating the absolute burden of disease, but also may have major implications regarding the economic evaluation of interventions that take a cost-utility approach. It is important to compare these instruments in longitu-dinal studies to assess their sensitivity to detect changes in pain severity.
Finally, it is important to note that cost utility analysis (cost effectiveness analysis) uses measures of relative change, in which improvement in health utilities scores are valued equally,
irrespec-tive of the level of utilities postintervention[35]. This potentially
raises concerns if an intervention involving patients with WTD scores (as measured by EQ-5D) improves health utilities but the patients remain in a state WTD. The National Institute for Health and Clinical Excellence recommends the use of general population
preferences when generating utility index scores [35], meaning
that it is not actually the patients themselves who would prefer death but the general population who score these health states. As people with chronic pain come to accept and adjust over time
[45], the meaning and interpretation of WTD seems to raise both
ethical and practical considerations regarding measuring burden of disease and in the assessment of utility.
Overall, the rationale for attempting to generate utility index scores to generate a consistent HRQoL outcome measure is impor-tant. However, there are a number of practical issues that this
study has raised, in common with other research[8,26,40].
4.4. Conclusions
The measurement of HRQOL is important in chronic pain research, and health utilities derived from generic instruments such as EQ-5D and SF-12/36 can discriminate among group differ-ences for chronic pain with and without NC and greater pain sever-ity. This study demonstrates the substantial lack of agreement
between EQ-5D and SF-6D when estimating the burden of disease for severe chronic pain. Future research should include longitudi-nal and clinical studies to test the validity of utility scores to understand the true health state of patients and also to assess the sensitivity of scores to detect changes in HRQoL as individuals’ pain severity ratings change. The choice between the instruments has substantial implications regarding the estimation of HRQoL in chronic pain patients.
Conflict of interest statement
N.T., K.L., E.A., and K.D. have no conflicts of interest. B.S. has received occasional lecture and consultancy fees, on behalf of his institution, from companies involved in the manufacture of drugs used in treating neuropathic pain. M.S has received research support, consulting fees, or honoraria in the past 3 years from Astellas, Astra Zenica, Grünenthal, GW Pharmaceuticals, Lilly, NAPP, and Pfizer. M.B. has received consultancy fees and lecturer honoraria from Pfizer, Astellas, and Grunenthal in the last 3 years. Kate Dunn is supported by the Wellcome Trust [083572]. The authors assert no personal pecuniary or other conflict of interest in the writing of this article. No writing assistance was used in the production of this article.
Acknowledgements
The authors thank the staff and patients of the participating GP practices. The study was adopted onto the National Institute for Health Research Primary Care Research Network portfolio in England, and we are grateful for their support in identifying and recruiting practices and their patients. Scottish Primary Care Research Network coordinator Amanda Cardy assisted with recruitment and identification of the study samples in the Scottish GP practices. This study was supported by an unrestricted educational grant from Pfizer UK Ltd.
References
[1]Adams R, Walsh C, Veale D, Bresnihan B, FitzGerald O, Barry M. Understanding the relationship between the EQ-5D, SF-6D, HAQ and disease activity in inflammatory arthritis. Pharmacoeconomics 2010;28:477–87.
[2]Attal N, Lanteri-Minet M, Laurent B, Fermanian J, Bouhassira D. The specific disease burden of neuropathic pain: results of a French nationwide survey. PAINÒ
2011;152:2836–43.
[3]Barton GR, Sach TH, Avery AJ, Doherty M, Jenkinson C, Muir KR. Comparing the performance of the EQ-5D and SF-6D when measuring the benefits of alleviating knee pain. Cost Eff Resour Alloc 2009;7:12.
[4]Bennett MI, Smith BH, Torrance N, Potter J. The S-LANSS score for identifying pain of predominantly neuropathic origin: validation for use in clinical and postal research. J Pain 2005;6:149–58.
[5]Bharmal M, Joseph TI, Thomas J. Comparing the EQ-5D and the SF-6D descriptive systems to assess their ceiling effects in the US general population. Value Health 2006;9:262–71.
[6]Bouhassira D, Chassany O, Gaillat J, Hanslik T, Launay O, Mann C, Rabaud C, Rogeaux O, Strady C. Patient perspective on herpes zoster and its complications: an observational prospective study in patients aged over 50 years in general practice. PAINÒ
2012;153:342–9.
[7]Bouhassira D, Lanteri-Minet M, Attal N, Laurent B, Touboul C. Prevalence of chronic pain with neuropathic characteristics in the general population. PAINÒ
2008;136:380–7.
[8]Brazier J, Roberts J, Tsuchiya A, Busschbach J. A comparison of the EQ-5D and SF-6D across seven patient groups. Health Econ 2004;13:873–84.
[9]Brazier JE, Roberts J. The estimation of a preference-based measure of health from the SF-12. Med Care 2004;42:851–9.
[10]Breivik H, Collett B, Ventafridda V, Cohen R, Gallacher D. Survey of chronic pain in Europe: prevalence, impact on daily life, and treatment. Eur J Pain 2006;10:287–333.
[11]Bryan S, Longworth L. Measuring health-related utility: why the disparity between EQ-5D and SF-6D? Eur J Health Econ 2005;50:253–60.
[12]Carmona L, Ballina J, Gabriel R, Laffon A, EPISER Study Group. The burden of musculoskeletal diseases in the general population of Spain: results from a national survey. Ann Rheum Dis 2001;60:1040–5.
[13]Craig R, Mindell J, editors. Health survey for England 2011. Health, social care and lifestyles. Leeds: The Health and Social Care Information Centre; 2012.
[14]Cunillera O, Tresserras R, Rajmil L, Vilagut G, Brugulat P, Herdman M, Mompart A, Medina A, Pardo Y, Alonso J, Brazier J, Ferrer M. Discriminative capacity of the EQ-5D, SF-6D, and SF-12 as measures of health status in population health survey. Qual Life Res 2010;19:853–64.
[15]Dancey C, Reidy J. Statistics without maths for psychology: using SPSS for Windows. London: Prentice Hall; 2004.
[16]Doth AH, Hansson PT, Jensen MP, Taylor RS. The burden of neuropathic pain: a systematic review and meta-analysis of health utilities. PAINÒ2010;149:338–44.
[17]Elliott AM, Smith BH, Penny KI, Smith WC, Chambers WA. The epidemiology of chronic pain in the community. Lancet 1999;354:1248–52.
[18]EuroQoL Group. EuroQoL-a new facility for the measurement of health-related quality of life. Health Policy 1990;16:199–208.
[19]Furlong WJ, Feeny DH, Torrance GW, Barr RD. The Health Utilities Index (HUI) system for assessing health-related quality of life in clinical studies. Ann Med 2001;33:375–84.
[20] Galea S, Tracy M. Participation rates in epidemiologic studies. Ann Epidemiol 2007;17:643–53.
[21]Gaujoux-Viala C, Fautrel B, Guillemin F, Flipo RM, Bourgeois P, Rat AC. Who are the patients with early arthritis with worse than death scores on the EQ-5D? Results from the ESPOIR cohort. Rheumatology 2013;52:832–8.
[22]Harrison MJ, Davies LM, Bansback NJ, McCoy MJ, Farragher TM, Verstappen SM, Hassell A, Symmons DP. Why do patients with inflammatory arthritis often score states ‘‘worse than death’’ on the EQ-5D? An investigation of the EQ-5D classification system. Value Health 2009;12:1026–34.
[23]Harrison MJ, Lunt M, Verstappen SM, Watson KD, Bansback NJ, Symmons DP. Exploring the validity of estimating EQ-5D and SF-6D utility values from the health assessment questionnaire in patients with inflammatory arthritis. Health Qual Life Outcomes 2010;8:21.
[24]International Association for the Study of Pain. Classification of chronic pain. Pain Suppl 1986;3:S1–S225.
[25]Jensen MP, Chodroff MJ, Dworkin RH. The impact of neuropathic pain on health-related quality of life: review and implications. Neurology 2007;68:1178–82. [26]Joore M, Brunenberg D, Nelemans P, Wouters E, Kuijpers P, Honig A, Willems
D, de Leeuw P, Severens J, Boonen A. The impact of differences in EQ-5D and SF-6D utility scores on the acceptability of cost-utility ratios: results across five trial-based cost-utility studies. Value Health 2010;13:222–9.
[27]Kind P, Dolan P, Gudex C, Williams A. Variations in population health status: results from a United Kingdom national questionnaire survey. BMJ 1998;316:736–41.
[28]Korkeila K, Suominen S, Ahvenainen J, Ojanlatva A, Rautava P, Helenius H, Koskenvuo M. Non-response and related factors in a nation-wide health survey. Eur J Epidemiol 2001;17:991–9.
[29]Langley PC. The prevalence, correlates and treatment of pain in the European Union. Curr Med Res Opin 2011;27:463–80.
[30] Langley PC, Ruiz-Iban MA, Molina JT, De Andres J, Castellon JR. The prevalence, correlates and treatment of pain in Spain. J Med Econ 2011;14:367–80. [31]Lillegraven S, Kristiansen IS, Kvien TK. Comparison of utility measures and
their relationship with other health status measures in 1041 patients with rheumatoid arthritis. Ann Rheum Dis 2010;69:1762–7.
[32]McAteer A, Elliott AM, Hannaford PC. Ascertaining the size of the symptom iceberg in a UK-wide community-based survey. Br J Gen Pract 2011;61: e1–11.
[33]McDermott AM, Toelle TR, Rowbotham DJ, Schaefer CP, Dukes EM. The burden of neuropathic pain: results from a cross-sectional survey. Eur J Pain 2006;10:127–35.
[34]Moore RA, Straube S, Aldington D. Pain measures and cut-offs —‘no worse than mild pain’ as a simple, universal outcome. Anaesthesia 2013;68:400–12. [35]National Institute for Health and Clinical Excellence (NICE). Guide to the
methods of technology appraisal. London: National Institute for Health and Clinical Excellence; 2008.
[36] NHS. The Information Centre for Health and Social Care. Attribution dataset GP registered populations 2010–2011. Available at:http://www.hscic.gov.uk/ article/2021/Website-Search?q=gp+registered+populations+&go=Go&area= both[accessed June 23, 2014].
[37]Obradovic M, Lal A, Liedgens H. Validity and responsiveness of EuroQol-5 dimension (EQ-5D) versus Short Form-6 dimension (SF-6D) questionnaire in chronic pain. Health Qual Life Outcomes 2013;11:110.
[38]Petrou S, Hockley C. An investigation into the empirical validity of the EQ-5D and SF-6D based on hypothetical preferences in a general population. Health Econ 2005;14:1169–89.
[39]Poole HM, Murphy P, Nurmikko TJ. Development and preliminary validation of the NePIQoL: a quality-of-life measure for neuropathic pain. J Pain Symptom Manage 2009;37:233–45.
[40] Sach TH, Barton GR, Jenkinson C, Doherty M, Avery AJ, Muir KR. Comparing cost-utility estimates: does the choice of EQ-5D or SF-6D matter? Med Care 2009;47:889–94.
[41]Shrout PE. Measurement reliability and agreement in psychiatry. Stat Methods Med Res 1998;7:301–17.
[42]Smith BH, Elliott AM, Chambers WA, Smith WC, Hannaford PC, Penny K. The impact of chronic pain in the community. Fam Pract 2001;18:292–9. [43]Smith BH, Torrance N, Bennett MI, Lee AJ. Health and quality of life associated
with chronic pain of predominantly neuropathic origin in the community. Clin J Pain 2007;23:143–9.
[44]Stoate HG. Can health screening damage your health? J R Coll Gen Pract 1989;39:193–5.
[45]Thompson M, McCracken LM. Acceptance and related processes in adjustment to chronic pain. Curr Pain Headache Rep 2011;15:144–51.
[46]Torrance N, Ferguson JA, Afolabi E, Bennett MI, Serpell MG, Dunn KM, Smith BH. Neuropathic pain in the community: more under-treated than refractory? PAINÒ2013;154:690–9.
[47]Torrance N, Smith BH, Bennett MI, Lee AJ. The epidemiology of chronic pain of predominantly neuropathic origin. Results from a general population survey. J Pain 2006;7:281–9.
[48]Torrance N, Smith BH, Lee AJ, Aucott L, Cardy AH, Bennett MI. Analysing the SF-36 in population-based research. A comparison of methods of statistical approaches using chronic pain as an example. J Eval Clin Pract 2009;15: 328–34.
[49]Tsuchiya A, Brazier J, Roberts J. Comparison of valuation methods used to generate the EQ-5D and the SF-6D value sets. J Health Econ 2006;25: 334–46.
[50]Van Loon AJ, Tijhuis M, Picavet HS, Surtees PG, Ormel J. Survey non-response in the Netherlands: effects on prevalence estimates and associations. Ann Epidemiol 2003;13:105–10.
[51]Von Korff M, Ormel J, Keefe FJ, Dworkin SF. Grading the severity of chronic pain. PAINÒ
1992;50:133–49.
[52]Walters SJ, Brazier JE. Comparison of the minimally important difference for two health state utility measures: EQ-5D and SF-6D. Qual Life Res 2005;14: 1523–32.
[53]Ware J, Kosinski M, Keller SD. A 12-Item Short-Form Health Survey: construction of scales and preliminary tests of reliability and validity. Med Care 1996;34:220–33.
[54]Ware JE, Sherbourne CD. The MOS 36-item 36-item short-form health survey (SF-36). I. Conceptual framework and item selection. Med Care 1992;30: 473–83.
[55]Whitehurst DG, Bryan S. Another study showing that two preference-based measures of health-related quality of life (EQ-5D and SF-6D) are not interchangeable. But why should we expect them to be? Value Health 2011; 14:531–8.
[56]Whitehurst DG, Bryan S, Lewis M. Systematic review and empirical comparison of contemporaneous EQ-5D and SF-6D group mean scores. Med Decis Making 2011;31:E34–44.
[57]Xie F, Li SC, Luo N, Lo NN, Yeo SJ, Yang KY, Fong KY, Thumboo J. Comparison of the EuroQol and Short Form 6D in Singapore multiethnic Asian knee osteoarthritis patients scheduled for total knee replacement. Arthritis Rheum 2007;57:1043–9.
[58]Yawn BP, Wollan PC, Weingarten TN, Watson JC, Hooten WM, Melton LJ. The prevalence of neuropathic pain: clinical evaluation compared with screening tools in a community population. Pain Med 2009;10:586–93.
[59]Zelman D, Dukes CE, Brandenburg N, Bostrom A, Gore M. Identification of cut-points for mild, moderate and severe pain due to diabetic peripheral neuropathy. PAINÒ2005;115:29–36.