MULTI-LEVEL WEBSITE BENCHMARKING:
TYPOLOGICAL COLLATION OF RECENT APPROACHES
Leonie Cassidy
School of Business James Cook University, Cairns, Australia
Email: [email protected]
John Hamilton
School of Business James Cook University, Cairns, Australia
MULTI-LEVEL WEBSITE BENCHMARKING:
TYPOLOGICAL COLLATION OF RECENT APPROACHES
ABSTRACT
Website benchmarking approaches can be classified by type and collated as a framework. A combined customer website perspective (satisfaction, loyalty, design, quality) and business website perspective (usability, effectiveness, strategy, performance) delivers a multi-level website benchmarking approach. This offers a broad-scale analysis pathway capable of delivering universal, detailed, at-level website benchmarking. A weighted sum-score approach builds an overall website benchmark score, enabling website competitor comparisons across multiple levels. This approach offers a detailed guide to business managers, web designers and web analytics interpreters seeking to implement competitive website changes.
Keywords: Improvement, technology, innovation, integration, e-business, service industries
WEBSITE BENCHMARKING
Website benchmark evaluation studies are approached from many angles. Some deploy a narrow approach considering limited features of the website (Cassidy & Hamilton, 2011), whilst others adopt a broader approach (Kim, Kim, & Kandampully, 2009), however depth of evaluation is seldom a prime consideration from either perspective. Studies are typically survey-based (or mathematically reasoned) geared to establishing a particular method or a particular website analytics approach. Survey-based studies involve website user opinion conducted as point-in-time-and-place collections, with degrees of restrictive coverage (Novak, Hoffman, & Yung, 2000). Hence managers mapping pathways to improve and/or refocus websites (Cassidy & Hamilton, 2012) should astutely interpret their benchmarking findings. To build understanding concerning website benchmarking, we now collate (and type) recent benchmarking approaches.
WEBSITE BENCHMARKING APPROACHES
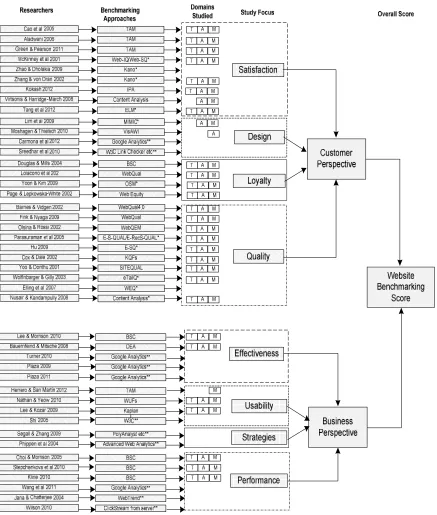
benchmarking approaches may be collated in several ways, such as type of approach, and method of research. In this instance, and shown in Figure 1, we collate past research approaches by their functional/dependent construct and capture the functional groups within customer or business domains. Hence we close the gaps within past literary approaches.
INSERT FIGURE 1 ABOUT HERE
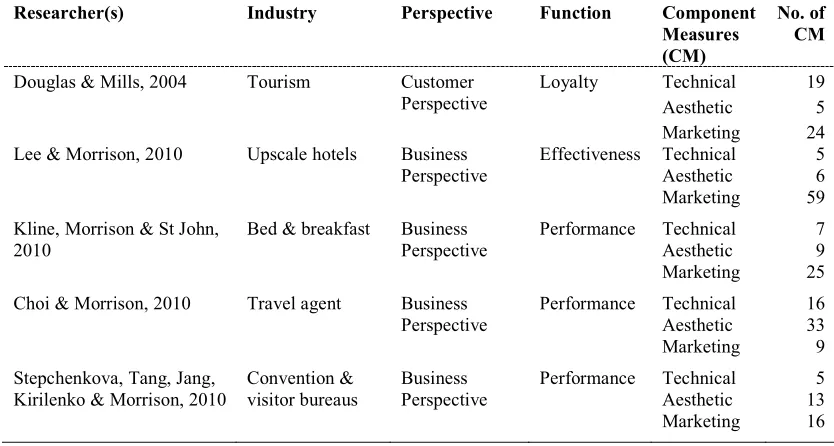
The component measures of each approach are collated into five mutually exclusive blocks (technical (T), aesthetic (A), marketing (M), web-analytics (W), and opinion-based (O)). Technical component measures are associated with the information technology or ‘back-end’ of a website. Aesthetic component measures are visual or ‘front-end’ aspects of a website. Marketing component measures encompass two-way communication with users as well as marketing. Web-analytics component measures include visitors, returning visitors, length of visit, and pathway to site, obtained with software such as Google analytics and WebTrends. Opinion-based component measures are from surveys which include questions such as: ‘is this site fun?’ An example relating to T, A, and M from the modified BSC studies is shown at Table 1 in the Appendix (detailed tables will be provided in a forthcoming publication).
These website benchmarking approaches may be collated into eight (mutually exclusive) functions of a website (satisfaction, design, loyalty, quality, effectiveness, usability, strategies, and performance). Satisfaction may be determined by repeat visits to a website and/or length of visit (Zhang & von Dran, 2000). With several differing component measures contributing to website satisfaction, these may alter over time with user experience (Zhao & Dholakia, 2009).
Website effectiveness is assisted by component measures that may contribute to the user achieving specified goals with accuracy and completeness (De Marsico & Levialdi, 2008). Usability is defined by Nielsen and Loranger (2006) as ‘how quickly people can learn to use something, how efficient they are while using it, how memorable it is, how error-prone it is, and how much users like using it’. However a more concise definition is: usability occurs when the correct set of component measures are present (Nathan & Yeow, 2010). Website strategies are website improvement component measures that may be measurable with advanced analytics (Phippen, Sheppard, & Furnell, 2004; Segall & Zhang, 2009). While performance may be maximised when all necessary component measures are present in a website and user expectations are met (Phippen et al, 2004).
As shown in Figure 1 these website functions are grouped into higher level domains of customer-perspective (satisfaction, design, loyalty and quality) and business-customer-perspective (effectiveness, usability, strategy and performance). When combined these domains then offer an overall website benchmark score. We now discuss the approaches within each function of the customer perspective domain.
CUSTOMER PERSPECTIVE APPROACHES
Satisfaction
Although some of the following studies do not specifically say ‘satisfaction’ the measures used may be collated as satisfaction component measures. To determine satisfaction with tourism websites, marketers use Importance-performance Analysis (IPA) (combined Likert 5 point importance and performance scales). From here strengths and weaknesses may be identified (Kokash, 2012).
The Elaboration Likelihood Method (ELM) employed by Tang, Jang, and Morrison (2012) uses a Likert communication questionnaire to rate user interest and involvement in a specific destination. Respondents then rate information quality/design, thought responses, attitude to website (and destination), and future intentions towards the website (or destination).
marketing communications integration; online demonstration; online price quoting; online service delivery/integration platforms; value adding elements; online data collection) of United Kingdom print suppliers (Virtsonis & Harridge-March, 2008). These communication constructs are developed into brand positioning component measures and mutually exclusively coded into present/absent measures (Virtsonis & Harridge-March, 2008). Such an approach can assist management, but with limited breadth website analysis is restrictive (Virtsonis & Harridge-March, 2008).
Nine literature identified constructs (McKinney, Yoon, & Zahedi, 2001) are combined with expectation-disconfirmation effects and Web Information Quality (Web-IQ) and Web System Quality (Web-SQ) to investigate user satisfaction of service industries’ websites (McKinney et al, 2001). From their university-student questionnaire McKinney et al (2001) show Web-IQ and Web-SQ both influence user satisfaction.
The Kano model is adapted to website design by Zhang and von Dran (2002) categorising website component measures as basic, performance, and exciting constructs. Basics are those taken-for-granted; performers contribute to performance quality, and exciters are those outside the user’s normal expectations. Student respondents to questionnaires are required to judge and recall from experience when using websites of service industries whether (over time) the quality of basic component measures moves into performance or exciting component measures.
A modified Kano model is also used by Zhao and Dholakia (2009) to identify how five student-weighted constructs of website component measures affect user satisfaction. They find user experience influences results, therefore changes in interactivity against satisfaction should be considered when website managers seek to optimise their websites.
Design
Although important to a website, design has not been studied to the same extent as website satisfaction. To test website design quality for errors Sreedhar, Chari, and Ramana (2010) use W3C Link Checker, W3C Markup Validation Service, Webpage analyser, and Website Extractor. Clustering analysis and data mining algorithms are employed by Carmona, Ramirez-Gallego, Torres, Bernal, del Jesus, and Garcia (2012) to extract useful knowledge on website design from one year of Google analytic data.
Not all approaches are to design are objective. Multiple-Indicator-Multiple-Cause (MIMIC) approach subjectively measures content and transaction quality; playfulness; and security against user intention to use an e-shopping site (Lim, Heinrichs & Lim, 2009). Survey respondents are university students, and hence MIMIC may not be a practical approach. Other studies concentrate on one area of website design, Moshagen and Thielsch (2010) utilise Visual Aesthetics of Website Inventory (VisAWI) that is four constructs of eighteen perceived website visual aesthetics (simplicity, diversity, colourfulness, and craftsmanship).
Loyalty
To investigate high constructs influencing user revisit-intention/loyalty, Loiacono, Chen and Goodhue’s (2002) Website Quality (WebQual) employs ease-of-use, usefulness, entertainment, and complementary relationship. By 2007 Loiacono, Watson, and Goodhue (2007) combine the theory of reasoned-action and TAM, using focus-groups/telephone-interviews, and student beta testing, creating a refined WebQual suitable for evaluating e-business/commerce website loyalty.
Yoon and Kim’s (2009) Online Store Success Model (OSM) uses five online questionnaire constructs (system, information, service qualities, trust, and customer loyalty) to test relationships/influences between constructs, and loyalty to a website.
Quality
Four main functions of Key Quality Factors (KQFs) help describe a website that meets the expectations of: ease-of-use, customer confidence, online resources, and relationship services. Each contains several sub-functions with embedded component measures (Cox & Dale, 2002). Some KQFs score Yes (1) or No (0), whilst site map scores rate as: easily accessible on every page (2), must search (1), and none (0). Thus, a net website KQF score is generated to assess the quality of websites.
Focus groups plus an online panel are utilised by Wolfinbarger and Gilly (2003) to establish (and scale) the eTailQ of websites. They consider fulfilment/reliability, website design, privacy/security, and customer service; testing for relationships between quality, satisfaction, loyalty, and user-attitude towards a website. Developed by Elling, Lentz and de Jong (2007) - the Website Evaluation Questionnaire (WEQ) measures the quality dimensions of informational websites. WEQ contains opinion-based questions such as ‘I think this website is fast’.
Another Website Quality (WebQual) approach is WebQual4.0 (Barnes & Vidgen, 2002). This updates and differs from Loiacono et al’s 2002 WebQual approach. WebQual4.0 uses an on-line survey of usability, information quality, and service interaction quality to measure (and possibly redesign) and refocus a website.
To benchmark website quality between public accounting firms Fink and Nyaga (2009) add riskiness to WebQual. The study is in a controlled laboratory setting using post graduate university students. Follow-up studies should be conducted to confirm results (Fink & Nyaga, 2009). The Web Quality Evaluation Method (WebQEM) is a four step process with particular use in early stages of website development (Olsina & Rossi, 2002). Once the website is operating, it is generally directed towards the website’s products.
approach, Hu (2009) uses an online survey. Then generates a fuzzy numbers algorithm of forty-five component measures (grouped into twelve categories) determining user subjective preferences under an automated degrees-of-importance-of-criteria.
The quality of e-business/commerce sites continues to grow in importance as users digress from traditional shopping methods (Yoo & Donthu, 2001). Students assist Yoo and Donthu (2001) in developing SITEQUAL evaluating user quality perceptions in internet shopping with ease-of-use, aesthetic design, processing speed, and security.
To assess quality functions (navigability, playfulness, information quality, trust, personalisation, responsiveness) of six travel websites Nusair and Kandampully (2008) use content analysis. Fifty three component measures assess user e-satisfaction to indicate where website improvements are suitable. However, not all component measures within the six quality functions are deployed in this study (Nusair & Kandampully, 2008).
In the following section we discuss approaches within each function of the business perspective domain.
BUSINESS PERSPECTIVE APPROACHES
Effectiveness
Website effectiveness can be evaluated using a number of different benchmarking approaches. A modified BSC is used by Lee and Morrison (2010) to develop a set of website critical success factors. The technical quadrant is assessed with a commercial tool as with previous BSC studies, with remaining quadrants evaluated by a group of university students.
Data Envelopment Analysis (DEA), a linear programming model is preferred by Bauernfeind and Mitsche (2008) focusing on tourism organisations. DEA has five input (searchability, linguistic offer, number of forms, travel preparation criteria, updating) and two output measures (visits and email inquiries), delivering a mathematical result for website efficiency which can be utilised by managers/designers of websites within tourism organisations (Bauernfeind & Mitsche, (2008).
value, then track the number of accessions to the journal using Google analytics. Another use for Google analytics is evaluating how effective a tourism website is at attracting users, and directing them to their goals (Plaza, 2009; 2011).
Usability
Measuring website usability across industries Nathan and Yeow (2002) identify seven Web Usability Factors (WUFs), use of colour and fonts, graphics and multimedia, clarity of goals, trust, interactivity, ease of navigation, and download speed. An online survey of students determines the critical set of WUFs differs from industry to industry, hence this approach may aid in industry specific website design (Nathan & Yeow, 2010).
Kaplan’s landscape preference model is modified to assess a website’s usability, employing legibility, coherence, variety and mystery (Lee & Kozar, 2009). Here travel sites and electronics sites are scenario and questionnaire assessed by university students to explain differences in attitudes and purchase intentions of website users.
A commercial approach, Bobby Online Free Portal, that checks website coding according to the World Wide Web Consortium’s (W3C) accessibility (usability) guidelines for websites, is employed in Shi’s (2005) study of visitor information centre homepage content. However this approach focuses on accessibility/usability measures, neglecting other areas of a website.
TAM based user and manager focus groups are chosen by Herrero and San Martin (2012) to evaluate user intentions concerning rural tourism accommodation websites. They determine interactivity and navigability influence perceived ease of use (usability) of a website.
Strategy
However, website analytics requires careful interpretation of the information before it can be applied (Phippen et al, 2004; Weischedel, Matear & Deans, 2005).
Performance
Website performance can be measured in a number of ways, such as web analytics and BSC. Advanced Google analytics is employed by Wang, Shen, Chen, and Wedman (2011) to track search traffic, direct traffic, and referral traffic to a website. WebTrends (server-generated statistics) is used over 13 months by Jana and Chatterjee (2004) to determine hits, page views, visits, and visitors and to gauge users directed to a site by a search engine. To assess the ability of new marketing strategies to increase website sales Wilson (2010) uses clickstream data and web analytic software. In combination these track movement of users through the website and assess which new marketing strategies work best.
A modified BSC is preferred to assess website performance of travel retailers (Choi & Morrison, 2005), convention and visitor bureaus (Stepchenkova, Tang, Jang, Kirilenko, & Morrison, 2010), and bed and breakfast accommodation (Kline, Morrison, & St. John, 2004). Each study assesses the technical area with a commercially available tool, and uses similar techniques across the remaining quadrants. The customer, marketing, and travel agency perspectives of Choi and Morrison’s (2005) study are assessed by a group of students completing a dichotomous yes/no questionnaire. A present/absent questionnaire is used by Stepchenkova et al (2010) for customer friendliness and usability; effectiveness of marketing destination; and information and content. While Kline et al (2004) use a combination of dichotomous yes/no and 4-point Likert scale questionnaire for user friendliness, site attractiveness, and marketing effectiveness.
IMPLICATIONS OF RESEARCH
Theoretical Implications
Some chose to benchmark only one set of component measures such as Moshagen and Thielsch (2010) who concentrate on the visual (aesthetic) component measures of a website. Other studies selectively choose benchmarking measures to capture specific component measures of specific functions - but each time they only apply limited component measures. Still other studies collect data under subjective opinion methods, often coupled with students as the respondents. Hence, combinations of past research can engage larger numbers of component measures across more functions and domains thereby offering more detailed benchmarking analysis.
Practical Implications
Comparisons between studies remain difficult, even when the same approach is used as the component measures deployed may differ and/or the data collection methods may differ.
Further many studies use student respondents/assessors to obtain data. Such studies should not be generalised and applied to the general population of website users/customers. In addition, as time progresses both the web-business and its end-users’ capabilities advance. Hence, it is wise to redo such theoretical work – applying latest technologies to the website, and also seeking current responses from its general users/customers.
Many recent website evaluation (benchmarking) approaches employ time-consuming data collection and analysis methods more suitable for research than practical use. These methods are no longer suitable for business managers, web designers and web analytics interpreters who require such information as near real-time findings. This area remains poorly researched.
FUTURE RESEARCH IMPLICATIONS
Measurement Aspects
software generated groupings recorded in an understandable and comparative format offers considerable interpretative value to business managers, web designers and web analytics assessors.
Theoretical Aspects
The pace of website innovation development, information technology capabilities and socially engaging software necessitates the development of an on-line benchmarking/collations approach that quickly, fully and accurately evaluates (and compares) websites. The existing website evaluation approaches lack the capabilities to capture the benchmarking component measures sourced in this study. Figure 1 demonstrates how these data collection approaches can be typologically grouped into a universal collation framework for website benchmarking.
Management Aspects
Business managers, website designers and web analytics assessors seek approaches that deliver website information in a timely manner. To remain competitive or move ahead of the competition they interpret this information and improve their organisation’s website via website updates, and/or re-designs/refocusing. This helps keep their website information current, and may capture new website interactive elements along with social media changes.
To achieve maximum value from website benchmarking, scores obtained should be comparable at each level of a website (function, domain, overall). The component measures present on a website set the basis for its benchmarking score. To obtain the benchmarking score we treat each component measure as having equal importance to a website. We note the website literature does not consistently identify any difference in the relative importance of any of the component measures.
We acknowledge there may not be an even distribution of component measures within each website function. Hence we suggest a weighting method be applied to facilitate score comparisons between websites. We apply a weighted score (out of 10) to each function. For example,
7
As each domain may not have the same amount of functions, the same method is applied to achieve comparable weighted scoring across domains.
We acknowledge this assumption has limitations; however it allows us to compare at each level, to sum across the different levels, and to develop an overall website benchmark score with measurable comparison capabilities against competitor websites. This weighted, sum-scoring approach highlights the website’s weaknesses and strengths. It remains a useful change management guide to business managers, web designers and web analytics interpreters.
CONCLUSION
This article considers recent website benchmarking approaches and typologically builds them into a new collation framework for website benchmarking. We elucidate a different approach to website benchmarking where four customer web perspectives (satisfaction, loyalty design, quality), and/or four business web perspectives (usability, effectiveness, strategy and performance) combine to offer a different, yet comprehensive benchmarking approach.
Our combined, multi-level website benchmarking approach offers a broad-scale analysis pathway - capable of delivering universal, detailed and at-level benchmarking. Our weighted and sum-scoring approach builds at-level scores into an overall website benchmarking score. This approach offers comparisons between different levels of measurement, and between items within the same level (or at-level) of benchmarking.
This typology-developed, broad-scale, sum-scoring approach also highlights website weaknesses and strengths. Thus, a more universal and detailed benchmarking approach is available for business managers, web designers and web analytics interpreters as they seek to implement competitive website changes.
References
Barnes SJ & Vidgen RT (2002) An integrative approach to the assessment of e-commerce quality, Journal of Electronic Commerce Research 3: 114-127.
Barnes SJ & Vidgen R (2003) Measuring web site quality improvements: a case study of the forum on strategic management knowledge exchange, Industrial Management and Data Systems 103: 297-309.
Bauernfeind U & Mitsche N (2008) The application of the data envelopment analysis for tourism website evaluation, Information Technolgy and Tourism 10: 245-257.
Cao M, Zhang Q & Seydel J (2005) B2C e-commerce web site quality: an empirical examination, Industrial Management and Data 105: 645-661.
Carmona CJ, Ramirez-Gallego S, Torres F, Bernal E, del Jesus MJ & Garcia S (2012) Web usage mining to improve the design of an e-commerce website: OrOliveSur.com, Expert Systems with Applications 39: 11243-11249.
Cassidy L & Hamilton J (2011) Website benchmarking: evaluating scaled and dichotomous approaches, The Eleventh International Conference on Electronic Business 1: 408-412.
Cassidy L & Hamilton J (2012) Website benchmarking: a comprehensive approach, Proceedings of the 2012 Hawaii International Conference on Business 1: 543-548.
Choi S & Morrison AM (2005) Website effectiveness for bricks and mortar travel retailers, International Journal of Tourism and Hospitality Research 16: 63-78.
Cox J & Dale BG (2002) Key quality factors in web site design and use: an examination, International Journal of Quality and Reliability Management 19: 862-888.
Douglas A & Mills JE (2004) Staying afloat in the tropics: applying a structural equation model approach to evaluating national tourism organisation websites in the Caribbean, Journal of Travel and Tourism Marketing 17: 269-293.
Elling S, Lentz L & de Jong M (2007) Website evaluation questionnaire: development of a research-based tool for evaluating informational websites, in: Wimmer M, Scholl J & Grönlund Å (Eds) Electronic Governmen, 293-304, Springer, Berlin. [Note: Book chapter]
Green DT & Pearson JM (2011) Integrating website usability with the electronic commerce acceptance model, Behaviour and Information Technology 30: 181-199.
Herrero A & San Martin H (2012) Developing and testing a global model to explain the adoption of websites by users in rural tourism accommodations, international Journal of Hospitality Management In Press.
Hoffman DL, Novak TP & Yung YF (2000) Measuring the customer experience in online environments: a structural modelling approach, Marketing Science 19(1): 22-42.
Hu Y-C (2009) Fuzzy multiple-criteria decision making in the determination of critical criteria for assessing service quality of travel websites, Expert Systems with Applications 36: 6439-6445. Jana S & Chatterjee S (2004) Quantifying web-site visits using web statistics: an extended
cybermetrics study, Online Information Review 28: 191-199.
Kline SF, Morrison AM & St. John A (2004) Exploring bed and breakfast websites: a balanced scorecard approach, Journal of Travel and Tourism Marketing 17: 253-267.
Kokash HA (2012) Jordanian travel agencies' websites assessment: experts vs tourists' perseptions, International Journal of Marketing Studies 4: 80-92.
Lee J & Morrison AM (2010) A comparative study of web site performance, Journal of Hospitality and Tourism Technology 1: 50-67.
Lee Y & Kozar KA (2009) Designing usable online stores: a landscape preference perspective, Information and Management 46: 31-41.
Lim K-S, Heinrichs JH & Lim J-S (2009) Testing a MIMIC moel of e-shopping site usage, International Journal of Retail and Distribution Management 37: 852-866.
Loiacono ET, Chen DQ & Goodhue DL (2002) WebQual revisited: predicting the intent to reuse a website, Eighth Americas Conference on Information Systems 1: 301-309.
Loiacono ET, Watson RT & Goodhue DL (2007) WebQual: an insturment for consumer evaluation of web sites, International Journal of Electronic Commerce 11: 51-87.
Moshagen M & Thielsch MT (2010) Facets of visual aesthetics, International Journal of Human-Computer Studies 68: 689-709.
Nathan RJ & Yeow PHP (2010) Crucial web usability factors of 36 industries for students: a large-scale empirical study, Electronic Commerce Research 11: 151-180.
Nusair KK & Kandampully J (2008) The antecedents of customer satisfaction with online travel services: a conceptual model, European business Review 20: 4-19.
Olsina L & Rossi G (2002) Measuring Web application quality with WebQEM, Multimedia, IEEE 9: 20-29.
Page C & Lepkowska-White E (2002) Web equity: a framework for building consumer value in online companies, Journal of Consumer Marketing 19: 231-248.
Parasuraman A, Zeithaml VA & Malhotra A (2005) E-S-QUAL a mulitple-item scale for assessing electronic service quality, Journal of Service Research 7: 213-233.
Phippen A, Sheppard L & Furnell S (2004) A practical evaluation of web analytics, Internet Research 14: 284-293.
Plaza B (2009) Monitoring web traffic source effectiveness with Google analytics, Aslib Proceedings: New Information Perspectives 61: 474-482.
Plaza B (2011) Google analytics for measuring website performance, Tourism management 32: 477-481.
Segall RS & Zhang Q (2009) Web mining technologies for customer and marketing surveys, Kybernetes 38: 925-949.
Shi Y (2006) The accessibility of Queensland visitor information centres' websites, Tourism management 27: 829-841.
Sreedhar G, Chari DAA & Ramana DVVVV (2010) A qualitative and quantitaive frame work for effective website design, International journal of computer applications 2: 71-79.
Stepchenkova S, Tang L, Jang SS, Kirilenko AP & Morrison AM (2010) Benchmarking CVB website performance: spatial and structural patterns, Tourism management 31: 611-620.
Turner SJ (2010) Website statistics 2.0: using Google analytics to measure library website effectiveness, Technical Services Quarterly 27: 261-278.
Virtsonis N & Harridge-March S (2008) Website elements in B2B communications: a case from the UK print industry, Marketing Intelligence and Planning 26: 699-718.
Wang X, Shen D, Chen H-l & Wedman L (2011) Applying web analytics in a K-12 resource inventory, The Electronic Library 29: 20-35.
Weishchedel B, Matear S & Deans KR (2005) A qualitative approach to investigating online strategic decision making, Qualitative Market Research: An International Journal 8: 61-76.
Wilson RD (2010) Using clickstream data to enhance business-to-business web site performance Journal of Business and Industrial Marketing 25: 177-187.
Wolfinbarger M & Gilly MC (2003) eTailQ: dimensionalising, measuring and predicting etail quality, Journal of Retailing 79: 183-198.
Yoo B & Donthu N (2001) Developing a scale to measure the perceived quality of an internet shopping site (SITEQUAL), Quarterly Journal of Electronic Commerce 2: 31-47.
Yoon C & Kim S (2009) Developing the causal model of online store success, Journal of Organizational Computing and Electronic Commerce 19: 265-284.
Zhang P & von Dran GM (2002) User expectations and rankings of quality factors in different web site domains, International Journal of Electronic Commerce 6: 9-33.
Appendix
Table 1:Modified Balanced Scorecard Approaches
Researcher(s) Industry Perspective Function Component
Measures (CM)
No. of CM
Douglas & Mills, 2004 Tourism Customer Perspective
Loyalty Technical Aesthetic Marketing
19 5 24 Lee & Morrison, 2010 Upscale hotels Business
Perspective
Effectiveness Technical Aesthetic Marketing
5 6 59
Kline, Morrison & St John, 2010
Bed & breakfast Business Perspective
Performance Technical Aesthetic Marketing
7 9 25
Choi & Morrison, 2010 Travel agent Business Perspective
Performance Technical Aesthetic Marketing
16 33 9
Stepchenkova, Tang, Jang, Kirilenko & Morrison, 2010
Convention & visitor bureaus
Business Perspective
Performance Technical Aesthetic Marketing
T = Technical; A = Aesthetic; M = Marketing; * = Opinion-based; ** = Web-analytics