UNIVERSITY OF SOUTHERN QUEENSLAND FACUTLY OF ENGINEERING AND SURVEYING
Measurement of Waste in Concrete
Construction using Lean Construction
Methodologies
A dissertation submitted by
George Kenneth Watson
In fulfilment of the requirements of
Bachelor of Engineering Honours (Civil)
Abstract
This dissertation develops and analyses the quantification of all wastes present in particular construction process. This has been conducted from a lean construction perspective where waste has been defined as any non-value adding process or activity. The specific processes chosen were concrete paving, hand-pouring concrete and the installation of formwork. The types of wastes present in the construction industry have been researched and a comprehensive list collated. A number of waste classifications have been evaluated to organise these wastes into manageable groups. These classifications were also selected on their usability and the potential techniques of measurement. A suitable format for waste reporting has been established and trialled in a construction environment. This has been evaluated by Professional Engineers in management positions within the construction industry.
Due to the individual nature of construction projects there are significant inefficiencies in comparison to similar industries such as manufacturing. Of these wastes concrete construction has been deemed the largest contributor to wastage. This leads us to the question of how do we measure not only the materials wasted but the other types of waste in processes. This needs to be answered as efficiencies cannot be improved without the knowledge of where and how they are occurring.
This project has been conducted utilising; theoretical research, practical on-site observations and by seeking industry feedback on the conclusions drawn from these investigations. The theoretical research took the form of a literature review on lean construction methodologies and types of ‘waste’. This focused on waste management and classification and how this has been applied to construction projects around the world. Practical on site observations were used to develop activity mapping and waste sampling which were used in the case studies for waste classification and quantification. From this a suitable format for waste reporting has been established and trialled in a construction environment. Industry feedback was sought in the form of structured interviews and an accompanying questionnaire. These interviews were conducted with four Engineering Managers working on a variety of large construction projects. From this evaluation improvements can be made to this structure and a future direction for this research has been determined.
Limitations of Use
The Council of the University of Southern Queensland, its Faculty of Health, Engineering & Sciences, and the staff of the University of Southern Queensland, do not accept any responsibility for the truth, accuracy or completeness of material contained within or associated with this dissertation. Persons using all or any part of this material do so at their own risk, and not at the risk of the Council of the University of Southern Queensland, its Faculty of Health, Engineering & Sciences or the staff of the University of Southern Queensland.
Candidates certification
I certify that the ideas, designs and experimental work, results, analysis and conclusions set out in this dissertation are entirely my own efforts, except where otherwise indicated and acknowledged. I further certify that the work is original and has not been previously submitted for assessment in any other course or institution, except where specifically stated.
George Kenneth. Watson 0061004847
Acknowledgements
I would like to acknowledge and thank those who have provided assistance throughout the completion of this research project. Without these people I would not have been able to achieve the aim and objectives of this dissertation.
I would like to thank my supervisor Dr Vasantha Abeysekera for his significant assistance and guidance throughout my research.
Contents
Abstract ... ii
Limitations of Use ... iii
Candidates certification ... iv
Acknowledgements ... v
List of figures ... x
List of tables ... xii
List of appendices ... xiii
List of Abbreviations ...xiv
Introduction ... 1
1.1 Outline... 1
1.2 Introduction ... 1
1.4 Aim ... 1
1.3 The Problem ... 2
1.4 Research Objectives ... 2
1.6 Conclusions ... 3
Literature ... 4
2.1 Background ... 4
2.2 Lean construction... 5
2.3 Types of waste ... 6
2.4 Identification of waste – Transformation flow value ... 10
2.6 Measurement of waste – Value Stream Mapping (VSM) ... 14
2.6.1 Process activity mapping for Construction Process Analysis (CPA) ... 14
2.6.2 Supply Chain response matrix ... 19
2.6.3 Product variety funnel ... 19
2.6.4 Quality filter mapping ... 20
2.6.5 Demand amplification mapping ... 20
2.6.6 Decision point analysis ... 20
2.6.7 Physical structure mapping ... 21
2.6.8 Commitment Reliability as a measure of waste ... 23
2.6.9 Activity Sampling as an estimate of waste ... 25
2.6.10 Multiple Activity Chart (MAC) ... 27
2.7 Classification of Construction Waste ... 29
2.7.2 Lean Construction ... 32
2.7.3 4D construction site management ... 33
2.7.5 Last Planner System for concreting operations (LPS) ... 35
2.7.6 Classification of waste by source ... 38
2.7.7 Classification of waste by processes ... 39
2.7.8 Management classification of waste ... 40
2.7.9 PESTLE classification of waste ... 41
2.7.10 Project management classification of waste ... 41
2.7.11 Value adding classification of waste ... 42
2.8 Concrete construction ... 43
2.8.1 Technology ... 43
2.8.2 Current methodologies ... 43
2.8.3 Current Reporting Structures ... 43
Xstrata coal – Project Waste Management ... 45
Project Status Report Template ... 47
2.9 Summary of literature ... 48
Method ... 50
3.1 Overview ... 50
3.2 Methodology ... 50
3.2.1 Literature Review ... 50
3.2.2 Questionnaire ... 51
3.2.3 Reporting structure ... 51
3.2.4 Case studies ... 51
3.2.5 Data collection & Results ... 51
3.2.6 Discussion and Recommendations ... 52
3.2.6 Summary, Conclusions and Further work ... 52
Reporting Structure ... 53
4.1 Introduction ... 53
4.2 Development of reporting structure ... 53
4.2.1 Reporting in the Last Planner System ... 53
4.2.1 Selection of Waste Classification ... 55
4.2.2 KPI’s ... 56
4.2.3 Reporting structure ... 58
Case studies ... 62
5.1 Overview of Wellcamp Airport Construction ... 62
5.2 Concrete paving ... 64
5.2.1 The Process ... 64
5.2.2 Waste KPI’s ... 67
Design waste ... 74
5.3 Hand Pours ... 76
5.3.1 The Process ... 76
5.3.2 Waste KPI’s ... 78
5.4 Formwork Assembly... 83
5.4.1 The Process ... 83
5.4.2 Waste KPI’s ... 86
5.5 Sample Weekly Waste Report ... 93
Industry Feedback ... 101
6.1 Aim ... 101
6.2 Format ... 101
6.3 Target Group ... 102
6.4 Method ... 102
6.3 Questionnaire ... 104
6.4 Results ... 108
6.5 Discussion ... 113
6.5.1 Lean Construction ... 113
6.5.2 Waste & waste reducing Strategies ... 113
6.5.3 Report Content & Structure ... 113
6.5.4 Tools and Techniques... 114
6.5.5 Frequency ... 114
6.5.6 Feasibility ... 114
6.5.7 Additional Comments ... 115
Conclusions ... 116
7.1 Summary ... 116
7.2 Review of the Problem ... 116
7.3 Conclusion ... 118
7.4 Limitations of the study ... 118
Appendices ... 120
Appendix A – Project Specification ... 120
Appendix B – Monthly Site Waste Report Template ... 121
Appendix C – RAS field sampling sheets ... 127
Appendix D – Questionnaire Feedback Forms ... 132
Reference List ... 148
List of figures
Number
Title
Figure 1 - Sources and cause of construction waste. (Bossink 1996 p 59) ... 7
Figure 2 - Comprehensive list of wastes developed through research. ... 9
Figure 3 - Transformation model ... 10
Figure 4 - Flow model applied to the transformation of materials repeated over two cycles. (Abeysekera 2009, p. 205) ... 11
Figure 5 - Flow process of concrete batching and on-site production (Dunlop & Smith 2004, p. 57). 11 Figure 6 - Relationship and expectations of the supplier and customer (Abeysekera 2009a, p. 217). 11 Figure 7 - Flow diagram of Transformation Flow Value applied to management ... 12
Figure 8 - Symbols JIS Z 8206 (Lee et al. 1999, p. 65) ... 15
Figure 9 - Flow process chart of steel erection process (Lee et al. 1999, p. 66) ... 16
Figure 10 - Plan view flow diagram of steel erection process (Lee et al. 1999, p. 67) ... 17
Figure 11 - Plan view of construction with implemented improvements ... 18
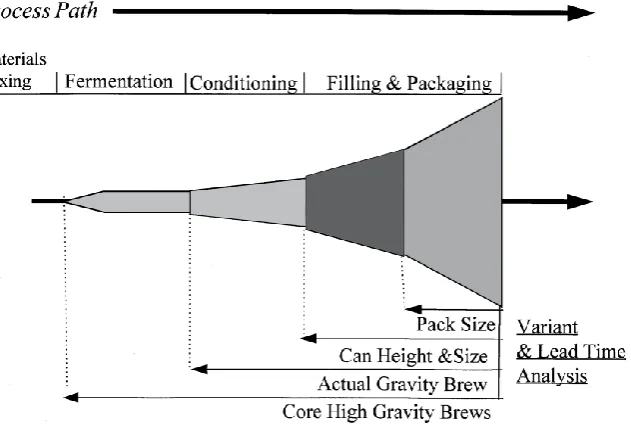
Figure 12 - Product variety model applied to a brewing example (Hines & Rich 1997, p. 54). ... 19
Figure 13 - Quality filter mapping applied to automotive supply chain (Hines & Rich 1997, p. 55). ... 20
Figure 14 - Physical structure map of an automotive industry example (Hines & Rich 1997, p. 58) ... 21
Figure 15 - Decision support tool used based of correlations between tools and wastes. (Hines & Rich 1997, p. 50) ... 22
Figure 16 - Layout for application of VALSAT to determine effectiveness of waste identification tools. (Hines & Rich 1997, p. 60) ... 23
Figure 17 - Expected vs actual progress of tasks within a project plan.(Sharma 2013, p. 25) ... 24
Figure 18 - Commitment Reliability calculation for tasks represented in the above schedule. (Sharma 2013, p. 25) ... 24
Figure 19 - Activity sample example demonstrating collected data and calculations. ... 25
Figure 20 - Normal distribution demonstrating the range of data within a confidence level of 95%. . 26
Figure 21 - Multiple activity chart of a concreting operation transporting concrete using 3 wheelbarrows and a hoist. (Abeysekera 2009b, p. 263) ... 27
Figure 22 - Optimised version of the original Multiple Activity chart where all three wheelbarrows are used and empty barrows are sent down straight after filled barrow is unloaded. (Abeysekera 2009b, p. 265) ... 28
Figure 23 - Representation of material inputs and waste outputs for a construction site. (Llatas 2011, p. 1274) ... 31
Figure 24 - Optimisation of movements of concrete pumps.(Lin & Haas 1996, p. 220) ... 33
Figure 25 - Building Information Model representing a real construction operation. (Popov et al. 2010, pp. 364,5) ... 35
Figure 26- Last Planner System flowchart. (Choo 2003, p. 40) ... 36
Figure 27 - The Last Planer System in terms of should, can, will and do. (Ballard 2000, pp. 3-15) ... 37
Figure 28 - Classification of wastes according to management structures. ... 40
Figure 29 - PESTLE framework for classification of wastes according to their specific impacts. (Abeysekera, 2014) ... 41
Figure 31- Waste classification flowchart (Xstrata coal 2014). ... 46
Figure 32 - Relationship between waste reporting, planning and the construction process itself. ... 53
Figure 33 - Model of continuous improvement applied to waste reduction. (HARRIS 2006, p. 39) .... 54
Figure 34 - Example template for visually representing commitment reliability. ... 57
Figure 35 - Data tabulation for Random Activity Sampling of a process ... 57
Figure 36 - Template Flow Process Chart ... 57
Figure 37 - Example template for a Multiple Activity Chart. ... 58
Figure 38 - Waste reporting structure for quantification of Key Performance Indicators. ... 59
Figure 39 - Layout of airport with the turning node pictured on the far left end of the runway and the apron located in front of the terminal (Wagners Constructions). ... 62
Figure 40 - Commitment reliability calculation of the paving of the turning node. ... 67
Figure 41 - Example of RAS sampling taken over one day of paving. ... 68
Figure 42 - Utilisation rates of the elements in the concreting process. ... 68
Figure 43 - FPC for the concrete paving process running for a duration of three truck deliveries. ... 70
Figure 44 - Multiple Activity Chart (MAC) for concrete paving utilising a 6 truck turnaround. ... 71
Figure 45 - FPC over a duration of two hand pours; each with two trucks arriving and placing at the same time. ... 79
Figure 46 - MAC of processes over the duration of multiple concrete pours. ... 80
Figure 47 - The run in the middle is currently supporting the formwork for the runs either side. Once each side is completed and the formwork is removed the middle run will be paved as an infill run. . 83
Figure 48 - Calculation of commitment reliability showing the work planned each day and the actual progress at the end of each day. ... 86
Figure 49 - FPC for the installation of three forms. ... 88
Figure 50 - MAC showing the various elements of the formwork installation process. ... 89
List of tables
Number
Title
Page
Table 1 - Tabulated process analysis with non-value adding and unnecessary processes outlined in
red. (Lee et al. 1999, p. 69) ... 17
Table 2 – Comparison of process before and after implementation of improvements with change in number of transportation steps outlined in red. (Lee et al. 1999, p. 69) ... 18
Table 3 - Classifications of example wastes into materials, time and information. ... 38
Table 4 - Inventory of materials kept on site used in concrete production. ... 74
Table 5 - Waste Reporting Summary for the concreting process. ... 75
Table 6 - Inventory of materials kept on site used in concrete production. ... 81
Table 7 - Summary of waste KPI's for hand pours. ... 82
Table 8 - Summary of waste KPI's for the installation of formwork. ... 92
Table 9 - Quantification of the significance of different sources of waste. ... 109
List of appendices
Number
Title
Page
A Project Specification ... 120
B Monthly Site Waste Report Template ... 121
C RAS field sampling sheets ... 127
List of Abbreviations
BIM Building Information Model CPA Construction Process Analysis
CSMS Construction Site Management System EWL European Waste List
FPC Flow Process Chart
ISPS Integrated Site Planning System JIS Japanese Industrial Standards JIT Just in Time
KPI Key Performance Indicator LCI Lean Construction Institute LPS Last Planner System MAC Multiple Activity Chart NVA Non-value Adding
NVAN Non-value Adding but Necessary
PESTLE Political, Economic, Social, Technological, Legal, Environment RAS Random Activity Sampling
RFI Request for Information TFV Transformation Flow Value TPS Toyota Production System VA Value Adding
Chapter 1
Introduction
“There has never been a systematic attempt to observe all wastes in a construction process.” (Koskela 1997, p. 6)
1.1 Outline
The above statement suggests the need for a study into the quantification of all the wastes present in a particular construction process. This report endeavours to both classify and measure the wastes present in particular concreting processes.
1.2 Introduction
The temporary nature of construction projects is but one reason for the vast inefficiencies within the Australian construction Industry. The resulting product of these inefficiencies is waste whether it be wasted time, materials or monetary losses. This report will begin with a background of the presence and effects of waste in construction. This is followed by a literature review focusing on appropriate topics such as waste and lean construction methods for waste reduction. A study of classification and measurement of these examined types of waste present in construction will be used to determine the methods best used to map the sources. A suitable format for waste reporting will be established and trialled in a construction environment.
1.4 Aim
1.3 The Problem
The construction industry is one of the largest producers of waste in Australia. This is an industry characterised by low efficiencies and lagging environmental credentials. It has been proven that this can be improved by the implementation of Lean Construction principles. (Koskela 1997, p. 6) Given that concreting operations account for a large proportion of the cost of construction it is useful to examine these issues in relation to concrete construction.
1.4 Research Objectives
The following research objectives will be used as a guide for conducting research and experimentation. Additionally they will be used to monitor progress and measure the overall success of the research project:
1 Investigate current methodologies for construction of concrete structures and the types of waste present. This will focus on the construction phase of traditional design, tender and construct projects.
2 Identify lean construction techniques for reducing waste
3 Establish techniques for measuring waste and a framework to implement these. 4 Select specific processes to study (foundations, culvert, bridge pier etc) and
measure waste.
5 Synthesise a suitable format for waste reporting based on the literature review 6 Seek feedback from construction industry professionals on Key Performance
Indicators for waste
7 Use waste classifications and corresponding remedial actions for report recommendations
8 Conduct a case study for concreting including; classification of wastes, process mapping and application of reporting formats.
1.5 Methodology
This report will begin with a review of current literature relevant to lean production in the construction industry. This will be broken up into a number of interconnected sections consisting of; lean construction, types and classification of waste and different concrete construction methodologies. The objectives will be used to create a template for reporting waste in traditional design, tender and construct projects. To achieve this the report has been broken up into the following chapters:
Literature review
Waste reporting structure
Case studies
Industry Feedback
Conclusions and Recommendations
1.6 Conclusions
Chapter 2
Literature
2.1 Background
The construction industry has been slow to implement environmentally friendly practices with many Australian companies yet to implement waste minimisation strategies (Faniran & Caban 1998). Landfill is generally the most cost-effective and convenient solution to construction waste with 20-30% of all landfill originating from construction projects. (Teo & Loosemore 2001) Australia generates 32.4 million tons of waste annually. 42% of this is generated from the construction and demolition sectors where concrete constitutes 81.8% of this. Unfortunately only 57% of this is recycled. (Tam 2009)
From my previous comments I have chosen to focus on concrete construction. I have chosen concrete as this is the largest contributor of waste in the building and construction industry. A study into waste generated in the Dutch residential building industry by Bossink found that 80% of waste from the residential building industry consisted of materials such as concrete, bricks, piles and roof tiles. (Bossink & Brouwers 1996)This is partly due to the prevalence of concrete structures as well as the issues related to batching and timing of pours.
Construction of concrete structures can be broken down to the major processes of; design, planning, formwork, reinforcement assembly, pouring, removing formwork and any resulting defects or required re-work. This research will primarily focus on the processes of formwork, reinforcement and pouring.
There are many different contracts and types of organisations utilised in construction. Contracts can be tendered as design and build but this is regularly divided between a design firm and a construction company. Within the construction process there is often a complex relationship between the main contractor, sub-contractors and suppliers. A large amount of waste is generated both within and at the interface between each of these organisations. For the purpose of this research the scope will be restricted to waste generated by the main contractor.
it can be categorised into a particular group to determine the method of measurement. Measurement of some wastes can be easy, however, others are both difficult. This research will attempt to determine methods to measure all types of waste according to different classifications.
2.2 Lean construction
According to the Lean Construction Institute Australia, lean construction is; “a production management-based approach to project delivery”(LCI 2014).This concept of “lean” is focused on: elimination of waste; maximisation of customer value and increasing workflow. (LCI 2014) The concept of lean production originated from the Toyota Production System (TPS), developed by the vice president of the Toyota Motor Company (Sugimori et al. 1977). The system was developed to reduce costs through the elimination of waste using just in time production (JIT). JIT requires that everything is produced as needed in only the necessary quantities and only when needed (Sugimori et al. 1977).
Koskela states; “Manufacturing has been a reference point and a source of innovations in construction for many decades.” (Koskela 1997, p. 1) The article also states that lean production is the major manufacturing practice used in western countries. By combining this information it is obvious that it is only natural that lean production be applied in the construction sector.
Lean production has been very useful in mass production. This is because manufacturing cheaply produces large volumes of standard materials using a low skilled workforce and specialised machinery. However, construction is considered a craft industry. This is where products are built one at a time using a highly skilled workforce and an assortment of flexible tools at a high cost. The development of lean construction endeavours to integrate the benefits of both these industries. (Choo 2003)
2.3 Types of waste
This section will demonstrate the types of waste identified by a number of literary articles. From these lists a comprehensive list can be made for use in classification. Formoso identifies waste as any inefficiency where larger than necessary amounts of; capital, resources, equipment or labour are expended in construction (Formoso, Isatto & Hirota 1999). The following lists outline the types of waste identified by a selection of literary sources:
Abeysekera (2009) provides the following extensive list of waste:
Processing waste
Waiting/idle time
Transporting
Making-do
Inventory
Unnecessary motion
Requests for information (RFI’s)
Design errors
Lack of communication
Constructability concerns (Abeysekera 2009a)
A survey by (Faniran & Caban 1998) indicates the five largest sources of waste:
Material
Design changes
Design and detailing errors
Poor weather
Packaging and non-reclaimable consumables
However, this research focuses on the construction portion of the traditional design-tender-construct project. For this reason types of waste such as design changes and detailing errors have little relevance to this analysis.
(Hines & Rich 1997, p. 47)) lists the seven commonly accepted wastes derived from the Toyota Production system:
3. Transport
4. Inappropriate transport 5. Unnecessary inventory 6. Unnecessary motion 7. Defects
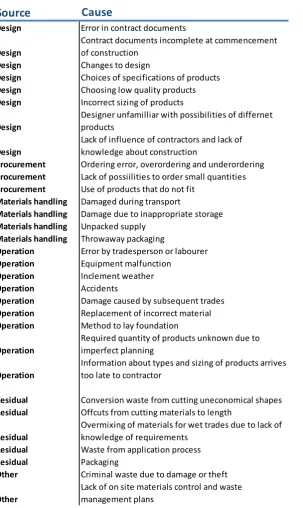
Bossink 1996 provides a list of causes of waste and in which stage in the construction project they originated. These ‘causes’ could be loosely defined as descriptive definitions of types of waste.
Source
Cause
Design Error in contract documents
Design
Contract documents incomplete at commencement of construction
Design Changes to design
Design Choices of specifications of products
Design Choosing low quality products
Design Incorrect sizing of products
Design
Designer unfamilliar with possibilities of differnet products
Design
Lack of influence of contractors and lack of knowledge about construction
Procurement Ordering error, overordering and underordering
Procurement Lack of possiilities to order small quantities
Procurement Use of products that do not fit
Materials handling Damaged during transport
Materials handling Damage due to inappropriate storage
Materials handling Unpacked supply
Materials handling Throwaway packaging
Operation Error by tradesperson or labourer
Operation Equipment malfunction
Operation Inclement weather
Operation Accidents
Operation Damage caused by subsequent trades
Operation Replacement of incorrect material
Operation Method to lay foundation
Operation
Required quantity of products unknown due to imperfect planning
Operation
Information about types and sizing of products arrives too late to contractor
Residual Conversion waste from cutting uneconomical shapes
Residual Offcuts from cutting materials to length
Residual
Overmixing of materials for wet trades due to lack of knowledge of requirements
Residual Waste from application process
Residual Packaging
Other Criminal waste due to damage or theft
Other
[image:21.595.120.424.237.746.2]Figure 2 - Comprehensive list of wastes developed through research.
Types of waste
Error in contract documentsPoor weather
Detailing errorsPoor weather
Contract documents incomplete at commencement of constructionPoor weather
Design changesPoor weather
Choices of specifications of productsPoor weather
Choosing low quality productsPoor weather
Incorrect sizing of productsPoor weather
Designer unfamilliar with possibilities of differnet productsPoor weather
Lack of influence of contractors and lack of knowledge about constructionPoor weather
Ordering error, overordering and underorderingPoor weather
Lack of possiilities to order small quantitiesPoor weather
Transport timePoor weather
Waiting/idle timePoor weather
Damaged during transportPoor weather
Inappropriate transportPoor weather
Unnecessary motionPoor weather
Unnecessary inventoryPoor weather
Damage due to inappropriate storagePoor weather
Lack of communicationPoor weather
Request for information (RFI's)Poor weather
Constructability concernsPoor weather
Error by tradesperson or labourerPoor weather
Damage caused by subsequent tradesPoor weather
Equipment malfunctionPoor weather
Making doPoor weather
Poor weatherPoor weather
AccidentsPoor weather
Replacement of incorrect materialPoor weather
Method to lay foundationPoor weather
Required quantity of products unknown due to imperfect planningPoor weather
Information about types and sizing of products arrives too late to Poor weather
OverproductionPoor weather
Defects and Re-workPoor weather
Processing waste (conversion from cutting uneconomical shapes)Poor weather
Offcuts from cutting materials to lengthPoor weather
OverproductionPoor weather
Waste from application processPoor weather
PackagingPoor weather
Criminal waste due to damage or theftPoor weather
2.4 Identification of waste – Transformation flow value
Before waste can be measured it needs to be identified and traced back to its source in the construction process or supply chain. The Transformation Flow Value (TFV) approach represents construction as transformations, value generation and flow of materials or resources. Each of these representations allow us to analyse construction activities different ways.
Koskela states that there are two aspects in production; conversions and flows. Both of these activities require time and materials, however, only conversions create value by converting one material into another. Conversion activities are linked together by flow activities which include processes such as; transporting, waiting or inspecting. The aim of this classification is to identify flow activities which can be eliminated and increase efficiency of conversion activities. (Koskela 1997)
Transformation simplifies construction into the conversion of inputs to outputs. The inputs can be materials, labour or capital and the outputs represent the final product. The transformation or conversion is representative of the particular construction activity needed to create the desired output. The transformation activities are seen as value-adding and anything that is non-transformation is non-value adding or waste. Planning in construction is the identification of what processes are needed to convert the required inputs into outputs and generate value. (Abeysekera 2009a, p. 204)
Construction can also be represented by the flow of materials and other resources - and the efficiency of any project is directly linked to the continuation of this flow or continuity of work. Below is the flow model applied to the generic transformation of materials. This shows the actual value of processing surrounded by necessary ‘waste’ procedures. This also shows that this can be broken down into cycles simplifying the identification process. (Abeysekera 2009a, p. 214)
Figure 3 - Transformation model (Abeysekera 2009, p. 204.)
Input
Conversion/
This method can be applied to discrete construction processes. These are processes which can be narrowed down to a relatively small repetitive cycle mostly unaffected by other outside processes. One such example is the generic concreting process which is shown in the following diagram:
Figure 5 - Flow process of concrete batching and on-site production (Dunlop & Smith 2004, p. 57).
Lastly construction processes can also be represented by the value provided to customers. Value is created when the products and services created by the suppliers meet the expected requirements of the customer. This relationship can also be applied to a consultant and client relationship or any other customer-supplier relationship as shown in the following figure.
Figure 6 - Relationship and expectations of the supplier and customer (Abeysekera 2009a, p. 217).
One of the biggest challenges in a supplier-customer relationship is understanding what is of value to the client. In other words what are their requirements and expectations of the products and services the supplier is going to provide? The supplier is often made up of a
and equipment suppliers. In construction it can often be quite difficult to coordinate all these parties to achieve these expectations and requirements. (Abeysekera 2009a, pp. 217-9)
Bertelsen and Koskela discuss methods to operationalise the TFV model of construction for Managing the Three Aspects of Production in Construction. The successful integration of the three concepts of transformation, flow and value is the foundation of implementing the TFV model. These three concepts can be used in different situations to improve our production system. (Bertelsen & Koskela 2002, pp. 1-6)
Bertelson and Koskela portray the three TFV tools in a managerial environment demonstrating the way in which management is responsible for handling the production system. The overall production flow is broken up into three management functions of contracts management, process management and value management. The role of contracts management is setting up the production system which is different for each construction project. Process management aims to maintain high efficiencies and predictable flow of work by maintaining cooperation between all parties involved in the construction process. Value management ensures the outputs from the process meet the client’s needs. This involves ensuring the timeliness; quality and cost are all satisfactory for the client. Basically these three roles work together to determine the inputs required, oversee the transformation and validate the outputs. (Bertelsen & Koskela 2002, pp. 6-7)
Figure 7 - Flow diagram of Transformation Flow Value applied to management
Bertelson and Koskela promote the implementation of these three roles of management separately for two reasons. Firstly, of the three aspects discussed only contract management is currently implemented. This means that it would be easier to simply add process and value management as two separate positions leaving the current contract management role intact. Secondly, considering the differences in the roles it would seem more convenient to recruit people with different skillsets specific for the requirements of each role. (Bertelsen & Koskela 2002, p. 8)
Inputs
ContractManagment Transformation
Process
management Outputs
2.6 Measurement of waste – Value Stream Mapping (VSM)
Another useful example of waste identification is value stream mapping. This approach categorises all processes into three groups: value adding (VA), necessary but non-value adding (NVAN) and non-value adding. (Hines & Rich 1997) Value stream mapping categorises the critical path into these groups and identifies the non-value adding processes. Once these are eliminated the new critical path is then mapped and wastes identified continuing the iterative process. By continually iterating the critical path value stream mapping can not only be applied linearly but also to complex systems.(Braglia, Carmignani & Zammori 2006)
VSM can be used to map production processes or entire construction projects. (Hines & Rich 1997, p. 50) Hines and Rich describe the uses and origins of the following seven value stream mapping tools:
1. Process activity mapping 2. Supply chain response matrix 3. Production variety funnel 4. Quality filter mapping
5. Demand amplification mapping 6. Decision point analysis
7. Physical structure mapping
2.6.1 Process activity mapping for Construction Process Analysis (CPA)
Process activity mapping originates from industrial engineering and is conducted by studying the flow of the processes and subsequently identifying waste. Improvement by rearranging the process layout and elimination of unnecessary tasks – very similar to Construction Process Analysis. (Hines & Rich 1997, p. 50)
Figure 8 - Symbols JIS Z 8206 (Lee et al. 1999, p. 65)
Figure 9 - Flow process chart of steel erection process (Lee et al. 1999, p. 66)
The flow process chart is a list of all processes undertaken to complete the steel erection process. This defines the processes according the symbols from JIS Z 8206 such as operation, transportation, inspection etc. and whether they are value-adding, non-value adding but necessary or non-value adding and unnecessary. This chart can be used to measure waste by a simple calculation:
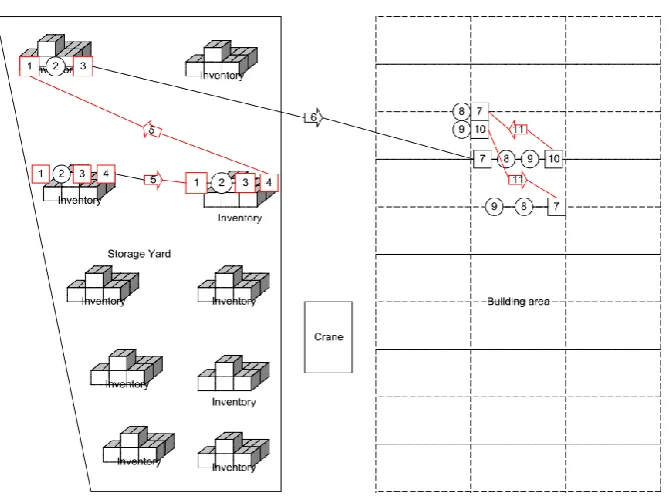
Figure 10 - Plan view flow diagram of steel erection process (Lee et al. 1999, p. 67)
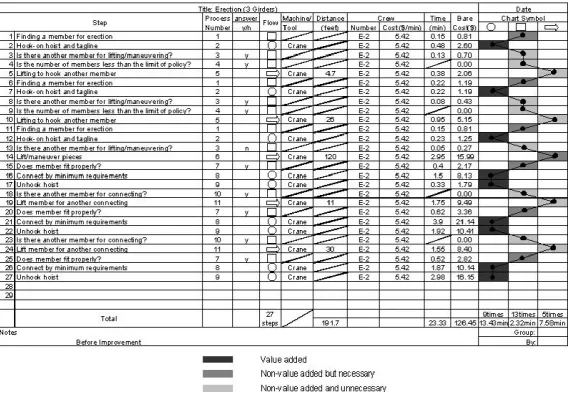
[image:31.595.115.450.56.305.2]These charts can then be summarised into the following table. The time and cost spent on operation, transportation and inspection is divided into categories of value-adding, non-value adding but necessary or non-value adding and unnecessary. Now that these non-value adding and unnecessary processes have been identified the aim is to reduce the number and overall share of these activities.
Table 1 - Tabulated process analysis with non-value adding and unnecessary processes outlined in red. (Lee et al.
1999, p. 69)
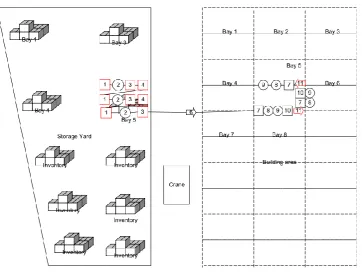
inventory incorporating all the materials needed for a particular construction bay. This eliminated a number of transportation processes therefore resulting in less unnecessary activities.
Figure 11 - Plan view of construction with implemented improvements
Table 2 – Comparison of process before and after implementation of improvements with change in number of
transportation steps outlined in red. (Lee et al. 1999, p. 69)
[image:32.595.117.480.156.429.2]2.6.2 Supply Chain response matrix
Supply chain response determines the lead-time constraints on the supply chain for a particular process. This produces a diagram of lead times for products at specific points in the supply chain allowing the identification of individual problematic lead times on the critical path. Identification of these lead times allows better planning of procurement and reducing waste time waiting for materials. This can also reduce ‘making do’ waste by having the right products there at the right time. (Hines & Rich 1997, pp. 51,2)
2.6.3 Product variety funnel
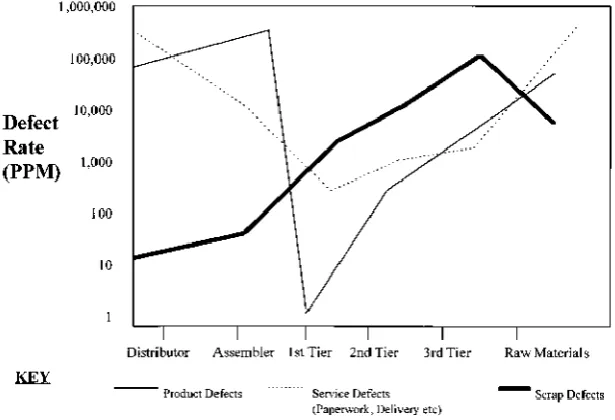
[image:33.595.173.489.518.737.2]2.6.4 Quality filter mapping
[image:34.595.171.479.201.411.2]Quality filter mapping plots the rates for particular types of defects along the supply chain. This tool allows the identification of quality problems and where they occurred along the supply chain. Defects are a large source of waste at the end of any project and the prevention of these earlier in the project can save a lot of time and money (waste) in the end. Three types of defects have been plotted in the following figure. (Hines & Rich 1997, pp. 54,5)
Figure 13 - Quality filter mapping applied to automotive supply chain (Hines & Rich 1997, p. 55).
2.6.5 Demand amplification mapping
Demand amplification is mapping the supplies and demands of particular products. Supply is a relatively constant flow while demand can fluctuate wildly. This means that while supply may meet demand on average there will still be a number of occurrences where demand will be much greater. This tool can be used to determine the impact of consumers on suppliers at different levels further up the supply chain.
2.6.6 Decision point analysis
suppliers to better plan inventories and for contractors to form better relationships with suppliers.
2.6.7 Physical structure mapping
This method allows us to see an overview of supply chains from at an industry level. To do this we need to map the relationships between the interconnected suppliers, producers and consumers at an industry level. This method can be used to map either the costs incurred or volumes produced at each point within the supply chain. Figure 14 - Physical structure map of an automotive industry example (Hines & Rich 1997, p. 58) demonstrates these two maps with the number of firms involved in each production tier on the left and the map of costs involved on the right. The cost adding map areas are determined by the value adding processes. This is yet another way to represent the value adding process. In a manufacturing environment the assembler is situated in the middle of the diagram being fed by various tiers of suppliers. In a construction model the site production will be set in the middle of the map. This Is potentially a very useful tool for analysing waste within the supply chain as we are able to see a physical representation of where excessive costs are being incurred. These costs at this point can then further be investigated to reveal the wastes causing this.
Figure 14 - Physical structure map of an automotive industry example (Hines & Rich 1997, p. 58)
throughout the production process. The most difficult task is to decide which tools are applicable to measure which types of waste.
Figure 15 - Decision support tool used based of correlations between tools and wastes. (Hines & Rich 1997, p. 50)
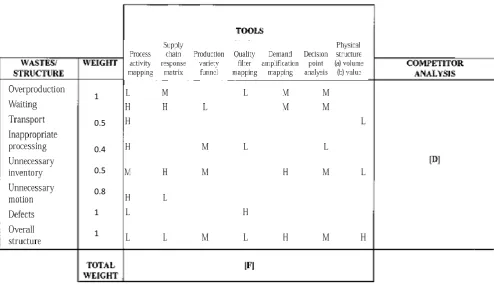
The article provides a framework for the implementation of a value stream analysis tool (VALSAT). This framework uses the following procedure:
1. Identify value stream
2. Identify wastes present in particular value stream
3. List wastes in A and tools in B with correlation matrix in C 4. Identify a benchmark company for each waste
5. Weightings applied to wastes and overall structure 6. Add up total weightings for each tool
1
0.5
0.4
0.5
0.8
1
1
Figure 16 - Layout for application of VALSAT to determine effectiveness of waste identification tools. (Hines &
Rich 1997, p. 60)
2.6.8 Commitment Reliability as a measure of waste
Commitment reliability is the level of dependability that a contractor executes the works specified in the contract according to construction program. Commitment reliability can also be understood as the commitment of the contractor to undertake these works in a way that meets all the requirements of quality assurance according to the project specifications. (Sharma 2013, p. 1)
[image:37.595.79.574.119.404.2]Figure 17 - Expected vs actual progress of tasks within a project plan.(Sharma 2013, p. 25)
The above figure illustrates the actual progress (green) as a percentage of the planned progress (grey) during a progress report. The commitment reliability can be measured as a percentage by Actual progress/Planned progress:
Figure 18 - Commitment Reliability calculation for tasks represented in the above schedule. (Sharma 2013, p. 25)
Commitment reliability is a useful measurement in any project and could potentially be used as a Key Performance Indicator (KPI) when reporting on waste. This possibility will be explored further in the report structure section of this report.
2.6.9 Activity Sampling as an estimate of waste
The most convenient measure of waste is to estimate the efficiencies of individual work processes on site. This simple method to detect productivity problems is known as Activity Sampling. This method involves recording the total number of workers or machines working in a particular area. Then the number of the workforce working is recorded at timed intervals over a period of time such as a day. (Abeysekera 2009a, p. 2)
Figure 19 - Activity sample example demonstrating collected data and calculations.
In this example we can see that 36% are not working on average. This means there is room for improvement and that this activity should be further analysed to determine causes and potential solutions. (Abeysekera 2009, p. 2)
To better understand the accuracy of this data we need to determine the % confidence of this data and potentially the amount of samples we need to achieve our desired level of confidence. This data can also be represented graphically in the form of a distribution. If enough data is collected the graph should resemble a normal distribution as shown in the following figure. The following process is used to calculate the confidence level of a particular set of data collected:
Sample size = 10 Average result = 7.7 Range = 0-12
Proportion (p) = 7.7/12 = 64%
Time Interval No. working Total workers 12
6:00 AM 8
7:00 AM 6 Average/total
8:00 AM 8 7.7 / 12 = 0.641667
9:00 AM 9
10:00 AM 5 Percentage Efficiency
11:00 AM 3 64.17%
12:00 PM 11
1:00 PM 12
2:00 PM 8
3:00 PM 7
The following method is used to calculate the number of samples required to achieve the required level of confidence:
The standard error (SE) can be calculated from the following equation:
( ) √ √
Using a confidence level of 95% the critical value (z*) = 1.960 0.5 ± 1.960 x 0.048
0.5 ± 0.09408
The 95% confidence limit is from 0.40592 to 0.59408. Therefore, we are 95% confident that between 40% and 60% of the labour was utilised over the time period.
Similarly this equation can be rearranged to determine the number of samples required to satisfy a pre-determined confidence level:
Therefore by taking 196 samples the proportion of unproductive work can be determined within 5% accuracy. Similarly completing the same calculation for 90% confidence only 49 sample would need to be taken.
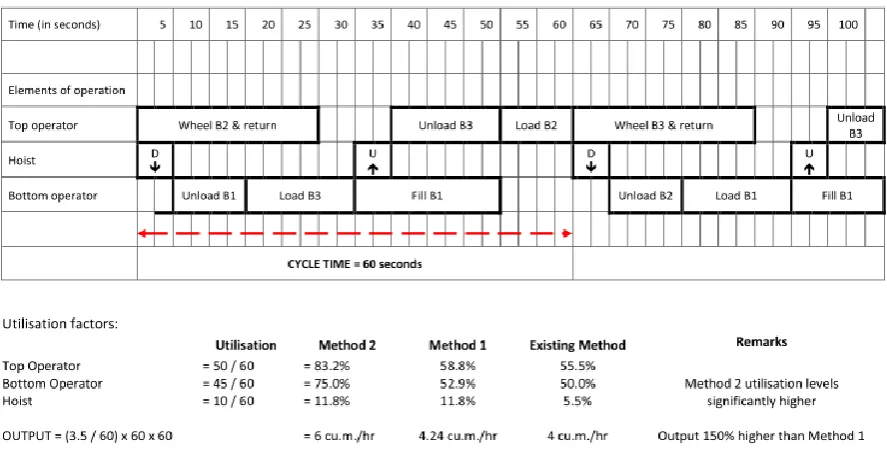
2.6.10 Multiple Activity Chart (MAC)
Once an Activity Sampling study has been conducted the data can be further analysed with a Multiple activity chart to provide an optimum solution. The chart shows the interconnected movements of people and plant against a common timeframe. This allows us to better understand the process and potentially rearrange it in such a way as to increase the output or decrease the cycle time without any additional inputs. (Abeysekera 2009b, p. 262)
To build this chart an array of data must first be collected. The construction process must be broken up into repetitive cycles which can be analysed as discrete process. Within these processes the activities are then listed in order and depending on any overlaps or interdependencies. Once this cycle is defined the times required for each activity are used to plot them on the common time scale. An example of this process applied to a concreting operation is demonstrated in the following figure.
Figure 21 - Multiple activity chart of a concreting operation transporting concrete using 3 wheelbarrows and a
hoist. (Abeysekera 2009b, p. 263)
Figure 22 - Optimised version of the original Multiple Activity chart where all three wheelbarrows are used and
empty barrows are sent down straight after filled barrow is unloaded. (Abeysekera 2009b, p. 265)
2.7 Classification of Construction Waste
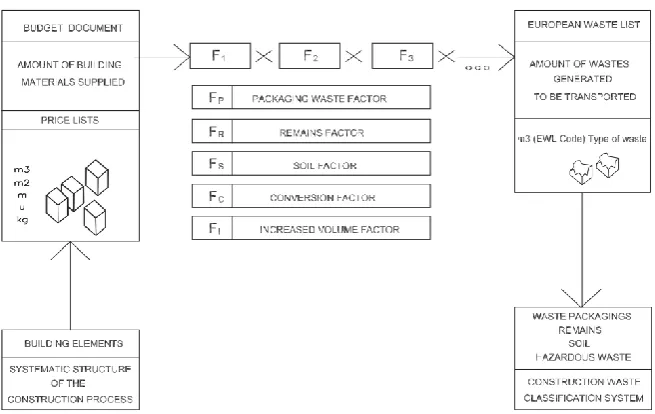
2.7.1 European Waste List (EWL)The European Waste List (EWL) has proposed a waste classification based around a structure of three construction processes. These broadly classify construction and demolition waste into; packaging, remains and soil. Packaging of the materials and products supplied to the works includes materials such as cardboard, plastic and metal containers and wooden pallets. Remains includes any left-over building materials such as concrete, ceramics or wood. Soil includes any material left over from excavations and not used as fill. (Llatas 2011, p. 1266) The early stages of work include clearing and setting up the site and excavations. This involves enclosing the worksite and providing basic infrastructure, access and facilities. Most of the waste generated from this stage consists of unsuitable soil from clearing and initial excavations. (Llatas 2011, p. 1266)
The second stage is the reception and storage of materials. Much of the waste from procuring materials consists of; packaging, incorrect purchases, substandard quality, damage during transport and the transport time itself. Lack of space and poor storage conditions are often reasons for damage occurring on site. (Llatas 2011, p. 1266)
The third and largest stage is the execution of construction activities. This stage can produce a large variety of wastes depending on the activities being undertaken. Common wastes are:
Soil from excavation
Excess components and building materials
Remains of temporary elements
Breakages and losses
Defects
(Llatas 2011, p. 1266)
Figure 15 - Tools used to implement the model. (Llatas 2011, p. 1266)p1266
The model consists of three steps:
1. Identification of elements of the construction process 2. Categorise waste according to EWL list
3. Application of analytical equations to estimate waste (Llatas 2011, p. 1265)
The identification of elements involves systematically defining the structure of the project to determine all the components and materials that are needed to produce each element. The analytical expressions combine the waste type, amount and a number of factors to estimate the waste into three equations depending on the three categorisations of waste. The general expression for packaging is given in Equation 1. (Llatas 2011, p. 1267)
Equation 1 - Analytical estimation of waste. (Llatas 2011, p. 1267)
CWPi - expected construction waste amount for waste EWL.
P - represents packaging waste
k - type of packaging waste
Qi amount of the building element I inputted into the system
Fp - packaging waste factor
Fc – conversion factor
The packaging waste factor transforms the amount of building material into the amount of waste based on how the material is packaged. This information can be obtained from the supplier and consists of a volume or weight ratio of the material to packaging. Fc is the conversion factor for the units of measurement for materials and their waste. Fi accounts for the increase in volume for some types of waste known as the ‘sponge effect’. This can be due to the increase in volume of some materials due to how it is stored or collected, however, this is not needed if the mass of materials is used. The following diagram shows the input material types typically required by construction projects on the left. On the right is a selection of the common types of materials wastes generated from these input materials. These materials will either end up in landfill of incinerated or taken to a secondary market for re-use and recycling.
Figure 23 - Representation of material inputs and waste outputs for a construction site. (Llatas 2011, p. 1274)
There are a number of limitations of this classification. This method only considers types of material waste neglecting other types such as time. However, it would be difficult to implement this method for waste time. This classification relies on the European Waste List database and this would need to be adjusted for the Australian construction industry. (Llatas 2011, p. 1275)
current view of waste management but if a comprehensive view of waste is adopted a more comprehensive view of classification will need to be adopted.
2.7.2 Lean Construction
One of the original lean construction methodologies is the concept of JIT delivery. This means the materials needed are brought to site and installed immediately; negating the need for storage or double-handling. This is an example of a ‘pull’ method where materials are ordered and manufactured as needed. The opposite of this is the more commonly used ‘push’ system which involves ordering anticipated materials based on forecasting. The problem with this method is often exact amounts are not known in advance and more is ordered than needed to compensate for uncertainties. The pull system eliminated this overproduction by only replenishing material. However, for the pull system to work efficiently leads times need to be reduced and an effective mechanism to notify the upstream producer needs to be implemented. Concrete supplied from batch plants is an example of a pull system. As ready-mix concrete cannot be stockpiled on site it must be delivered to site as needed and is placed immediately. This is a process which requires a high level of cooperation and interdependence between the supplier and contractor. (Tommelein & Li 1999)
Often attempts at JIT delivery by reducing inventories have just pushed these inventories back to suppliers which need to hold an even greater inventory to supply construction needs – increasing ‘total’ supply chain costs. According to Russell (2009) this is a very narrow-minded approach which does not consider the entire supply chain as a system. (Russell 2009, p713) Abeysekera suggests the following steps should be considered when increasing flow in activities:
Improving constructability by simplifying the number of steps
Reduction of variability in number of parts in sizes
Flexibility to substitute materials and source subcontractors at short notice
Process transparency and planning (Abeysekera et al, 2009)
Koskela presents the following principles for improvement of flow:
Reduction in variability
Compression of cycle times
The article then continues on suggest flexibility, transparency and the need for constant improvement not unlike that of (Abeysekera et al, 2009)(Koskela 1997).
Abeysekera provides an overview of the traditionally implemented improvements for increasing productivities:
Technology such as pre-stressed and pre-cast concrete
Plant and equipment (excavators, cranes)
Automation and factory production
Innovation of products and processes
Scale economies (mass production and learning curve effects)
Modularisation and type-plans for residential housing developments
Specialisation using subcontractors and outsourcing.
(Abeysekera et al, 2009; Hennayake and Ponnampalam,1982)
All these methods for increasing flow and efficiency has been proven to work in today’s construction industry. However,
2.7.3 4D construction site management
Planning concrete pours such as the one pictured above requires rigorous planning of positioning of equipment in conjunction with how much equipment needed to achieve your desired productivity. The pump movements must be timed with productivities and what area of the slab can be reached from each position. The productivities of the concreting crews must be equivalent to the planned rate of concrete delivery and how many concrete trucks are available to service the pour. If this is not the case waste will be generated. If the productivity of the crew is greater than the supply they will be waiting and inactive therefore increasing the total time required for the same amount of production. On the other hand if delivery times are too close and trucks will be waiting also increasing the likelihood of sending trucks away. Lin describes the benefits of using an interactive computerised planning process to better illustrate and evaluate these complex activities. This method allows the planned to visualise the process before it is implemented and to test alternative plans before commencement. This technology is not only very useful for the planners but can potentially save large amounts of time and resources on-site. Lin states, “Planning is typically the responsibility of a small pool of experts whose knowledge is largely undocumented.” (Lin & Haas 1996) An added benefit of this system is a detailed record of the planning process can then be kept for future record. This can help planners to both better understand any problems that occur and provide learnings for further similar operations.
One area currently being researched is 4D visualisation of construction site management. There are a number of systems being developed for this purpose such as Integrated Site Planning System (4D-ISPS) and Construction Site Management System (CSMS). 4D modelling involves the combination of the planning schedule into a 3D model of the worksite. Adding time allows the planner to visually analyse the workflow of the project using a graphical simulation to better locate and understand potential problems therefore avoiding waste This can be created by programs such as AutoCAD which is generally already completed in the design stage of the project. This allows the construction and movement of 3D elements to be directly linked to the time schedule of the project. (Ma, Shen & Zhang 2005; Zhang, Ma & Pu 2001)
dimensions such as sustainability and energy-savings. (Popov et al. 2010, pp. 359,60) (Kamardeen 2010, p. 285)
This BIM model allows planners to more easily optimise and predict the performance of construction projects before starting. This concept is very applicable for construction of buildings and other complicated structures where accurate 3D drafting and modelling would have already taken place. This would be somewhat more difficult for some civil projects where 2D plans are used as some volumes and materials cannot be calculated from the model. (Kamardeen 2010, p. 285) Another issue in some circumstances is that these plans would need to more accurately portray the actual activities taking place. For many of these projects a 2D staging approach may still be more efficient.
Theoretically an infinite number of dimensions can be added to this model and some literature describes models with up to 8 dimensions. These dimensions can be aspects such as; facilities management, sustainability, safety and potentially waste. (Kamardeen 2010, p. 285)
This model can be used to better plan and track waste generation leading to more accurate problem diagnosis when reducing waste. This would also help in creating more realistic plans to increase commitment reliability, a concept which will be introduced in the next section. The possibility of incorporating waste into this model is outside the current scope for this research but is potential direction for further research.
2.7.5 Last Planner System for concreting operations (LPS)
Due to the ever increasing size and complexity of construction projects the need to plan effectively is continually growing in importance. Due to this resulting increase in complexity of planning a hierarchical system has been developed to delegate various levels of planning to
the overall inputs and outputs. This provides an outline for the subsequent layers of planning from project staging right down to weekly plans of site activities. (Ballard 2000, pp. 3-1)
The aim of the LPS is increasing reliability of planning and the stabilisation of production-level workflow. The LPS uses concepts of “front-end planning”,” lookahead planning” and “commitment planning” are utilised for various levels of planning required by different levels of the hierarchy. From this master schedule, lookahead and a weekly work schedule are created. According to Choo the purpose of a master schedule is to show what can feasibly be completed in the allotted time and what lead times are required. A lookahead provides an overview of all the activities in the best sequence with all the required resources. The weekly schedule is work that is currently available and what work needs to be done to satisfy the lookahead plan. (Choo 2003, pp. 37-41)
[image:50.595.166.493.305.529.2]
Figure 26- Last Planner System flowchart. (Choo 2003, p. 40)
The LPS implements production control into the traditional systems of project management. The last planning process looks at what should be done and rationalises this into what can be done. This then creates an inventory of work from which what will be done can be planned. (Ballard 2000, pp. 3-14)
must also be selected. The final criteria for planning assignments is that the work selected can be done, meaning the appropriate resources are available and prerequisite work has been completed. Work flow control ensures that this work flows through these production units in the appropriate sequence and rate. (Ballard 2000, pp. 3-2 - 3-5)
Figure 27 - The Last Planer System in terms of should, can, will and do. (Ballard 2000, pp. 3-15)
2.7.6 Classification of waste by source
Two methods of source-based classification will be defined:
Types of waste (time, materials, information)
Materials, plant, people
[image:52.595.113.357.241.611.2]The first source-based method involves grouping types of waste into the three categories of time, material and information. This results in the following example lists:
Table 3 - Classifications of example wastes into materials, time and information.
Type of waste
Materials
Processing waste
Overproduction (offcuts, excess etc.)
Lack of materials control and waste
management plan
Unnecessary inventory
Time
Accidents
Weather
Defects
Waiting/idle time
Ineffective work
Transporting
Unnecessary motion
Information
Making-do
Lack of communication
Request for information (RFI's)
Design errors/changes
Constructability concerns
2.7.7 Classification of waste by processes
Classification by process is determining the total waste attributed to each of the defined activities in either the construction project or a defined process within the project.
The first method is process based where waste can be classified according to the different processes involved in completing the task. For the example of concreting these processes include; planning, formwork, reinforcement assembly, pouring, removing formwork and any resulting defects or required re-work. Wastes can then be classified according to the process in which they occur. For example waste time may occur across all processes whereas waste material such as reinforcement will only occur in reinforcement assembly.
The second is taken from Serpell’s “Characterisation of waste in building construction projects” and categorises waste into different stages of the construction process. These categories are broadly classified as:
Design
Procurement,
Materials handling
Operational
Residual and
Other
2.7.8 Management classification of waste
This approach classifies waste according to the management structure responsible for that process. The three management structures are production management, project management and business management. These classifications represent the major facets of any construction company. This approach is very useful as it directly implies the responsibility and that responsible for the occurrence of each type of waste detected.
Management Classification
Production management
Project management
Business management
Processing waste Requests for information (RFI’s)
Inventory
Waiting/idle time Design errors Unnecessary motion Transporting Constructability
concerns
Making-do Error in contract documents Lack of
communication
2.7.9 PESTLE classification of waste
The PESTLE framework is an acronym for political, economic, social, technological, legal and environment. This classification system originates as a strategic management plan for companies when analysing the impacts of decisions and policies. Typical wastes can be attributed to the different areas as follows:
Figure 29 - PESTLE framework for classification of wastes according to their specific impacts. (Abeysekera, 2014)
2.7.10 Project management classification of waste
The following classification originates from typical Key Performance Indicators (KPI’s) used in reporting construction projects. The University of Oxford defines a number of KPI’s based on the specific areas of a project being; client satisfaction, environmental, finance, personnel and process. (Oxford 2013, p. 2) Ngoc gives a number of example KPI’s including; time, issues, quality, resources and costs. (Ngoc 2014, pp. 5-6) From these examples a number of KPI’s can be developed to measure the performance of a project in relation to waste generation:
Figure 30 - Classification of wastes according to common project management KPI's. (Abeysekera, 2014)
Political Economic Social Technological Legal Environment
Requests for information (RFI’s)
Processing waste
Lack of
communication
Transporting Error in contract
documents
Contaminated materials
Design changes Transporting Poor weather
Design and detailing errors
Waiting/idle time
Making-do Inventory
Time Cost Quality Safety Environment Etc
Waiting/idle time
Constructability concerns
Processing waste
Unnecessary motion
Contaminated materials
Criminal waste Transporting Inventory Making-do Poor weather
Lack of
communication
Design and detailing errors
Design errors Accidents Requests for
information (RFI’s)
2.7.11 Value adding classification of waste
This classification groups all processes into the categories of; value adding, non-value adding and non-value adding but necessary. Both subgroups of non-value adding and necessary but non-value adding are considered wasteful. Non-value adding or ‘pure waste’ includes processes such as unnecessary movement, storage between processes and waiting times. Necessary but non-value adding process, such as transportation and unpacking materials, are those which add no value but are required in the current operational environment. These can only be eliminated with major changes to the operating system.
Hines goes on to state that there are seven categories of waste; overproduction, waiting, transport, inappropriate processing, unnecessary inventory, unnecessary motion and defects. All of these can be categorised into these to subgroups depending on the operation. (Hines & Rich 1997) Russell lists the same categories with the addition of talent, which is underutilising potential skills and knowledge of employees. (Russell 2009)
2.8 Concrete construction
2.8.1 TechnologyOver the past few decades the use of new technologies has led to vast improvements in speed and productivity of concrete construction. In recent years there has been an explosion in the variety of concrete mixes and applications. These mixes cater to everything from freezing temperatures to reducing carbon emissions. New technologies for placement using machines have meant that concrete can be placed in more locations and in larger quantities without human error. The use of concrete pumps is now commonplace for pours ranging from small hard to get to locations to pours for monolithic structures involving hundreds of cubic meters. Another common technology is slip form pavers which utilise a mobile formwork to move along the concrete pour continually placing, compacting and finishing the concrete. This technology has an array of applications ranging from construction of high-rise cores to pavements and traffic barriers. However, these are expensive machines and are only cost effective for large volume concrete pours. (Zayed, 2008 p1).
2.8.2 Current methodologies
Concrete has many applications for construction, including: buildings, roads, bridges and drainage structures. These are all constructed in different ways, but for most the actual process of concreting stays the same. Concrete pumps are now used for most operations with the exception of small easily accessible locations or tall buildings where a crane and bucket may be employed. Although pumps are costly they are still much more efficient than traditional methods of carting concrete by hand. This allows the pour to be completed more quickly and with less labour needed. This is quite important in Australia where labour costs are quite high compared to material costs. Pumps also allow us to pour in locations previously inaccessible meaning less time and material needs to be spent on creating an access to the pour l