Health and society in Southeast Asia: the transition from the late Bronze Age to Iron Age
529
0
0
Full text
(2) Health and Society in Southeast Asia: The Transition from the Late Bronze Age to Iron Age.. Helen Cekalovic. School of Medicine and Dentistry and School of Anthropology, Archaeology and Sociology James Cook University. Supervisors: Dr Kathryn Domett and Dr Nigel Chang. A thesis submitted in partial fulfilment of the requirements for the degree of Doctor of Philosophy March 2014.
(3) Acknowledgements My first and foremost thanks go to my primary supervisor, Kathryn Domett, who provided me with the opportunity to undertake this research in the first place and has supported me with an unwavering positive attitude. My secondary supervisor, Nigel Chang, has provided me with an invaluable education on the intricacies of Southeast Asian archaeology, for which I am thankful. I also appreciate the opportunity to excavate at Ban Non Wat, which would not have happened without the permission of the Directors of the excavation, Charles Higham, Rachanie Thosarat and Amphan Kijngam as well as the Fine Arts Department, Thailand Government. For the many months whilst I was analysing skeletal remains in the Phimai ‘Bone House’, Nancy Tayles and Siân Halcrow provided me with advice, guidance and friendship. I enjoyed working with them both immensely and appreciate their welcoming an Australian into the Otago ‘clan’. Also from the Bone House I would like to thank Natthamon Pureepatpong for her support. The following people spent many hours excavating and cleaning skeletal material from Ban Non Wat, and for that, and their friendship, I thank my fellow bioanthropology and bioarchaeology students and excavators, including Anna Willis, Kimberly Curtis, Diana Leech, and Angela Clark. Many other archaeologists and students excavated at Ban Non Wat over a number of years and I appreciate their passion for their research and their openness in sharing ideas with me. I especially would like to thank Alison Carter, Peter Petchey, Hayden Cawte, Carmen Sargeant and Rosie Geary. From James Cook University, I would like to thank Claudia Diaz and Yissu Martinez (School of Medicine and Dentistry); my Academic Advisor the late Phil Summers (School of Veterinary and Biomedical Sciences) and David Roe, Rosita Henry and Shelley Greer (School of Arts and Social Sciences). I would also like to thank all of the students with whom I shared an office in the School of Veterinary and Biomedical Sciences, but most especially Jennifer Scott and Lisa Elliott. I would like to thank the villagers of Ban Non Wat, who provided me with laughter and an insight into a world unlike my own. In Phimai, the help and friendship of Daeng, Aoul and Kaew was much appreciated. Finally I would like to thank for their support: my friends, Jenny Fiddian and Shaunagh Darroch, as well as my family.. ii.
(4) Statement of the Contribution of Others Supervision: Dr Kathryn Domett and Dr Nigel Chang. This research was funded by a James Cook University Postgraduate Research Scholarship and Graduate Research Scheme Grants (School of Arts, Education and Social Sciences). Statistical Support was provided by Daniel Zamykal. Professional editorial assistance (Standards D and E of the Australian Standards for Editing Practice Handbook) was provided by Stephen Hillman.. iii.
(5) Abstract Bioarchaeological studies incorporate components of bioanthropological and archaeological research. Alone each discipline presents valuable information, but when these disparate methods are used in combination to examine past societies, a holistic interpretation can result. The purpose of this study is to develop a methodology that quantifies the overall health of individuals based on skeletal remains found in archaeological contexts. The Southeast Asian Health Index was inspired by the Western Hemisphere Health Index. The challenge in devising a health index for Southeast Asian skeletal remains from archaeological contexts is multifaceted. The index must be relevant at an individual level, easily reproduced by any user and include health attributes that are collected as standard from skeletal remains. In this thesis, the Southeast Asian Health Index is developed and forms the basis of a series of bioarchaeological analyses. The index comprises the following attributes; age at death, dental health (alveolar bone health, caries and ante-mortem tooth loss), trauma, growth (enamel hypoplasia and long bone length), degenerative joint disease, childhood cranial and orbital lesions, and other pathological conditions. The structure of the health index enables comparison of individual health attributes as well as overall community health. As a way to test this index, the transition period from the Late Bronze Age to Early Iron Age in northeast Thailand was investigated using health and social indicators. The two sites examined were Noen U-Loke and Ban Non Wat. The health of individuals within each time period, Mid Bronze Age, Late Bronze Age, Early Iron Age, and Mid Iron Age, were compared with societal indicators, seen in burial treatment. Five hypotheses were tested in this study based on the results of the Southeast Asian Health Index and individual burial treatments. Two hypotheses are based solely on the Southeast Asian Health Index. Firstly, it is hypothesised that the health of the people of Ban Non Wat and Noen U-Loke improved from the Late Bronze Age to Iron Age. It was found that overall health improved through time, but with complexity. This complexity was evident in the testing of the second hypothesis. In addition, patterns regarding individual health attributes could be identified. For example, this included an improvement in male dental health over time, whereas female dental health remained static. The second hypothesis stated that health differentiation could be seen between archaeological sites in the same region. The context of the settlement influences the health of the village. In iv.
(6) this study, the newly established village of Noen U-Loke, in the Early Iron Age, showed a distinct difference to the well established village of Ban Non Wat. Based on relationships between the Southeast Asian Health Index and burial treatments, two further hypotheses were tested. The third hypothesis asserts that there is a correlation between burial treatment and health. A number of correlations between health and burial treatment were identified. These suggest that females buried with ornaments had poorer health, as did males with animal bones. It is postulated that these burial goods may be medical aides or amulets for the afterlife. The fourth hypothesis tests the assertion that a correlation between health and burial treatment reflects social identity. It was identified that when health data are used in combination with burial treatment data, social identity was more reasonably distinguished than by using burial goods alone. The combination of health data with burial treatment enabled additional context, which ultimately altered interpretations of social identity based solely on burial goods. In one case, the interpretation of occupation suggested by the burial goods was refuted by the health data. The final and fifth hypothesis relates to burial treatment and tests if society became more stratified from Late Bronze Age to Iron Age. Based on the sample, no evidence of stratified society could be identified. Overall, it was found that the Southeast Asian Health Index provides a sound method of identifying relative health for individuals, groups and populations through time. Used in combination with archaeological contextual information it can provide multidisciplinary interpretations. The use of burial treatment data, rather than estimations of wealth to identify social identity, is distinctively different to previous studies. This study provides a unique bioarchaeological methodology, combining health and social status, to produce additional interpretations.. v.
(7) Glossary BP. Before Present (1950 AD) – a measurement of uncalibrated radiocarbon years, counted from 1950 AD (CE).. Bronze Age. Generic technological classification based on the presence of copper alloys found in archaeological contexts. In the Khorat Plateau, Thailand dates approximately 3,000 to 2,400 BP.. DNA. Deoxyribonucleic acid.. Holocene. Environmental classification. Dates from 11,550 BP to present. Iron Age. Generic technological classification based on the presence of iron objects. Dates from 2400 to 1350 BP on the Khorat Plateau in Thailand.. Neolithic. Generally a lithic technology classification but has other connotations, including ceramics and agriculture. Its use in Southeast Asia is debatable, but the period dates from approximately 6,500 to 3,000 BP.. Palaeolithic. Lithic technology classification. Predates the Neolithic. In Southeast Asia dates from approximately 45,000 to 6,500 BP.. Pleistocene. Environmental classification. Dates from 1.81 million BP to 11,550 BP.. Abbreviations BA. Bronze Age. BNW. Ban Non Wat. EH. Enamel Hypoplasia. EI. Early Iron Age. IA. Iron Age. LB. Late Bronze Age. MI. Mid Iron Age. MNI. Minimum Number of Individuals. NUL. Noen U-Loke. QALY. Quality Adjusted Life Years. SEAHI. Southeast Asian Health Index. WHHI. Western Hemisphere Health Index. vi.
(8) Table of Contents Table of Contents .............................................................................................................vii List of Tables..................................................................................................................... xv List of Figures .................................................................................................................. xix 1. Introduction .............................................................................................................. 30 1.1. A holistic approach ....................................................................................................... 30. 1.2. The purpose of the study ............................................................................................. 32. 1.3. Context is (almost) everything .................................................................................. 33. 1.3.1. Mainland Southeast Asian Overview ..................................................................................... 33. 1.3.2. Paleoenvironment ........................................................................................................................... 36. 1.3.3. Early socio-cultural organisation and health .................................................................... 38. 1.3.4. Socio-cultural organisation and health in the Bronze Age ......................................... 39. 1.3.5. Socio-cultural organisation and health in the Iron Age ............................................... 47. 1.4. 1.4.1. Ban Non Wat ....................................................................................................................................... 56. 1.4.2. Noen U-Loke ....................................................................................................................................... 62. 1.5. 2. Ban Non Wat and Noen U-Loke .................................................................................. 56. Transition from Bronze to Iron Age ......................................................................... 66. Health and Society Studies .................................................................................... 68 2.1. What is Health? .............................................................................................................. 68. 2.2. Social Identity ................................................................................................................. 70. 2.2.1. Socio-cultural organisation ........................................................................................................ 70. 2.2.2. Theory of Social Identity .............................................................................................................. 72. 2.3. Health and Society Studies in Southeast Asia ........................................................ 75 2.3.1.1. Relationship between health and society at Bronze Age Ban Lum Khao................... 76. 2.3.1.2. Relationship between health and status at Iron Age Noen U-Loke ............................. 77. vii.
(9) 2.4. Hypotheses ...................................................................................................................... 77. 2.4.1. Hypothesis 1 -The health of the people of Ban Non Wat and Noen U-Loke. improved from the Late Bronze Age to Iron Age............................................................................. 78 2.4.2. Hypothesis 2 - Differentiation of health can be seen between archaeological. sites in the same region ................................................................................................................................ 80 2.4.3. Hypothesis 3 - There is a correlation between burial treatment and health ... 81. 2.4.4. Hypothesis 4 - Correlation between health and burial treatment reflects social. identity .................................................................................................................................................................. 82 2.4.5. Hypothesis 5 - Society became more stratified from the Late Bronze Age to the. Iron Age................................................................................................................................................................. 83 2.5. 3. Why a health index? ...................................................................................................... 84. Development Of Health Index Methodology .................................................... 85 3.1. Health Assessments ...................................................................................................... 85. 3.2. Health Index Models ..................................................................................................... 88. 3.2.1. What is a health index? ................................................................................................................. 88. 3.2.2. Health Indices for Archaeological Contexts ....................................................................... 89. 3.2.2.1. 4. Western Hemisphere Health Index ........................................................................................ 90. 3.2.3. Limitations of any prehistorical health study ................................................................... 93. 3.2.4. Limitations of the Western Hemisphere Health Index ................................................. 96. Southeast Asian Health Index .............................................................................. 99 4.1. Framework of the Southeast Asian Health Index ................................................. 99. 4.1.1. Testing of the Health Index......................................................................................................... 99. 4.1.2. The dataset ........................................................................................................................................101. 4.1.2.1. Ban Non Wat - Skeletal Material ........................................................................................... 101. 4.1.2.2. Noen U-Loke – Skeletal Material........................................................................................... 101. 4.1.3. Components of a Southeast Asian Health Index ............................................................101. 4.1.4. Age at Death ......................................................................................................................................102 viii.
(10) 4.1.4.1. Methods......................................................................................................................................... 102. 4.1.4.2. Evaluation of aging methods on Asian samples .............................................................. 104. 4.1.4.3. Age determination methods in current study .................................................................. 105. 4.1.4.4. Age Categories ............................................................................................................................ 106. 4.1.4.5. Results – Age - Ban Non Wat .................................................................................................. 107. 4.1.4.6. Results – Age - Noen U-Loke .................................................................................................. 111. 4.1.4.7. Ban Non Wat and Noen U-Loke - Consideration of Age and Sex................................ 114. 4.1.4.8. SEAHI Methodology – Age At Death .................................................................................... 115. 4.1.5. Dental Health ...................................................................................................................................115. 4.1.5.1. Alveolar Bone Health ................................................................................................................ 116. 4.1.5.2. Caries and Ante-mortem Tooth Loss .................................................................................. 119. 4.1.5.3. SEAHI Methodology – Dental Health................................................................................... 126. 4.1.6. Trauma ................................................................................................................................................127. 4.1.6.1. Trauma identified in Ban Non Wat and Noen U-Loke ................................................... 128. 4.1.6.2. SEAHI Methodology - Trauma ............................................................................................... 129. 4.1.7. Growth .................................................................................................................................................129. 4.1.7.1. Long bone lengths ..................................................................................................................... 130. 4.1.7.2. Enamel Hypoplasia.................................................................................................................... 135. 4.1.8. Degenerative Joint Disease .......................................................................................................137. 4.1.8.1. Joint Disease at Ban Non Wat and Noen U-Loke ............................................................. 138. 4.1.8.2. SEAHI Methodology – Degenerative Joint Disease ......................................................... 139. 4.1.9. Childhood Cranial and Orbital Lesions ...............................................................................139. 4.1.9.1. Haematopoietic childhood conditions visible in adults ................................................ 139. 4.1.9.2. Iron Withholding Reactions in Ban Non Wat and Noen U-Loke ................................ 141. 4.1.9.3. SEAHI Methodology – Childhood cranial and orbital lesions ..................................... 142. 4.1.10. Infections/Other Pathologies ...............................................................................................143. 4.1.10.1. 4.2. SEAHI Methodology – Infections/other pathologies .................................................. 145. Calculation of the SEAHI ............................................................................................145 ix.
(11) 4.2.1. 5. Health Index results .............................................................................................. 151 5.1. The SEAHI and components – Results....................................................................151. 5.1.1. Dental Disease .................................................................................................................................152. 5.1.2. Trauma ................................................................................................................................................162. 5.1.3. Long Bone Length ..........................................................................................................................170. 5.1.4. Enamel Hypoplasia .......................................................................................................................181. 5.1.5. Joint Disease .....................................................................................................................................193. 5.1.6. Childhood Lesions .........................................................................................................................204. 5.1.7. Pathology ...........................................................................................................................................204. 5.1.8. SEAHI ...................................................................................................................................................217. 5.1.9. Correlation between health indicators...............................................................................225. 5.2. 6. Limitations ........................................................................................................................................150. Health in Ban Non Wat and Noen U-Loke ..............................................................229. 5.2.1. Diet and Dental Hygiene.............................................................................................................230. 5.2.2. Trauma ................................................................................................................................................230. 5.2.3. Growth Disruptions ......................................................................................................................231. 5.2.4. Mobility and Ability ......................................................................................................................232. 5.2.5. Disease.................................................................................................................................................234. 5.2.6. SEAHI ...................................................................................................................................................234. Society ....................................................................................................................... 237 6.1. Mortuary Practice Studies and Theory..................................................................237. 6.2. Status and Wealth – a misnomer .............................................................................239. 6.2.1. Production, energy expenditure and investment .........................................................239. 6.2.2. Production steps ............................................................................................................................240. 6.2.3. Rarity of artefacts ..........................................................................................................................240. 6.2.4. Quantity of grave goods..............................................................................................................240 x.
(12) 6.2.5. Symbolism .........................................................................................................................................241. 6.2.6. Wealth Indices .................................................................................................................................241. 6.2.7. Unravelling the past by probing the grave: Can wealth or status be identified? 242. 6.3. 7. Burial Treatment .........................................................................................................244. 6.3.1. Burial Goods Types - Groupings.............................................................................................245. 6.3.2. Other Factors ...................................................................................................................................246. 6.3.3. Recording Burial Goods Data - Noen U-Loke...................................................................247. 6.3.4. Recording Burial Goods Data - Ban Non Wat ..................................................................247. Burial Treatment results ..................................................................................... 249 7.1. Noen U-Loke and Ban Non Wat ................................................................................249. 7.1.1. Ornaments .........................................................................................................................................249. 7.1.2. Blades ...................................................................................................................................................252. 7.1.3. Pottery .................................................................................................................................................255. 7.1.4. Animal Bone .....................................................................................................................................257. 7.1.5. Industrial Goods .............................................................................................................................259. 7.1.6. ‘Other’ Goods ....................................................................................................................................261. 7.1.7. Number of Variables ....................................................................................................................263. 7.1.8. Orientation of the body...............................................................................................................265. 7.1.9. Number of artefacts ......................................................................................................................268. 7.1.10. Number of ornaments ..............................................................................................................271. 7.1.11. Wild Animal Burial Goods ......................................................................................................274. 7.1.12. Exotic Goods ..................................................................................................................................274. 7.2. Interpretation of the burial goods sample ...........................................................275. 7.2.1. Transitional change from the Bronze Age to the Iron Age .......................................275. 7.2.2. Signs of Daily Life ...........................................................................................................................277. xi.
(13) 8. 7.2.3. Immigrants? Or Availability of Goods? ...............................................................................278. 7.2.4. Industrial goods as indicators of village craft specialization ..................................280. 7.2.5. Establishment of a new community .....................................................................................281. 7.2.6. Change in customs.........................................................................................................................282. 7.2.7. Establishment of power subgroups .....................................................................................283. 7.2.8. Status interpretations..................................................................................................................284. Relationships between Health and Status ...................................................... 289 8.1. Stress, Social Inequality and Health .......................................................................289. 8.2. Health and social status studies ..............................................................................291. 8.2.1. Holistic study ...................................................................................................................................293. 8.2.2. Heath and status in the present study ................................................................................296. 8.3. Health and Burial Treatment at Noen U-Loke and Ban Non Wat ...................298. 8.3.1. Significant Statistical Relationships .....................................................................................298. 8.3.1.1. Ban Non Wat and Noen U-Loke............................................................................................. 298. 8.3.1.2. Noen U-Loke ................................................................................................................................ 299. 8.3.1.3. Ban Non Wat................................................................................................................................ 299. 8.3.1.4. Males – overall ............................................................................................................................ 300. 8.3.1.5. Females – Overall....................................................................................................................... 300. 8.3.1.6. Females at Ban Non Wat ......................................................................................................... 301. 8.3.1.7. Females at Noen U-Loke .......................................................................................................... 301. 8.3.1.8. Males at Ban Non Wat .............................................................................................................. 301. 8.3.1.9. Males at Noen U-Loke............................................................................................................... 302. 8.3.1.10. Mid Bronze Age ........................................................................................................................ 302. 8.3.1.11. Late Bronze Age ....................................................................................................................... 302. 8.3.1.12. Early Iron Age........................................................................................................................... 302. 8.3.1.13. Mid Iron Age ............................................................................................................................. 303. 8.3.2. Protect the village or better health in the afterlife? .....................................................303 xii.
(14) 9. Individual life stories ........................................................................................... 307 9.1. Noen U-Loke ..................................................................................................................307. 9.1.1 9.2. Brave hunters or symbolic medical treatment. ..............................................................307. Ban Non Wat..................................................................................................................311. 9.2.1. Productive and respected..........................................................................................................311. 9.2.2. Family plots in the Late Bronze Age? ..................................................................................313. 10 Discussion ............................................................................................................. 317 10.1. The methodology – a Southeast Asian Health Index .......................................317. 10.1.1. Testing of the SEAHI – what questions can be asked? .............................................318. 10.1.1.1. Did the health of the people of Ban Non Wat and Noen U-Loke improve from the. Late Bronze Age to Iron Age? ................................................................................................................... 318 10.1.1.2. Can health differentiation be seen between archaeological sites in the same. region?. 319. 10.2. The Context - The Burial Ritual .............................................................................320. 10.3. Holistic Approach - Health and Burial Treatments .........................................323. 10.3.1. Is there a correlation between burial treatment and health? ..............................324. 10.3.2. Is there a correlation between health and burial treatment that reflects social. identity? ..............................................................................................................................................................325 10.3.3. Did society become more stratified from the Late Bronze Age to the Iron. Age?. 325. 10.4. Summary - The Transition from the Bronze Age to the Iron Age ................327. 10.4.1. Hypotheses summary ...............................................................................................................329. 10.4.2. Research directions and conclusions ...............................................................................330. 11 REFERENCES ......................................................................................................... 332 12 APPENDICES.......................................................................................................... 356 Appendix A. Health Data....................................................................................................358. Appendix B. SEAHI ..............................................................................................................453 xiii.
(15) Appendix C. Skeletal Data – Correlations .....................................................................458. Appendix D. Burial Treatment – Correlation...............................................................464. Appendix E. Data..................................................................................................................467. Appendix F. Correlations and Significant Relationships ..........................................470. Appendix G. T-Tests ............................................................................................................475. Appendix G.1. Ban Non Wat and Noen U-Loke ............................................................................475. Appendix G.2. All Males ...........................................................................................................................482. Appendix G.3. All Females ......................................................................................................................487. Appendix G.4. Noen U-Loke ...................................................................................................................492. Appendix G.5. Noen U-Loke – Males .................................................................................................497. Appendix G.6. Noen U-Loke - Females .............................................................................................501. Appendix G.7. Ban Non Wat ..................................................................................................................502. Appendix G.8. Ban Non Wat – Males .................................................................................................507. Appendix G.9. Ban Non Wat – Females............................................................................................508. Appendix G.10. Mid Bronze Age..........................................................................................................516. Appendix G.11. Late Bronze Age.........................................................................................................518. Appendix G.12. Early Iron Age .............................................................................................................519. Appendix G.13. Noen U-Loke – Early Iron Age ............................................................................522. Appendix G.14. Mid Iron Age ................................................................................................................528. xiv.
(16) List of Tables Table 1: Terminology used in Southeast Asian prehistorical chronology (see Dunn, 1970, D. Bayard, 1984, Higham, 1996, Higham, 1998, Oxenham et al., 2001, Stark, 2004, King and Norr, 2006). ............ 34 Table 2: Paleoenvironment of the Mun River Valley (adapted from Boyd and Habberfield-Short, 2007, McGrath et al., 2008). .......................................................................................................................... 38 Table 3: Summary of phases at Ban Non Wat (adapted from Higham and Higham, 2009). .................... 61 Table 4: Comparison of mortuary phases at Ban Non Wat and Noen U-Loke. ....................................... 63 Table 5: Terminology used in socio-cultural evolutionary context (adapted from Redman 1978). .......... 71 Table 6: Comparison of a sample of health status studies. ..................................................................... 87 Table 7: Age determination of Ban Non Wat sample by sex. ............................................................... 109 Table 8: Age determination of Ban Non Wat sample by phase: count of individuals. ........................... 109 Table 9: Cross tabulation of sex and age groups in each phase at Ban Non Wat. .................................. 110 Table 10: Age determination of Noen U-Loke sample......................................................................... 112 Table 11: Age determination of Noen U-Loke sample by phase. ......................................................... 113 Table 12: Cross tabulation of sex and age groups in each phase at Noen U-Loke. ................................ 113 Table 13: Cross-tabulation of sites and age groups at Ban Non Wat and Noen U-Loke. ....................... 114 Table 14: Cross-tabulation of age and time period at Ban Non Wat and Noen U-Loke. ........................ 115 Table 15: Prevalence of caries by period at Ban Non Wat and Noen U-Loke (sample from this study only). ................................................................................................................................................. 122 Table 16: Simple comparison of age groups in Ban Non Wat by percentage of individuals with caries and attrition. ............................................................................................................................................. 123 Table 17: Indications of trauma in Ban Non Wat sample. .................................................................... 128 Table 18: Indications of trauma from the Noen U-Loke sample. .......................................................... 128 Table 19: Scoring methodology for SEAHI ........................................................................................ 148 Table 20: Mean dental disease score of males and females from combined Noen U-Loke and Ban Non Wat sample. ....................................................................................................................................... 156 Table 21: Comparison of mean trauma score according to location...................................................... 162 Table 22: Mean trauma score for Ban Non Wat and Noen U-Loke. ..................................................... 166 Table 23: Mean trauma score in Ban Non Wat according to sex. ......................................................... 166. xv.
(17) Table 24: Mean trauma score in Noen U-Loke according to sex. ......................................................... 166 Table 25: Mean Long bone length score according to location. ........................................................... 171 Table 26: Descriptive statistics of long bone length within the sexes at Ban Non Wat and Noen U-Loke. .......................................................................................................................................................... 175 Table 27: Mean EH score according to location. ................................................................................. 181 Table 28: Mean EH according to sex at Noen U-Loke and Ban Non Wat............................................. 187 Table 29: One Way Anova Tukey HSD Test of individuals from Ban Non Wat and Noen U-Loke according to age. ................................................................................................................................ 197 Table 30: Mean score for Joint Disease by sex. ................................................................................... 199 Table 31: Mean of Joint Disease score by sex at Ban Non Wat. ........................................................... 199 Table 32: Means of joint disease score at Noen U-Loke according to sex. ........................................... 199 Table 33: Tukey HSD test of joint disease in regards to phase at Ban Non Wat and Noen U-Loke. ...... 201 Table 34: Mean pathology according to location. ................................................................................ 204 Table 35: Comparison of mean pathology score according to sex. ....................................................... 209 Table 36: Pathology score relationships between phases using t-tests. ................................................. 212 Table 37: Mean SEAHI score according to location. ........................................................................... 217 Table 38: Mean SEAHI scores according to age groups. ..................................................................... 218 Table 39: Tukeys HSD of mid adult SEAHI score differences according to phase. .............................. 220 Table 40: Tukeys HSD test of SEAHI scores in the Early Iron Age according to age. .......................... 221 Table 41: Mean SEAHI scores according to sex. ................................................................................. 221 Table 42:Tukey HSD test of males according to phase. ....................................................................... 224 Table 43: Percentage of burials at Ban Non Wat according to presence of ornaments. ......................... 249 Table 44: Cross tabulation of presence/absence of ornaments and phase in Ban Non Wat and Noen ULoke. ................................................................................................................................................. 250 Table 45: Percentage of individuals by sex according to presence of ornaments interred in burial. ....... 250 Table 46: Percentage of individuals by sex and site through the time phases according to presence of ornaments. ......................................................................................................................................... 251 Table 47: Percentage of individuals by age according to presence of ornaments interred in burial. ....... 251 Table 48: Percentage of individuals by age and site through the time phases according to presence of ornaments. ......................................................................................................................................... 252. xvi.
(18) Table 49: Percentage of burials at Noen U-Loke according to presence of blades. ............................... 252 Table 50: Percentage of burials at Ban Non Wat according to presence of blade. ................................. 253 Table 51: Percentage of individuals by sex according to presence of blades interred in burial. ............. 253 Table 52: Percentage of individuals by sex and site through the time phases according to presence of blades. ............................................................................................................................................... 253 Table 53: Percentage of individuals by age according to presence of blades interred in burial. ............. 254 Table 54: Percentage of individuals by age and site through the time phases according to presence/absence of blades. ................................................................................................................ 254 Table 55: Percentage of burials at NUL according to presence of pottery............................................. 255 Table 56: Percentage of burials at Ban Non Wat according to presence of pottery. .............................. 255 Table 57: Percentage of individuals by sex according to presence of pottery interred in burial. ............ 256 Table 58: Percentage of individuals by sex and site through the time phases according to presence of pottery. .............................................................................................................................................. 256 Table 59: Percentage of individuals by age according to presence of pottery interred in burial. ............ 256 Table 60: Percentage of individuals by age and site through the time phases according to presence of pottery. .............................................................................................................................................. 257 Table 61: Percentage of burials at NUL according to presence of animal bone. .................................... 257 Table 62: Percentage of burials at Ban Non Wat according to presence of animal bone........................ 257 Table 63: Percentage of individuals by sex according to presence of animal bone interred in burial. .... 257 Table 64: Percentage of individuals by sex and site through the time phases according to presence of animal bone. ...................................................................................................................................... 258 Table 65: Percentage of individuals by age according to presence of animal bone interred in burial. .... 258 Table 66: Percentage of individuals by age and site through the time phases according to presence of animal bone. ...................................................................................................................................... 258 Table 67: Percentage of burials at NUL according to presence of industrial goods. .............................. 260 Table 68: Percentage of burials at Ban Non Wat according to presence of industrial goods. ................. 260 Table 69: Percentage of individuals by sex according to presence of industrial goods interred in burial.260 Table 70: Percentage of individuals by sex and site through the time phases according to presence of industrial goods. ................................................................................................................................. 260 Table 71: Percentage of individuals by age according to presence of industrial goods interred in burial. .......................................................................................................................................................... 260. xvii.
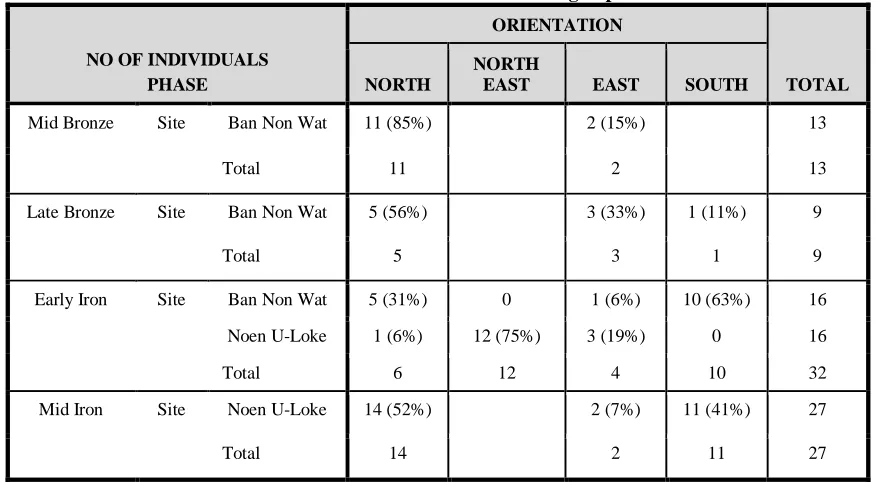
(19) Table 72: Percentage of individuals by age and site through the time phases according to presence of industrial goods. ................................................................................................................................. 261 Table 73: Percentage of burials at NUL according to presence of goods classified as ‘other’................ 262 Table 74: Percentage of burials at Ban Non Wat according to presence of goods classified as ‘other’... 262 Table 75: 'Other' types of burial goods found in Ban Non Wat and Noen U-Loke according to phase. .. 262 Table 76: Percentage of individuals by sex according to presence of goods classified as ‘other’ interred in burial. ................................................................................................................................................ 262 Table 77: Percentage of individuals by sex and site through the time phases according to presence of goods classified as ‘other’. ................................................................................................................. 263 Table 78: Percentage of individuals by age according to presence of goods classified as ‘other’ interred in burial. ................................................................................................................................................ 263 Table 79: Percentage of individuals by age and site through the time phases according to presence of goods classified as ‘other’. ................................................................................................................. 263 Table 80: Orientation of burials at Ban Non Wat and Noen U-Loke. Direction indicates where the head is positioned. ......................................................................................................................................... 265 Table 81: Orientation of burials according to phase. ............................................................................ 266 Table 82: Orientation of burials at Ban Non Wat according to phase and sex. ...................................... 266 Table 83: Orientation of individuals buried at Ban Non Wat according to age and phase. .................... 267 Table 84: Orientation of burials at Noen U-Loke according to sex and phase. ...................................... 267 Table 85: Orientation of burials at Noen U-Loke according to age and phase....................................... 268 Table 86: Descriptive statistics for number of artefacts according to phase. ......................................... 269 Table 87: Listing of items found with Early Iron Age mid adults at Ban Non Wat. .............................. 277 Table 88: Data collected by Robb et al. (2001). ................................................................................... 294 Table 89: Brief summary of features or transitional changes through time of burial goods and health at Ban Non Wat and Noen U-Loke. ........................................................................................................ 328. xviii.
(20) List of Figures Figure 1: The physical boundaries of Cambodia, Laos and Thailand, highlighting the Khorat Plateau and the Mekong River. ............................................................................................................................... 35 Figure 2: Location of sites mentioned in text......................................................................................... 37 Figure 3: Aerial photo of Ban Non Wat (Google, 20 October 2013a). .................................................... 59 Figure 4: Location of burials at Ban Non Wat (from Higham and Higham, 2009). ................................. 59 Figure 5: Aerial photo of Noen U-Loke (Google, 20 October 2013b). ................................................... 62 Figure 6: Noen U-Loke mound contour map, adapted from Higham and Thosarat (2007b). ................... 64 Figure 7: Plan of burials by NUL mortuary phase at Noen U-Loke (from Higham, 2002). ..................... 65 Figure 8: Aspects of Social Identity (from Knudson and Stojanowski, 2008). ........................................ 74 Figure 9: Model for a medical health index, modified from Boyle and Torrance (1984). ........................ 89 Figure 10: Graphic representation of biological quality of life at each age (from Steckel et al., 2002b: 64). ............................................................................................................................................................ 91 Figure 11. Taphonomic factors that affect archaeological skeletal collections (from Mays, 1998). ......... 96 Figure 13: Age groups as a percentage of each phase at Ban Non Wat. ................................................ 110 Figure 14: Age breakdown of adults in Noen U-Loke, also categorised into sexes. .............................. 112 Figure 15: Age of Noen U-Loke sample as a percentage of each phase. ............................................... 113 Figure 16: Stages of infrabony defects, taken from Papapanou and Tonetti (2000 :Figure 2). ............... 117 Figure 17: Periapical cavity in a young female adult BNW549. ........................................................... 119 Figure 18: Percentage of teeth with caries at Noen U-Loke and Ban Non Wat, by age group. .............. 122 Figure 19: Percentage of AMTL by number of total tooth positions, by age group and sex at Ban Non Wat.................................................................................................................................................... 125 Figure 20: The percentage of individuals with AMTL within the maxillary and mandibular dentition, Ban Non Wat. ........................................................................................................................................... 126 Figure 21: Boxplots of male long bone lengths (selected elements) from Ban Non Wat. ...................... 132 Figure 22: Boxplots of male long bone lengths (selected elements) from Noen U-Loke. ...................... 132 Figure 23: Boxplots of female long bone lengths (selected elements) from Ban Non Wat. ................... 133 Figure 24: Boxplots of female humeral long bone lengths from Noen U-Loke. .................................... 134 Figure 25: SEAHI of individuals in Noen U-Loke and Ban Non Wat in order of highest score to lowest -. xix.
(21) mean is 50.......................................................................................................................................... 151 Figure 26: Dental Disease score mean by location............................................................................... 152 Figure 27: Boxplot of dental disease score according to location. ........................................................ 153 Figure 28: Mean of Dental Disease score by age at Ban Non Wat and Noen U-Loke. .......................... 153 Figure 29: Boxplot of dental disease scores according to location and age group. ................................ 154 Figure 30: Dental disease mean score according to phase and age. ...................................................... 154 Figure 31: Boxplot of dental disease scores according to age and phase............................................... 155 Figure 32: Mean dental disease according to site and sex. ................................................................... 156 Figure 33: Boxplot of dental disease score according to location and sex. ............................................ 157 Figure 34: Mean dental disease according to phase. ............................................................................ 158 Figure 35: Mean dental disease according to phase and location. ......................................................... 158 Figure 36: Boxplot of dental disease according to phase. ..................................................................... 159 Figure 37: Boxplot of dental disease according to location and phase. ................................................. 159 Figure 38: Mean dental disease score by phase and sex. ...................................................................... 160 Figure 39: Boxplot of dental disease score according to phase and sex. ............................................... 161 Figure 40: Mean dental disease score according to sex and age. .......................................................... 161 Figure 41: Boxplot of dental disease according to age and sex............................................................. 162 Figure 42: Mean trauma score according to age in Ban Non Wat and Noen U-Loke. ........................... 163 Figure 43: Mean trauma scores according to age and location. ............................................................ 163 Figure 44: Boxplot of trauma scores according to location and age. ..................................................... 164 Figure 45: Mean trauma according to age and phase at Ban Non Wat and Noen U-Loke...................... 164 Figure 46: Boxplot of trauma scores according to age and phase. ........................................................ 165 Figure 47: Boxplot of trauma scores according to location and sex. ..................................................... 167 Figure 48: Mean trauma score according to phase at Ban Non Wat and Noen U-Loke. ........................ 167 Figure 49: Boxplot of trauma score according to phase and location. ................................................... 168 Figure 50: Mean trauma according to phase and sex at Ban Non Wat and Noen U-Loke. ..................... 168 Figure 51: Boxplot of trauma score in the Early Iron Age according to sex and location. ..................... 169 Figure 52: Mean trauma according to age and sex at Ban Non Wat and Noen U-Loke. ........................ 170. xx.
(22) Figure 53: Boxplot of long bone lengths according to location. ........................................................... 171 Figure 54: Mean long bone length score according to age groups at Noen U-Loke and Ban Non Wat. . 171 Figure 55: Boxplot of long bone lengths according to age at Noen U-Loke and Ban Non Wat. ............ 172 Figure 56: Mean long bone length according to site and age. ............................................................... 173 Figure 57: Boxplot of long bone length according to location and age. ................................................ 173 Figure 58: Long bone length mean according to age and phase............................................................ 174 Figure 59: Boxplot of long bone length scores according to phase and age. ......................................... 174 Figure 60: Boxplot of long bone length of sample of Ban Non Wat and Noen U-Loke according to sex. .......................................................................................................................................................... 175 Figure 61: Mean long bone length score according to site and sex. ...................................................... 176 Figure 62: Long bone length mean according to sex and phase. ........................................................... 176 Figure 63: Boxplot of long bone length scores according to phase and sex. ......................................... 177 Figure 64: Mean long bone score according to sex, location and phase. ............................................... 178 Figure 65: Mean long bone length score according to phase. ............................................................... 179 Figure 66: Boxplot of long bone lengths according to phases. ............................................................. 179 Figure 67: Mean long bone length according to site and phase. ........................................................... 180 Figure 68: Long bone length according to sex and age. ....................................................................... 180 Figure 69: Mean long bone length according to sex, age and phase. .................................................... 181 Figure 70: Boxplot of EH score according to location. ........................................................................ 182 Figure 71: Mean EH score according to age at Ban Non Wat and Noen U-Loke. ................................. 183 Figure 72: Boxplot of EH scores according to age. .............................................................................. 183 Figure 73: Mean EH Score according to location and age. ................................................................... 184 Figure 74: Boxplot of EH score according to age and location............................................................. 185 Figure 75: Mean EH score according to phase and age. ....................................................................... 186 Figure 76: Boxplot of EH score according to age and phase. ............................................................... 186 Figure 77: Mean EH score according to sex and location. ................................................................... 187 Figure 78: Boxplot of EH scores according to sex and location. .......................................................... 188 Figure 79: Mean EH score according to phase. ................................................................................... 188 Figure 80: Boxplot of EH score according to phase. ............................................................................ 189. xxi.
(23) Figure 81: Mean EH score according to site and phase. ....................................................................... 190 Figure 82: Boxplot of EH Scores according to phase and location. ...................................................... 190 Figure 83: Mean EH Scores according to sex and phase. ..................................................................... 191 Figure 84: Boxplot of EH scores according to sex and phase. .............................................................. 192 Figure 85: Mean EH score according to age and sex. .......................................................................... 192 Figure 86: Boxplot of EH Score according to age and sex. .................................................................. 193 Figure 87: Comparison of joint disease mean scores between Ban Non Wat and Noen U-Loke. ........... 194 Figure 88: Boxplot of joint disease score according to site. ................................................................. 195 Figure 89: Mean joint disease score according to age at Noen U-Loke and Ban Non Wat. ................... 195 Figure 90: Joint disease mean according to age and location. .............................................................. 196 Figure 91: Boxplot of joint disease scores for adults according to location and age. ............................. 197 Figure 92: Mean joint disease score according to phase and age. ......................................................... 198 Figure 93: Boxplot of joint disease scores according to age and phase. ................................................ 198 Figure 94: Boxplot of joint disease scores by sex and location............................................................. 200 Figure 95: Mean score of joint disease at Ban Non Wat and Noen U-Loke based on time phase........... 200 Figure 96: Boxplot showing joint disease scores according to phase and location. ............................... 202 Figure 97: Mean Joint Disease score according to sex and phase at Ban Non Wat and Noen U-Loke. .. 202 Figure 98: Boxplot of the Early Iron Age - joint disease score according to site and sex....................... 203 Figure 99: Joint disease means according to age and sex in Ban Non Wat and Noen U-Loke. .............. 203 Figure 100: Boxplot of pathology score according to location. ............................................................ 205 Figure 101: Mean pathology score according to age group. ................................................................. 205 Figure 102: Boxplot of the pathology score according to age group. .................................................... 206 Figure 103: Mean Pathology score according to location and age. ....................................................... 206 Figure 104: Boxplot of pathology score according to age and location................................................. 207 Figure 105: Mean pathology score according to phase and age. ........................................................... 207 Figure 106: Boxplots of pathology score according to age and phase. .................................................. 208 Figure 107: Boxplot of pathology score according to sex. ................................................................... 209 Figure 108: Mean pathology score according to sex and location. ....................................................... 210. xxii.
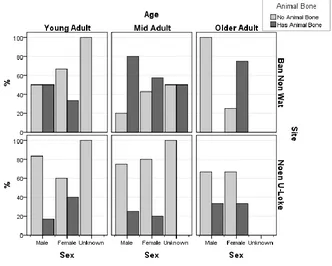
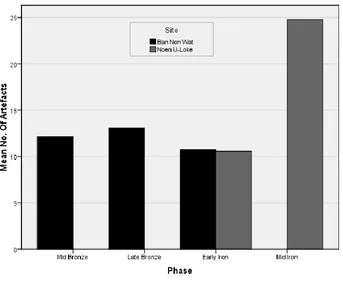
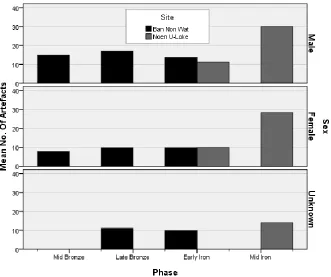
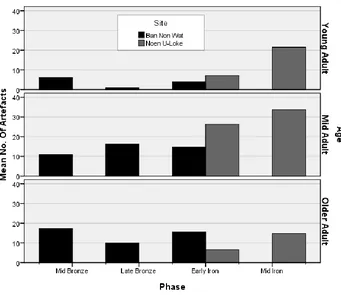
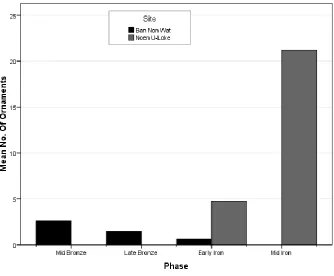
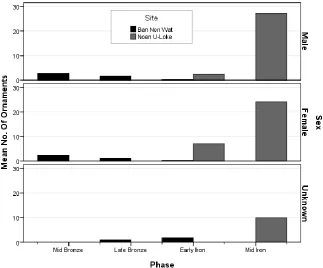
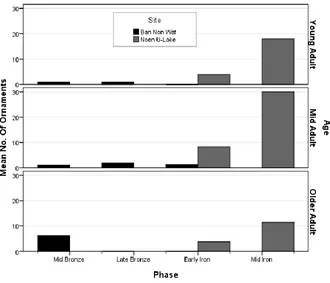
(24) Figure 109: Boxplot of pathology score according to sex and location. ................................................ 210 Figure 110: Mean pathology score according to phase. ....................................................................... 211 Figure 111: Boxplot of the pathology score according to phase at Noen U-Loke and Ban Non Wat. .... 212 Figure 112: Mean pathology according to site and phase. .................................................................... 213 Figure 113: Mean pathology scores in the Early Iron Age according to location. ................................. 213 Figure 114: Mean pathology score according to phase and sex. ........................................................... 214 Figure 115: Boxplot of pathology score according to phase and sex at Noen U-Loke and Ban Non Wat. .......................................................................................................................................................... 215 Figure 116: Mean pathology score according to sex and location in the Early Iron Age. ...................... 215 Figure 117: Boxplot of pathology score according to sex and location in the Early Iron Age. ............... 216 Figure 118: Mean Pathology according to age and sex. ....................................................................... 217 Figure 119: Boxplot of SEAHI scores according to site, outliers included. .......................................... 218 Figure 120: Boxplot of SEAHI score according to site and age............................................................ 219 Figure 121: Boxplot of mean SEAHI score according to age and phase. .............................................. 220 Figure 122: Boxplot of SEAHI scores according to sex and location. .................................................. 222 Figure 123: Boxplot of SEAHI scores according to phase. .................................................................. 222 Figure 124: Boxplot of mean SEAHI scores according to sex and phase. ............................................. 223 Figure 125: Comparison of SEAHI score of Ban Non Wat and Noen U-Loke in the Early Iron Age..... 224 Figure 126: Boxplot of SEAHI score in the Early Iron Age by site and sex. ......................................... 225 Figure 127: Scatter graph showing correlation between EH Score and Long Bone Length score at Noen U-Loke and Ban Non Wat. ................................................................................................................. 229 Figure 128: SEAHI scores showing score patterning according to site. ................................................ 235 Figure 129: Percentage of individuals but age and sex at each site with/without ornaments in the Early Iron Age. ........................................................................................................................................... 252 Figure 130: Percentage of individuals with/without blade items according to age and sex at each site. . 255 Figure 131: Percentage of individuals with/without animal bone according to age and sex at each site. 259 Figure 132: Mean number of variables according to sex during each phase and site. ............................ 264 Figure 133: Mean number of variables according to age during each phase and site. ............................ 264 Figure 134: Mean number of artefacts according to phase at Ban Non Wat and Noen U-Loke. ............ 269. xxiii.
(25) Figure 135: Mean number of artefact according to sex and phase. ....................................................... 270 Figure 136: Mean number of artefacts according to phase and age....................................................... 271 Figure 137: Mean number of ornaments and artefacts according to phase. ........................................... 272 Figure 138: Mean number of ornaments according to phase. ............................................................... 272 Figure 139: Mean number of ornaments according to phase, site and sex............................................. 273 Figure 140: Mean No. of ornaments according to age, site and phase. ................................................. 274 Figure 141: Mean number of variables (from ornament and ‘other’) according to age, phase and location. .......................................................................................................................................................... 285 Figure 142: Mean number of variables (from ornament and ‘other’) according to sex, phase and location. .......................................................................................................................................................... 285 Figure 143: Cyclical relationship between environmental conditions and stress response (from Goodman et al. 1988). ........................................................................................................................................ 289 Figure 144: Stress model (Goodman and Armelagos, 1989). ............................................................... 290 Figure 145: Plan of Noen U-Loke showing the location of the burials NUL 26 and NUL 27 (take from Higham and Thosarat, 2007a). ............................................................................................................ 309 Figure 146: Location of burial goods and skeletal remains of Burial NUL 26 (take from Higham and Thosarat, 2007a). ............................................................................................................................... 310 Figure 147: Location of burial goods and skeletal remains of Burial NUL 27 (take from Higham and Thosarat, 2007a). ............................................................................................................................... 310 Figure 148: Location of burial goods and skeletal remains of BNW155 (taken from Higham and Kijngam, 2012). ................................................................................................................................................ 312 Figure 149: Location of Burials BNW 215, BNW218 and BNW227 is circled (adapted from Higham and Kijngam, 2012). ................................................................................................................................. 314 Figure 150: Location of burial goods and skeletal remains of BNW218 (taken from Higham and Kijngam, 2012) . ............................................................................................................................................... 315 Figure 151: Location of burial goods and skeletal remains of BNW215 (taken from Higham and Kijngam, 2012). ................................................................................................................................................ 315 Figure 152: Location of burial goods and skeletal remains of BNW227 (taken from Higham and Kijngam, 2012). ................................................................................................................................................ 316. xxiv.
(26) List of Tables in Appendices Table A 1: Level of wear noted in individuals from the Ban Non Wat sample. .................................... 358 Table A 2: : Individuals with evidence of periodontal disease at Ban Non Wat. ................................... 375 Table A 3: Individuals afflicted by periodontal disease compared with the Phase at Ban Non Wat. ...... 377 Table A 4: List of individuals showing evidence of periapical cavities at Ban Non Wat. ...................... 378 Table A 5: Comparison of prevalence of caries in Noen U-Loke, taken from Tayles et al. (2007), and Ban Non Wat sample................................................................................................................................. 379 Table A 6: Number of tooth positions and Individuals from Noen U-Loke with missing lateral incisors (taken from Nelsen et al., 2001). ......................................................................................................... 380 Table A 7: Comparison of AMTL between Ban Non Wat and Noen U-Loke. Noen U-Loke data taken from Tayles (2007)............................................................................................................................. 381 Table A 8: Bony anomalies in the sample from Ban Non Wat. ............................................................ 382 Table A 9: Mean length (mm) of long bones from Bronze and Iron Age sites in northeast Thailand and regional means. Ban Chiang data obtained from Pietrusewsky and Toomay (2002a), the Non Nok Tha database from Douglas (1996a), and the Ba Na Di and Ban Lum Khao databases (K. Domett, pers. comm). .............................................................................................................................................. 386 Table A 10: Long bone lengths (mm) from the male sample at Ban Non Wat. ..................................... 387 Table A 11: Long bone lengths (mm) from the female sample at Ban Non Wat. .................................. 388 Table A 12: Male adult individuals from Noen U-Loke - long bone length (mm). ................................ 389 Table A 13: Long bone lengths (mm) recorded in female adult individuals from Noen U-Loke............ 390 Table A 14: Enamel Hypoplasias identified in the Ban Non Wat sample. ............................................ 391 Table A 15: Prevalence of enamel hypoplasias in Ban Non Wat and Noen U-Loke (based on raw data). .......................................................................................................................................................... 392 Table A 16: Non-vertebral joint bony anomalies in sample from Ban Non Wat. .................................. 393 Table A 17: Vertebral joint bony anomalies in the sample from Ban Non Wat. .................................... 403 Table A 18: Vertebral bodies with osteoarthritis indicators, Ban Non Wat. .......................................... 411 Table A 19: Summary of DJD in joints and vertebrae in the sample from Ban Non Wat. ..................... 412 Table A 20: DJD or joint anomalies identified at Noen U-Loke, taken from Tayles et al. (2007). ......... 416 Table A 21: Individuals in Ban Non Wat with potential evidence of an anaemic reaction. .................... 417 Table A 22: Photographs of pitting visible on the crania of individuals at Ban Non Wat. ..................... 419. xxv.
Figure

+7

Related documents
Simulation comparison of the nonlinear physical, linear first order and neural network models to each other and the observed data demonstrated that firstly, all models were accu-
The assembly process for these robots is automated through the Robot Fabricator , introduced previously [4], and in this paper the assembly procedure is extended to allow for
One of the advantage of the proposed method is that the analysis is based on a majorizing sequence and the stopping rule (which is different from the
Stratifying the population into tertiles according to the level of HsCRP showed increased ANGPTL8 level at higher tertiles of HsCRP in the overall population ( p value =
Wilding has during the past three decades or so published more than a dozen books of fiction, frequently semi- autobiographical, both in Australia and England,
Queen Consolidated Inc.(QCI), a listed company, has 45 million shares on issue (QCI shares experience high trade volumes) and operates in three (3) business segments: real
By chance, these four individuals had been assigned highly specific terms relating to bone ossification, the toe and long bone morphology (right panel of Figure S6). This
Information included in “Community Announcements” does not have official endorsement of NSWDoE and may not be school activities. The announcements are a service to the community
