4
A Dissertation on
ASSOCIATION BETWEEN DIABETIC RETINOPATHY AND THE NEUTROPHIL LYMPHOCYTE RATIO, PLATELET LYMPHOCYTE RATIO, MONOCYTE LYMPHOCYTE RATIO.
Dissertation Submitted to
THE TAMILNADU Dr. M.G.R. MEDICAL UNIVERSITY CHENNAI - 600 032
With partial fulfillment of the regulations for the award of the degree of
M.D. GENERAL MEDICINE BRANCH-I
COIMBATORE MEDICAL COLLEGE COIMBATORE
5
CERTIFICATE
Certified that this is the bonafide dissertation done by Dr.KIRUTHIKA J and submitted in partial fulfillment of the
requirements for the Degree of M.D., General Medicine, Branch I of The Tamilnadu Dr. M.G.R. Medical University, Chennai.
Date: Guide, Professor & Chief
Medical Unit I
Date: Professor & Head
Department of Medicine
Date: Dean
6
DECLARATION
I solemnly declare that the dissertation titled Association between Diabetic retinopathy and the Neutrophil lymphocyte ratio, Platelet lymphocyte ratio, Monocyte lymphocyte ratio was done by me from JULY 2016 to JUNE 2017 under the guidance and supervision of Professor Dr. KUMAR NATARAJAN. M.D.,
This dissertation is submitted to The Tamilnadu Dr.M.G.R. Medical University towards the partial fulfilment of the requirement for the award of MD Degree in General Medicine (Branch I).
Place: Coimbatore Dr. KIRUTHIKA J
7
ACKNOWLEDGEMENT
I wish to express my sincere thanks to our respected Dean Dr. B.ASHOKAN, M.S,Mch for having allowed me to conduct this
study in our hospital.
I express my heartfelt thanks and deep gratitude to the Head of the Department of Medicine Prof. Dr. KUMAR NATARAJAN, M.D. for his generous help and guidance in the course of the study.
I owe a great debt of gratitude to our respected Professor and unit chief Prof. Dr. KUMAR NATARAJAN, M.D without whose help and
advice this work would not have been possible.
I sincerely thank all professors and Asst. Professors - Dr. P. VISHNURAM, MD, Dr.N. KARUPPUSAMY,M.D, Dr.A.AKILA, M.D, Dr.SANGEETHA M.D, for their guidance and kind help.
I also extend my gratitude to Prof. Dr.M.HEMANANDHINI,MS, DO., Department of ophthalmology for her support and expert guidance.
8
My sincere thanks to all my friends and post-graduate colleagues for their whole hearted support and companionship during my studies.
I thank all my PATIENTS, who formed the backbone of this study without whom this study would not have been possible.
Lastly, I am ever grateful to the ALMIGHTY GOD for always showering His blessings on me and my family.
DATE: Dr. KIRUTHIKA J
PLACE:
9
CERTIFICATE II
Association between Diabetic retinopathy and the Neutrophil lymphocyte ratio, Platelet lymphocyte ratio, Monocyte lymphocyte ratio of the candidate DR.KIRUTHIKA J with registration Number 201511303 for the award of M.D in the branch of General Medicine I personally verified the urkund.com website for the purpose of plagiarism Check. I found that the uploaded thesis file contains from introduction to conclusion pages and result shows 3% ( three percentage) of plagiarism in the dissertation.
13
LIST OF ABBREVIATIONS
AGEs Advanced Glycation End Products anti- GAD anti-Glutamic acid decarboxylase BMI Body mass index
CRP C- reactive protein CVD Cardiovascular disease DR Diabetic retinopathy ER Endoplasmic reticulum
ETDRS Early treatment of diabetic retinopathy study GDM Gestational diabetes mellitus
HLA Human leucocyte antigen IAA Islet Autoantibody
ICA Islet cell cytoplasmic autoantibodies ICMR Indian Council of Medical Research IDPP Indian Diabetic Prevention Programme IFG Impaired Fasting Glycemia
IGT Impaired Glucose Tolerance iNos Inducible nitric oxide synthase
IRMA Intraretinal Microvascular Abnormality IRS Insulin Receptor Substrate
LADA Latent autoimmune diabetes of Adults
14
NAD Nicotinamide adenine dinucleotide
NADH Nicotinamide adenine dinucleotide hydrate NKK NF-KB Kinase
NLR Neutrophil Lymphocyte Ratio
NPDR Non Proliferative Diabetic Retinopathy OGTT Oral Glucose Tolerance Test
PAI Plasminogen Activator Inhibitor PDR Proliferative Diabetic Retinopathy PKC Protein Kinase C
PLR Platelet lymphocyte ratio ROS Reactive Oxygen Species T1DM Type 1 Diabetes mellitus T2DM Type 2 Diabetes mellitus TGF Transforming Growth factor TNF Tumour Necrosis Factor
15
CONTENTS
S/No Title Page No
1 INTRODUCTION 1
2 AIM OF STUDY 3
3 REVIEW OF LITERATURE 4
4 MATERIALS AND METHODS 45
5 RESULTS 48
6 DISCUSSION 80
7 CONCLUSION 82
8 BIBLIOGRAPHY 83
19 ANNEXURES
A 1 PROFORMA A2 CONSENT FORM A3 MASTER CHART
16 LIST OF TABLES
S/No TABLE PAGE NO
1 GROUP WISE DISTRIBUTION 49
2 AGE DISTRIBUTION IN THE STUDY 50
3 GROUP WISE AGE DISTRIBUTION 51
4 SEX DISTRIBUTION 52
5 GROUP WISE SEX DISTRIBUTION 53
6 SMOKING DISTRIBUTION 54
7 GROUP WISE SMOKING DISTRIBUTION 55
8 DURATION OF DIABETES MELLITUS 56
9 GROUP WISE DURATION OF DM 57
10 MEAN OF AGE, SYSTOLIC & DIASTOLIC BP 58 11 MEAN OF DURATION OF DM, FBS, HbA1c 59 12 GENERAL CHARATCERISTICS OF LIPID
PROFILE
60
13 GENERAL CHARACTERISTICS OF CBC 61 14 GENERAL CHARACTERISTICS OF NLR,
MLR, PLR
61
15 COMPARISON OF MEANS OF AGE IN DIFFERENT GROUPS
62
17
19 MEAN FBS IN THREE GROUPS 66
20 COMPARISON OF MEAN HbA1c IN THREE GROUPS
67
21 COMPARISON OF MEAN TOTAL CHOLESTEROL
68
22 COMPARISON OF MEAN TGL 69
23 COMPARISON OF MEAN HDL 70
24 COMPARISON OF MEAN WBC 71
25 COMPARISON OF MEAN LYMPHOCYTE COUNT
72
26 COMPARISON OF MEAN NEUTROPHIL COUNT
73
27 COMPARISON OF MEAN MONOCYTE COUNT IN THREE GROUPS
74
28 COMPARISON OF PLATELET COUNT IN THREE GROUPS
75
29 COMPARISON OF NLR IN THREE GROUPS 76 30 COMPARISON OF MLR IN THREE GROUPS 77 31 COMPARISON OF PLR IN THREE GROUPS 78 32 PEARSON CORRELATION WITH
RETINOPATHY
18
LIST OF CHARTS
S/No CHARTS PAGE NO
1 GROUP WISE DISTRIBUTION 49
2 AGE DISTRIBUTION IN THE STUDY 50
3 GROUP WISE AGE DISTRIBUTION 51
4 SEX DISTRIBUTION 52
5 GROUP WISE SEX DISTRIBUTION 53
6 SMOKING DISTRIBUTION 54
7 GROUP WISE SMOKING DISTRIBUTION 55
8 DURATION OF DIABETES MELLITUS 56
9 GROUP WISE DURATION OF DM 57
10 MEAN OF AGE, SYSTOLIC & DIASTOLIC BP 58
11 MEAN OF DURATION OF DM, FBS, HbA1c 59
12 GENERAL CHARATCERISTICS OF LIPID PROFILE 60 13 COMPARISON OF MEANS OF AGE IN DIFFERENT
GROUPS
62
14 MEAN DURATION OF DIABETES MELLITUS 63
15 MEAN SYSTOLIC BP IN THREE GROUPS 64
16 MEAN DIASTOLIC BP IN THREE GROUPS 65
17 MEAN FBS IN THREE GROUPS 66
19
19 COMPARISON OF MEAN TOTAL CHOLESTEROL 68
20 COMPARISON OF MEAN TGL 69
21 COMPARISON OF MEAN HDL 70
22 COMPARISON OF MEAN WBC 71
23 COMPARISON OF MEAN LYMPHOCYTE COUNT 72
24 COMPARISON OF MEAN NEUTROPHIL COUNT 73
25 COMPARISON OF MEAN MONOCYTE COUNT IN THREE GROUPS
74
26 COMPARISON OF PLATELET COUNT IN THREE GROUPS 75
27 COMPARISON OF NLR IN THREE GROUPS 76
28 COMPARISON OF MLR IN THREE GROUPS 77
29 COMPARISON OF PLR IN THREE GROUPS 78
20
LIST OF FIGURES
S/No FIGURE PAGE NO
1 PATHOPHYSOLOGY OF TYPE 1 DM 12
2 PATHOPHYSOLOGY OF TYPE 2 DM 13
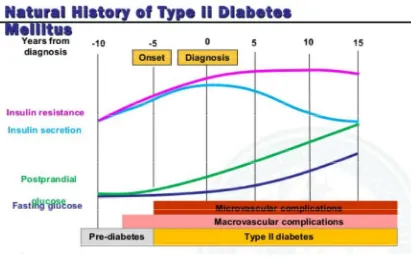
3 NATURAL HISTORY OF DM 14
4 PATHOPHYSILOGY OF COMPLICATIONS 20 5 INFLAMMATORY AND VASCULAR
DYSFUNCTION IN DM
25
6 STAGES OF DIABETIC RETINOPATHY 27
7 ABBREVIATED ETDRS CLASSIFICATION 28 8 NON PROLIFERATIVE DIABETIC
RETINOPATHY
29
9 SEVERE NON PROLIFERATIVE DR 29
10 VERY SEVERE NON PROLIFERATIVE DR 30 11 PROLIFERATIVE DIABETIC RETINOPATHY 30
12 NPDR & PDR 31
13 CLINICALLY SIGNIFICANT MACULAR EDEMA
32
14 BACKGROUND AND PROLIFERATIVE DR 34
21
INTRODUCTION
Diabetes mellitus is a condition in which there is a chronically raised blood glucose concentration. It is caused by an absolute or relative lack of the hormone insulin, i.e. insulin is not being produced from the pancreas or there is insufficient production of insulin or impaired insulin action for the needs.
The two main types of diabetes are Type 1 which presents mainly in childhood and early adult life and accounts for about 20% of cases in Europe and North America. It is thought to be caused by autoimmune destruction of insulin producing islet cells of pancreas.
Type 2 Diabetes usually starts in middle age or in the elderly. It is more common accounting for 80% of cases. It is due to either impaired insulin secretion or resistance to the action of insulin at its targets cells. Most of these patients are obese.
22
Diabetic retinopathy is a serious complication of diabetes mellitus and it is considered as a major cause of blindness in working population. Its pathogenesis is complicated and it is related to many factors, but many groups have described the role of inflammatory markers in the development of diabetic retinopathy.
23
AIM OF STUDY
24
REVIEW OF LITERATURE
DIABETES MELLLITUS
Diabetes mellitus is a metabolic disorder involving carbohydrate, protein and fat metabolism resulting from absolute or relative insulin deficiency and resulting in chronic hyperglycemia manifesting with its microvascular and macrovascular complications. In fact diabetes can have a long variable asymptomatic period of 5 years to 15 years and may be diagnosed for the first time because of its comorbities or complications.
The long term effects of diabetes include damage, dysfunction and failure of various other organs which includes progressive development of retinopathy with potential blindness, nephropathy that may lead to renal failure, neuropathy with risk of foot ulcers, amputation, charcot joints and features of autonomic dysfunction including sexual dysfunction. People with diabetes are at increased risk of macrovascular complications like cardiovascular, peripheral vascular and cerebrovascular diseases.
EPIDEMIOLOGY
25
TYPE 1 DIABETES
Type 1 diabetes may present at any age, but most typically presents in early life with peak incidence around the time of puberty. Its incidence varies from 50 -100 fold around the world, with the highest among the Northern Europe and in individuals of European extraction. Both the sexes are equally affected in childhood, but men are more commonly affected in early adult life. This distinction between type 1 and type 2 varies in later life and thus true life incidence is unkown. According to DIAMOND study, Finland has the maximum number of patients with Diabetes.
TYPE 2 DIABETES
The World Health Organisation estimated that 9% of the
population suffered from Diabetes in 2014, over 90% of them had type 2 Diabetes. Moreover type 2 diabetes caused 5 million deaths per year , mostly from cardiovascular disease, and type 2 diabetes is expected to become 7th leading cause of death globally by 2030. Type 2 diabetes is
strongly associated with obesity and as such the major burden is now in the middle income and developing countries where urbanization and recent affluence has rapidly changed the lifestyle.
26
age groups (132 million in 2010) which are expected to rise further. By 2030, there will be more diabetic population in the 60 to 79 age groups (196 million).
GESTATIONAL DIABETES
GDM is common in many population including Asian Indians. Pregnant women should be tested for GDM at 24 weeks to 28 weeks of gestation. Gestational diabetes is a prediabetic state with an increased risk of development of the disorder in subsequent pregnancies, in 60 to 90%. It is also known that women with GDM have a high risk upto 30% of developing diabetes within 7 10 years of index pregnancy.
PREVALENCE IN INDIA
The prevalence of diabetes in India in 1970s was 2.3% in urban and 1.5% in rural areas as shown by study conducted by ICMR. In 2000s the prevalence gradually increased. India which has a large pool of pre diabetics shows rapid conversion of these high risk subjects to diabetes. The Indian Diabetic Prevention Programme 1 (IDPP 1) has shown an annual incidence of approximately 18% among subjects with IGT.
27
The major contributory factors for the prevalence of the complications are: delayed diagnosis of diabetes, inadequate control of diabetes, hypertension and lack of awareness about the disease among majority of the public.
Diabetic retinopathy is one of the most common complication and leading cause of preventable blindness among the working population. It is estimated that around 93 million have diabetic retinopathy of whom 17 million (18%) have proliferative diabetic retinopathy, 21 million (23%) have diabetic macular edema, and 28 million (20%) have vision threatening diabetic retinopathy.
WHO CRITERIA:
Criteria for Diabetes diagnosis: 4 options
Fasting plasma glucose 126 mg/dl (7.0mmol/L) Fasting is defined as no caloric intake for 8 hours.
2 hour post prandial glucose 200mg/dl (11.1mmol/L) during OGTT (75g)
Using a glucose load containing the equivalent of 75g anhydrous glucose dissolved in water.
HbA1C 6.5% (48mmol/L)
28 CLINICAL CLASSIFICATION
Classicaly, the clinical presentation of Diabetes was the basis of its classification into insulin dependent and non insulin dependent diabetes. Insulin dependent diabetes term was used to refer an early onset diabetes ( affecting children and adolescents and adults < 30 years of age , affected patients are lean and thin presenting with classical osmotic symptoms (polyuria, polydipsia, weight loss) and are ketosis prone and requiring insulin i.e.,insulin was needed to prevent ketosisfor their survival.
Similarly, non insulin dependent diabetes refers to adult onset diabetes (>40 years age) , in overweight / obese individuals who were not insulin requiring but were insulin resistant and could be controlled on diet, exercise and medications in combination or alone. However at the turn of the twenty first century this nomenclature was replaced and diabetes was classified into type 1 and type 2 diabetes, this indicated a paradigm shift in the basis of classification from a clinical basis to pathogenetic basis.
PATHOGENIC CLASSIFICATION
29
Diabetes can be classified into four clinical categories:
1. Type 1 diabetes (due to beta cell destruction, usually leading to absolute insulin deficiency)
- immune mediated - idiopathic
2. Type 2 diabetes ( due to a progressive insulin secretory defect on the background of insulin deficiency)
3. Other specific types of diabetes due to other causes Genetic defects in beta cell function
MODY 1- Mutation in Hepatocyte nuclear transcription factor (HNF) 4 alpha.
MODY 2 Mutation in Glucokinase gene MODY 3 Mutation in HNF 1 alpha
MODY 4 Mutation in Insulin promoter factor-1 gene MODY 5 Mutation in HNF 1D gene
MODY 6 Mutation in neurogenic differentiation -1 transcription factor
(Neuro D1/Beta 2)
Mitochondrial deoxyribonucleic acid
Subunits of ATP sensitive potassium channel Mutations in Proinsulin or insulin
Genetic defects in insulin action
30 Leprechaunism
Rabson Mendelhall syndrome
Lipodystrophy syndromes
Diseases of the exocrine pancreas:
Cystic fibrosis, chronic pancreatitis, pancreatectomy, hemochromatosis, neoplasia, fibrocalculous pancreatopathy, mutations in carboxy esteryl lipase.
Endocrinopathies:
Acromegaly, glucoganoma, pheochromocytoma, hyperthyroidism, somatostatinoma, aldosteronoma.
Drug or chemical induced :
Such as in the treatment of HIV / AIDS or after organ transplantation ,viz., glucocorticoids, pentamidine, protease inhibitors, nicotinic acid, diazoxide, epinephrine, beta adrenergic agonists, thiazides, hydantoin, asparaginase, antipsychotics, etc.,
Infections: Congenital rubella, cytomegalovirus, coxsackie virus
Uncommon forms of immune mediated diabetes: Stiff person syndrome, insulin receptor antibodies
31
syndrome, ataxia, chorea, Laurence moon biedl syndrome, myotonic dystrophy, porphyria, Prader willi syndrome.
4. Gestational diabetes mellitus
ETIOLOGY AND RISK FACTORS:
Diabetes both type 1 or type 2 has equally strong genetic and environmental risk factors an interaction of which leads to clinical expression of the disease. The genetic suscepitibilty for type 1 is associated with certain Human leucocyte antigen (HLA ) combinations DR3, DR4 and the environmental insults are rather ill defined. Possibilty of some aspects of diet and viral infections trigerring an autoimmune exposure causing specific destruction of beta cells of pancreas has been proposed.
32 PATHOPHYSIOLOGY
[image:29.612.126.537.403.702.2]In Type 1 diabetes there is autoimmune destruction pancreatic islet cells following interaction between environmental and genetic factors. The major antibodies detected are insulin autoantibody, glutamic acid decarboxylase autoantibody, insulinoma associated autoantigen 2 autoantibody and zinc transporter 8 autoantibody. Indeed, immunological studies revealed the essential involvement of the adaptive immune system in the pathogenesis of T1DM. It is found that CD8+ T cells are the most predominant in the insulitis lesion, followed by CD68+ macrophages, CD4+ T cells, CD20+ B lymphocytes and CD138+ plasma cells.
33
The pathophysiology of type 2 diabetes includes impaired insulin secretion, impaired insulin action, insulin resistance and impaired incretin effect on the beta cell function and non suppression of the action of alpha cells with rising blood glucose levels. In the last two decades the role of adipokines as regulators of beta cell function and insulin sensitivity has been demonstrated in number of studies.
Type 2 Diabetes is a life style disorder and an interaction of genetic and environmental factors precipitates the metabolic abnormalities existing in prediabetic subjects to the clinical stage of diabetes. There is a long asymptomatic pre-diabetic stage before the development of diabetes. These stages are easily identifiable by OGTT.
For the development of diabetes both the basic pathophysiological defects ,i.e., insulin resistance and beta cell secretory defect have to coexist.
Figure 2
34 PRE DIABETES
[image:31.612.134.548.403.663.2]The definition of IGT has been stable. The American Diabetes Association recommends the normal cut off for fasting plasma glucose as <100mg/dl. Both IGT and IFG have heterogenous pathogenesis and hence may have different rates of progression to diabetes. People with combined IFG and IGT have approximately double the rate of conversion to diabetes than those with any one of the abnormalities. Both the states are associated with insulin resistance and other cardiovascular risk factors such as dyslipidemia and hypertension. IGT is shown to be stronger predictor than IFG.
Figure 3
35
CLINICAL FEATURES
The clinical features depend upon the type of Diabetes, the stage in the natural history of diabetes and on the presence of its attendant complications or comorbidities. Type 1 diabetes constitutes <5% of all diabetes while Type 2 diabetes contributes to 95% of diabetes in the world including in India. Type 1 diabetes results in near total destruction of beta cells of islets of Langerhans in the pancreas resulting in absolute insulin deficiency resulting in hyperglycemia which presents with osmotic symptoms like polyuria, polydipsia and unexplained weight loss and with diabetic ketoacidosis and intercurrent infections.
Type 2 Diabetes due to environmental and genetic factors result in insulin resistance ( relative insulin deficiency). Hyperinsulinemia in initial stages keeps fasting plasma glucose normal but in response to glucose load, post prandial hyperglycemia occurs. During the period of worsening insulin resistance there will be loss of first phase insulin release followed by hyperglycemia in both fasting and post prandial state. This continued hyperglycemia will result in both microvascular and macrovascular complication after a variable period of asymptomatic phase.
LATENT AUTOIMMUNE DIABETES OF ADULTS (LADA)
36
between type 1 and type 2 diabetes. Age of onset 30years, no insulin requirement for at least 6 months after diagnosis and presence of one or more of the antibodies (anti-GAD, IAA OR ICA) are the criteria for diagnosis of LADA. Latent autoimmune diabetes of adults in turn has been classified into LADA type 1 and LADA type 2.
The LADA type 1 has two or more antibodies present in high titres and has a phenotype closer to one described for classical type 1 diabetes. On the contrary, LADA type 2 has only one antibody present in low titres and the phenotype is similar to that for type 2 diabetes.
MODY
Maturity onset diabetes of Young is diabetes with a monogenic inheritance pattern. It has a autosomal dominant inheritance and has early age of onset and the genetic defect results in diminished insulin secretion. Any person with diabetes in three successive generations with the age of diabetes < 25 years without any classical features of insulin resistance should be suspected to have MODY.
Diabetes mellitus can come to our notice with one or more of the following clinical features:
Asymptomatically diagnosed on routine screening in health camps or preventive health check ups.
37
Unexplained weight loss despite normal appetite
Recurrent bacterial skin infection - boils, carbuncles, cellulitis Recurrent urinary tract infections
Recurrent or difficult to treat fungal infections of skin and its appendages tinea corporis / pedis / cruris / candidial intertrigo or paronychia.
Chronic vaginal discharge or vulval pruritis in females and recurrent balanoposthitis in males.
Tuberculosis diabetics with uncontrolled hyperglycemia have a greater predisposition to develop tuberculosis
Polyuria and polydipsia
Overt renal failure or microalbuminuria (diabetic nephropathy) Diabetic neuropathy symmetrical peripheral neuropathy or other variants Impotence, loss of libido, dyspareunia and loss of sudomotor functions secondary to autonomic dysfunction
Vision disturbances rapidly changing glasses because of osmotic changes in the lens secondary to glycemic fluctuations, early onset cataract, secondary glaucoma and diabetic retinopathy.
Atherosclerotic vascular disease coronary, cerebral or peripheral vascular disease
38 RISK FACTORS TO SCREEN
Risk factors for diabetes which mandates screening in asymptomatic adult individual:
O the following features:
Physical inactivity
Diabetes in first degree relative
History of gestational diabetes mellitus or gave birth to a baby weighing >4kg
Hypertension (BP 140/90mmHg)
High density Lipoprotein cholesterol <35mg/dl
Serum triglycerides >250mg/dl
High risk ethic groups like pima Indians or races
Pre diabetes
Women with polycystic ovarian syndrome
Clinical conditions associated with insulin resistance severe obesity, acanthosis nigricans
39 COMPLICATIONS
Unlike the microvascular disease, which starts with the onset of diabetes, the macrovascular disease antedates the development of overt diabetes by several years. Around 75% to 80% of all diabetic patients will die prematurely of cardiovascular (macrovascular) disease, particularly coronary heart disease. Diabetic foot problems (gangrene, large non healing infected ulcers) are the commonest cause of non traumatic lower limb amputation. In one Indian study done at Chennai, the prevalence of coronary heart disease was 21.4% among diabetic patients, 14.9% among impaired glucose tolerance subjects and 11% among non diabetic patients. The prevalence of peripheral arterial disease in the same population was 6.3%.
40
[image:37.612.135.540.253.460.2]Meta analysis and systemic reviews have confirmed that DM increases CVD risk by around two fold on an average and this risk is subject to wide variation being lowest in the newly diagnosed and highest in those with existing vascular disease, proteinuria or renal disease.
Figure 4
The effects of diabetes on pathogenesis of atherosclerosis is due to endothelial dysfunction, oxidative stress, activation of polyol pathways, metabolic factors, coagulation and inflammatory factors and vascular related factors.
41
US. Poor glycemic control, long duration of diabetes and systolic blood pressure are risk factors for microvascular complications.
Risk of chronic complication in type 1 and 2 diabetes results from chronic hyperglycemia. It has been conclusively demonstrated in type 1 and type 2 diabetes microvascular complications can be prevented or delayed if chronic hyperglycemia is reduced. Other incompletely defined factors may moderately reduce development of complications. For instance, some individuals never develop nephropathy or retinopathy despite long standing diabetes though they may have similar glycemic control to patients with microvascular complications suggesting genetic suscepitibilty for developing particular compications.
There is now strong correlation between the occurrence and severity of microvascular complications in both type 1 and type 2 with duration and degree of hyperglycemia. Glucose appears to damage tissues by acute reversible changes in metabolism (e.g. sorbitol accumulation, increased NADH/NAD+ ratio, decreased myoinositol, early glycation) and by cumulative, irreversible alterations in stable macromolecules forming advanced end glycation products. Genetic susceptibility and other accelerating factors such as hypertension and hyperlipidemia, smoking also play a role.
42
many tissues it is subsequently oxidixed to fructose with the help of sorbitol dehydrogenase with NAD+ as cofactor. This sorbitol does not cross the cell membrane easily and gets accumulated intracellularly. It causes damage to the tissues through its osmotic effects, by increasing NADH/NAD+ ratio inducing pseudohypoxia and by depleting intracellular myoinositol.
Myoinositol is structurally related to glucose and it helps in activating Na+ - K+- ATPase for maintaining nerve conduction. Its depletion leads to impaired nerve function in diabetes.
In other tissues hyperglycemia leads to de novo synthesis of diacylglycerol and activation of the enzyme protein kinase C. Protein kinse c pathway is a family of serine threonine kinase that change the transcription of genes for fibronectin, type 4 collagen, contractile proteins and extracellular matrix protein in endothelial cells and neurons.
43
Next is the Hexosamine pathway where Fructose 6 phosphate, a substrate for O linked glycosylation and proteoglycan production is generated through the hexosamine pathway when hyperglycemia increase the flux. Hexosamine may alter function by glycosylation of proteins such as endothelial nitric oxide synthase or by changes in gene expression of TGF- or plasminogen activator inhibitor-1 (PAI-1).
With chronic hyperglycemia Amadori products in long lived molecules like collagen and DNA combine to form cross linked irreversible structures called advanced end glycation products (AGE). Early non enzymatic glycation products are reversible as hyperglycemia continues intermediate poorly reversible products are formed and later irreversible AGEs are formed. There is a correlation between serum levels of AGEs and the level of glycemia; these products accumulate as the glomerular filtration rate declines.
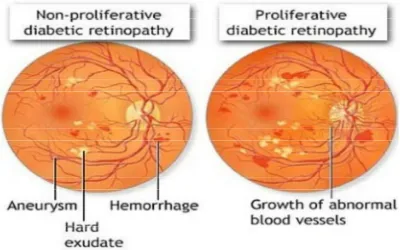
44 DIABETIC RETINOPATHY:
Diabetic retinopathy is a disorder of the retinal vessels that eventually develops to some degree in nearly all patients with long standing diabetes mellitus. A recent study in South India in urban population estimates prevalence of DM in adult population as high as 28% and the prevalence of DR in diabetics as 18%. Risk factors for diabetic retinopathy are age at diagnosis of diabetes, duration, poor control of diabetes, pregnancy, hypertension, nephropathy, hyperlipidemia, obesity, anemia, smoking.
Hyperglycemia causes intracellular accumulation of sorbitol , free radical injury, accumulation of glycated end products, disruption of ion channel, protein kinase c activation all of which in turn leads to direct effect on retinal cells, capillary wall damage and hematological and rheological changes that leads to intra retinal hemorrhages, edema, exudates, microvascular occlusion progressing to new vessel formation in iris and retina resulting in unresolved vitreous hemorrhage, retinal detachment, neovscular glaucoma finally to blindness.
45
[image:42.612.128.527.196.629.2]endothelium resulting in stimulation of basement membrane formation and leading to hyperfiltration of fluid out of the capillary. This later on leads to capillary thickening (sclerosis) limiting vasodilatation.
46 Growth factors:
Growth factors seem to play an important role in DM related complications and an increase is seen in their production by most of these proposed pathways. Vascular Endothelial Growth factor A is increased locally in diabetic proliferative retinopathy and decreases after laser photocoagulation. Inhibition of angiotensin 2 also reduces VEGF, which could explain one of the beneficial effects of angiotensin 2 receptor blockers on microangiopathic diseases.
Monoclonal antibodies to VEGF like Ranizumab in experimental studies have shown improvement in proliferative diabetic retinopathy. An increase in transforming growth factor in diabetic nephropathy stimulates basement membrane production of collagen and fibronectin by mesangial cells. Other growth factors like platelet derived growth facror, Epidermal growth factor, insulin like growth factor, growth hormone, basic fibroblast like growth factor, connective tissue growth factor and even insulin have been suggested to play a role in DM related like complications.
Angiotensin 2:
47
Angiotensin 2 stimulates VEGF production in mesangial cells and impairs glomerular structure and function. Similar changes are observed in retina.
STAGES OF DIABETIC RETINOPATHY:
48
According to Early Treatment Diabetic Retinopathy Study (ETDRS), levels of diabetic retinopathy are
49
NON PROLIFERATIVE DIABETIC RETINOPATHY
Figure 8
[image:46.612.174.474.102.325.2]SEVERE PROLIFERATIVE DIABETIC RETINOPATHY
50
VERY SEVERE NON PROLIFERATIVE DIABETIC
RETINOPATHY
Figure 10
[image:47.612.193.453.129.353.2]PROLIFERATIVE DIABETIC RETINOPATHY
51
[image:48.612.127.527.116.366.2]NPDR & PDR:
Figure 12
CLINICALLY SIGNIFICANT MACULAR EDEMA
(any one of the following)
Thickening of the retina located 500µm or less from the centre of the macula.
Hard exudates at 500µm or less from the centre of the macula with thickening of the adjacent retina.
52 Figure 13
Diabetic eye disease primarily affects the retinal blood vessels, but diabetes also accelerates cataract formation. The lesions of diabetic retinopathy can be grouped into five categories according to the features seen on ophthalmoscopy- background, preproliferative and proliferative retinopathy, advanced diabetic eye disease and maculopathy.
BACKGROUND RETINOPATHY:
53
either at weakened points or a revascularization response to microvascular occlusion.
Hard exudates are off white / yellow flakes or plaques of plasma protein and lipid which have leaked from retinal blood vessels. They are more significant in the area of macula.
Various forms of intraretinal hemorrhage also occur in the background retinopathy (superficial flame shaped or deep dot and blot cluster hemorrhage). Cotton wool spots are whitish elevations of the nerve fibre layer due to intracellular accumulation of axoplasmic material in areas of microvascular occlusion.
PRE PROLIFERATIVE RETINOPATHY:
Preproliferative retinopathy is due to worsening retinal ischemia and carries a high risk of developing into sight threatening proliferative retinopathy. Early referral to a specialist ophthalmologist is required. Preproliferative changes include multiple cotton wool spots (> 5), multiple hemorrhages, venous beading and intraretinal microvascular abnormalities (IRMAs, abnormally branched vessels in the retina, representing attempts to revascularise the ischaemic retina).
PROLIFERTIVE RETINOPATHY:
54
vessels. Contraction of the vitreous gel causes hemorrhage into the vitreous or the space between the gel and the retina. New vessels on the optic disk are associated with the most severe retinal ischaemia and the worst visual prognosis but neovascularization also occurs elsewhere on the retina.
Figure 14
ADVANCED DIABETIC EYE DISEASE:
55
glaucoma due to neovascular tissue on the iris (rubeosis iridis) spreading peripherally on the pupil and obstructing the drainage of aqueos humour.
MACULOPATHY:
Maculopathy is due to retinal edema and thickening close to macula thus threatening or causing loss of central vision. Focal or diffuse maculopathy are caused by microvascular leakage leading to formation of hard exudates in the area of macula. Ischemic maculpathy is associated with areas of capillary non perfusion and is difficult to detect. Hard exudates often occur in rings (circinate exudates) around the leaking area.
CATARACT:
Cataract is a common cause of blindness in diabetic patients. It is recognized as an opacity against the red fundal reflex when the eye is examined with an opthalmoscope at a distance of 30cm. Non enzymatic glycation of lens protein, especially alpha crystalline and subsequent cross linking probably contributes. Also sorbitol accumulation in the diabetic also could lead to osmotic swelling but the evidence for this mechanisms in human is less strong than in experimental diabetic cataracts in other species.
56
years of diabetes and 80 100% developing some form of the complication after more than 20 years duration
Maculopathy is the most common in type 2 diabetes and can be associated with severe visual loss. Patients may present with acute onset cobwebs / floaters or complete obscuration of vision caused by vitreous hemorrhage from new vessels growing into the retina or optic disc. The vitreous hemorrhage may absorb spontaneously over the next few days / weeks but it is often complicated by recurrent attacks of fresh hemorrhage. The accompanying scar tissue may contract leading to retinal tearing resulting in combined rhegmatogenous retinal detachment. Patients with extensive retinal ischemia tend to develop neovascularization of the iris and the angle of anterior chamber leading to intractable glaucoma.
INFLAMMATION AND DIABETES:
57
Endothelial injury in the adipose tissue might attract inflammatory cells such as macrophages to this site and further exacerbate the local inflammation. Hyperglycemia also stimulates ROS production in adipocytes, which leads to increased production of proinflammatory cytokines.
Studies have proposed that hyperglycemia can lead to an excessive oxidation reaction in the tricarboxylic acid cycle leading to an increase in the generation of reactive oxygen species (ROS). As a result, mitochondrial function is impaired during the production of ROS. Studies have reported that leukocytes in subjects with diabetes mellitus generates more ROS, resulting in elevated oxidative DNA damage of lymphocytes in the hyperglycemic state.
Insulin exerts its action through binding to its receptor on the surface of insulin-responsive cells. The stimulated insulin receptor phosphorylates itself and several substrates, including members of the insulin receptor substrate (IRS) family, thus initiating downstream signaling events. The inhibition of signaling downstream of the insulin receptor is a primary mechanism through which inflammatory signaling leads to insulin resistance.
58
response to insulin and the ability of IRS-1 to associate with the insulin receptor and thereby inhibits downstream signaling and insulin action.
Hence, it has become clear that inflammatory signaling pathways can also become activated by metabolic stresses originating from inside the cell as well as by extracellular signaling molecules. It has been demonstrated that obesity overloads the functional capacity of the ER and that this ER stress leads to the activation of inflammatory signaling pathways and thus contributes to insulin resistance. Additionally, increased glucose metabolism can lead to a rise in mitochondrial production of ROS. ROS production is elevated in obesity, which causes enhanced activation of inflammatory pathways.
59
[image:56.612.130.472.136.551.2]additional mechanisms linking inflammation with insulin resistance remain to be uncovered.
Figure 15. Inflammation and Diabetes
60
between systemic inflammation and vascular disease and found that chronic inflammation promotes the development and acceleration of microvascular and macrovascular complications.
Many inflammatory markers have been found to be related to DM, such as interleukin-1 (IL1), IL6, IL8, transforming growth factor beta 1, Tumor necrosis factor- alpha
(TNF-measurement is not used routinely as it is not easy to do it. Total white blood cell (TWBC) count is a crude but sensitive indicator of inflammation which can be done easily in laboratory routinely. It is a cost-effective investigation. Besides WBC counts, the Platelet Lymphocyte Ratio (PLR), Monocyte Lymphocyte Ratio (MLR), and Neutrophil Lymphocyte Ratio (NLR) are potential biomarkers reflecting inflammation and immune responses. Many studies have reported positive correlations of conventional inflammatory markers with the PLR and NLR.
NEUTROPHIL LYMPHOCYTE RATIO:
61
A study by Imtiaz et al. has suggested that chronic diseases such as hypertension and diabetes have a significant association with systemic inflammation, reflected by NLR.
Shiny et al. have shown that NLR is correlated with increasing severity of glucose intolerance and insulin resistance and can be used as a prognostic marker for macro- and micro-vascular complications in patients with glucose intolerance. Initially, NLR was recognized as a predictive marker in multiple types of cancer that might assist in patient stratification and individual risk . In this respect, NLR has emerged as a novel surrogate marker.
The immune response to various physiological challenges is characterized by increased neutrophil and decreased lymphocyte counts, and NLR is often recognized as an inflammatory marker to assess the severity of the disease. NLR represents a combination of two markers where neutrophils represent the active nonspecific inflammatory mediator initiating the first line of defense, whereas lymphocytes represent the regulatory or protective component of inflammation. But recently, multiple other studies have indicated that NLR might be a predictive marker for vascular diseases also. Recently, several studies have suggested that NLR could play a predictive role for assessing the development of microvascular complications of diabetes.
62
A study conducted in geriatric population also suggested that increased NLR levels were in itself an independent predictor for microvascular complications of DM[36]. The exact molecular action leading to IR is not yet understood, but several studies have confirmed NLR is superior to other leukocyte parameters (e.g., neutrophil, lymphocyte, and total leukocyte counts) because of its better stability compared with the other parameters that can be altered by various physiological, pathological, and physical factors. Thus, as a simple clinical indicator of IR, NLR is more sensitive compared with the neutrophilic granulocyte count and CRP levels.
PLATELET LYMPHOCYTE RATIO:
63 MONOCYTE LYMPHOCYTE RATIO:
Monocytes are considered as a biomarker for inflammation because their activation leads to the synthesis of inflammatory cytokines. A previous report suggested that monocytes may be relevant to angiogenic processes in atherosclerosis[39]. Nevertheless, the mechanisms underlying the association between the MLR and DR should be investigated in future studies.
All the people with DM (type 1 or Type 2) are at risk. .The longer
the person has diabetes the higher the risk of developing DR. Early detection, education and research are the key to prevent visual impairment / blindness from DR. Ophthalmoscopy is the most commonly used technique to screen for DR. It is critical to identify patients who are in immediate need of treatment with laser photocoagulation.
64
preproliferative changes, marked fall in acuity, retinal detachment, vitreous hemorrhage and rubeosis iridis.
Blindness due to retinopathy can be caused by maculopathy, vitreous hemorrhage, retinal detachment and neovascular glaucoma but visual loss can now be largely prevented by laser photocoagulation and vitreoretinal surgery. Panretinal photocoagulation commonly with an argon laser is used to treat new vessels and preproliferative retinopathy. The whole retina is partially ablated except for the macula and papillomacular bundle which are essential for central vision. This concentrates the blood supply on the remaining retina and diminishes the ischaemic stimulus to new vessel formation. Established new vessels regress and further neovascularization is inhibited.
65
MATERIALS AND METHODS
Source of Data:
This study is done in patients who came to Coimbatore Medical College
Hospital outpatient department.
Study Period:
One year from June 2016 to July 2017.
Sample size:
150
Study Design:
Case control study
SELECTION CRITERIA:
Inclusion criteria
Patients of both gender aged more than 18 years of age are selected.
Exclusion criteria
Patients with the following comorbidities are excluded
66 - Hepatic failure
- Renal failure - Cardiac failure
- Any acute or chronic illness - Alcohol abuse
- Hypertension
- On drugs that alter platelet function - Pregnant women
- Patients not capable of giving consent
- Patients who are not willing to participate in the study.
TECHNIQUE:
This study involves 150 diabetes mellitus patients. They are divided into three groups.
Group A 50 patients with diabetes mellitus as control subjects.
Group B 50 diabetic patients with non - proliferative diabetic retinopathy.
Group C 50 diabetic patients with proliferative diabetic retinopathy.
Cases and controls are selected on the basis of inclusion and exclusion criteria in the study.
67
PLR, NLR, MLR AND DIABETIC RETINOPATHY DEFINITIONS:
They are calculated as ratios of platelets, neutrophils and monocytes to lymphocyte ratio.
Diabetes is diagnosed by WHO criteria.
Diabetic retinopathy:
NPDR is identified by the presence of microaneursyms or intraretinal hemorrhages, hard and soft exudate.
PDR is identified by the presence of neovascularisation of optic disc and / or elsewhere in fundus with or without vitreous hemorrhage.
INVESTIGATION:
Complete blood count By using WBC, Neutrophil, Lymphocyte, Monocyte, Platelet - NLR, MLR, PLR can be calculated.
Biochemical tests like plasma glucose level, lipid profile and renal parameters, HbA1C are done.
After getting clearance from ethical committee of Coimbatore Medical college, study was done.
68
RESULTS AND ANALYSIS
The study population consisted of 150 patients who had fulfilled the inclusion and exclusion criteria and they are divided into three groups and all of them belong to type 2 diabetes mellitus.
Group A 50 diabetic patients without retinopathy
Group B 50 diabetic patients with non proliferative retinopathy
Group C 50 diabetic patients with proliferative retinopathy
The baseline characteristics of all groups were analysed and are shown in the following tables and bar diagrams.
The mean value for each parameter like Age, Sex, Duration of DM, Blood pressure, Smoking, Lipid profile, Fasting blood sugar, Total count, Neutrophils, Lymphocytes, Monocyte, Platelet, NLR, MLR, PLR were calculated and compared between groups and co related with severity of diabetic retinopathy to find out the significance.
69
Table 1. Group wise distribution
GROUP NO OF PATIENTS PERCENTAGE
T2DM 50 33.33%
T2DM+NPDR 50 33.33%
T2DM+PDR 50 33.33%
Chart 1. Group wise distribution
The overall age distribution of the study population and age distribution in each group is shown in the below table and chart.
34%
33% 33%
GROUP DISTRIBUTION
70
[image:67.612.127.525.272.668.2]
AGE DISTRIBUTION
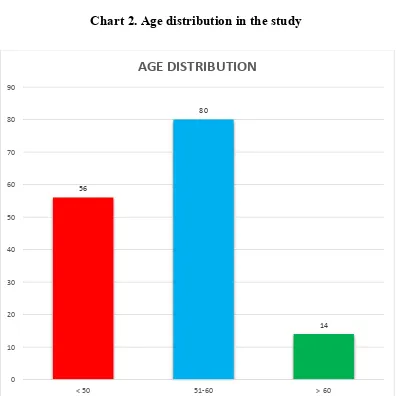
Table 2. Age distribution in the study
AGE (IN YEARS) NO OF PATIENTS PERCENTAGE
< 50 56 37.30%
51-60 80 53.30%
> 60 14 9.40%
Chart 2. Age distribution in the study
56
80
14
0 10 20 30 40 50 60 70 80 90
< 50 51-60 > 60
71
Table 3. Group wise Age distribution
GROUP
AGE (IN YEARS) T2DM T2DM+NPDR T2DM+PDR
< 50 26 23 7
51-60 22 24 34
> 60 2 3 9
Chart 3. Group wise Age distribution
26
23
7 22
24
34
2 3
9
0 5 10 15 20 25 30 35 40
T2DM T2DM+NPDR T2DM+PDR
GROUPWISE - AGE DISTRIBUTION
72
Table 4. Sex distribution in the study
SEX NO OF PATIENTS PERCENTAGE
MALE 75 50.00%
FEMALE 75 50.00%
Chart 4. Sex distribution in the study
50% 50%
SEX DISTRIBUTION
73
Table 5. Group wise sex distribution in the study
GROUP
SEX T2DM T2DM+NPDR T2DM+PDR
MALE 21 29 25
FEMALE 29 21 25
Chart 5. Group wise sex distribution in the study
21
29
25 29
21
25
0 5 10 15 20 25 30 35
T2DM T2DM+NPDR T2DM+PDR
GROUPWISE - SEX DISTRIBUTION
74
Table 6. Smoking distribution in the study
SMOKING NO OF PATIENTS PERCENTAGE
PRESENT 53 35.30%
ABSENT 97 64.70%
Chart 6. Smoking distribution in the study
35%
65%
SMOKING
75
Table 7. Group wise smoking distribution in the study
GROUP
SMOKING T2DM T2DM+NPDR T2DM+PDR
PRESENT 14 21 18
ABSENT 36 29 32
Chart 7. Group wise smoking distribution in the study
14
21
18 36
29
32
0 5 10 15 20 25 30 35 40
T2DM T2DM+NPDR T2DM+PDR
GROUP WISE -SMOKING
76
Table 8 . Duration of Diabetes mellitus
DURATION NO OF PATIENTS PERCENTAGE
< 5 YEARS 77 51.30%
5-10 YEARS 49 32.60%
> 10 YEARS 24 16.10%
Chart 8. Duration of diabetes mellitus
77
49
24
DURATION OF DM
77
Table 9. Group wise duration of diabetes mellitus
GROUP
DURATION T2DM T2DM+NPDR T2DM+PDR
< 5 YEARS 48 27 2
5-10 YEARS 2 23 24
> 10 YEARS 0 0 24
Chart 8. Group wise duration of diabetes mellitus
48
27
2 2
23 24
0 0
24
0 10 20 30 40 50 60
T2DM T2DM+NPDR T2DM+PDR
GROUP WISE - DURATION OF DM
78
Table 10. Mean of Age, Systolic BP, Diastolic BP
GENERAL CHARECTERISTICS (N = 150)
FACTOR MEAN SD
AGE (YRS) 52.92 6.99
SYSTOLIC BP 136.53 18.5
DIASTOLIC BP 87.07 13.87
Chart 10. Mean of Age, Systolic BP, Diastolic BP
52
.9
2
13
6.
53
87
.0
7
A G E ( Y R S ) S Y S T O L I C B P D I A S T O L I C B P
79
Table 11. Mean of Duration of DM, Fasting blood sugar,HbA1c
GENERAL CHARECTERISTICS (N = 150) DM
FACTOR MEAN SD
DURATION OF DM(YRS) 6.26 4.18
FBS 163.26 35.26
HBA1C 8.29 1.17
Chart 11. Mean of Duration of DM, Fasting blood sugar, HbA1c
6.26
163.26
8.29 0
20 40 60 80 100 120 140 160 180
DURATION OF DM(YRS) FBS HBA1C
80
Table 12. General characteristics of Total cholesterol, Triglycerides, HDL
GENERAL CHARECTERISTICS (N = 150) LIPID
FACTOR MEAN SD
TOTAL CHOLESTEROL 223.13 24.15
TRIGLYCERIDES 179.35 20.12
HDL 41.37 13.87
Chart 12. General characteristics of Total cholesterol, Triglycerides, HDL
223.13
179.35
41.37
0 50 100 150 200 250
TOTAL CHOLESTEROL TRIGLYCERIDES HDL
81
Table 13. General characteristics of complete blood count
GENERAL CHARECTERISTICS (N = 150) BLOOD
FACTOR MEAN SD
WBC 6359.13 1350.49
LYMPHOCYTE 2316.96 558.68
NEUTROPHIL 2992.17 811.71
MONOCYTE 409.88 158.3
PLATELET 230633 61546
Table 14. General characteristics of NLR, MLR. PLR
GENERAL CHARECTERISTICS (N = 150) RATIO
FACTOR MEAN SD
NEUTROPHIL/LYMPHOCYTE 1.3 0.13
MONOCYTE/LYMPHOCYTE 0.17 0.04
82
Table 15.Comparison of means of age in different groups
GROUP
AGE (IN YEARS)
MEAN SD
T2DM 50.28 8.06
T2DM+NPDR 51.76 5.33
T2DM+PDR 56.72 5.68
P VALUE - 0.001
SIGNIFICANT
ANOVA
Chart 13. Comparison of means of Age in different groups
50
.2
8 51
.7
6
56
.7
2
T 2 D M T 2 D M + N P D R T 2 D M + P D R
83
Table 16. Mean duration of DM
GROUP
DURATION OF DM IN YRS
MEAN SD
T2DM 2.48 1.98
T2DM+NPDR 5.68 2.27
T2DM+PDR 10.66 3.34
P VALUE - 0.001
SIGNIFICANT
ANOVA
Chart 14. Mean duration of DM
2.48
5.68
10.66
0 2 4 6 8 10 12
T2DM T2DM+NPDR T2DM+PDR
84
Table 17. Mean systolic BP in three groups
GROUP
SYSTOLIC BP
MEAN SD
T2DM 128 12.4
T2DM+NPDR 137.4 18.6
T2DM+PDR 144.2 19.5
P VALUE - 0.001 SIGNIFICANT
ANOVA
Chart 15 .Mean systolic BP in three groups
128
137.4
144.2
115 120 125 130 135 140 145 150
T2DM T2DM+NPDR T2DM+PDR
85
Table 18. Mean diastolic BP in three groups
GROUP
DIASTOLIC BP
MEAN SD
T2DM 84.4 10
T2DM+NPDR 86.4 12.2
T2DM+PDR 90.4 17.49
P VALUE - 0.001 SIGNIFICANT
ANOVA
Chart 16 . Mean diastolic BP in three groups
84.4
86.4
90.4
81 82 83 84 85 86 87 88 89 90 91
T2DM T2DM+NPDR T2DM+PDR
86
Table 19. Mean fasting blood sugar in three groups
GROUP
FASTING BLOOD SUGAR
MEAN SD
T2DM 137.46 15.6
T2DM+NPDR 166.06 33.7
T2DM+PDR 186.26 34.22
P VALUE - 0.001 SIGNIFICANT
ANOVA
Chart 17.Mean diastolic blood pressure in three groups
137.46
166.06 186.26
0 20 40 60 80 100 120 140 160 180 200
T2DM T2DM+NPDR T2DM+PDR
87
Table 20. Comparison of mean HbA1c in three groups
GROUP
HBA1C
MEAN SD
T2DM 7.46 0.64
T2DM+NPDR 8.09 0.84
T2DM+PDR 9.13 1.25
P VALUE - 0.001 SIGNIFICANT
ANOVA
Chart 18. Comparison of mean HbA1c in all three groups
0 1 2 3 4 5 6 7 8 9 10
T2DM T2DM+NPDR T2DM+PDR
7.46 8.09
9.13
88
Table 21. Comparison of Total cholesterol in three groups
GROUP TOTAL CHOLESTEROL
MEAN SD
T2DM 213.5 20.49
T2DM+NPDR 219.08 18.08
T2DM+PDR 236.25 26.99
P VALUE - 0.001 SIGNIFICANT
ANOVA
Chart 19. Comparison of mean chlolesterol in all three groups
213.5
219.08
236.25
200 205 210 215 220 225 230 235 240
T2DM T2DM+NPDR T2DM+PDR
89
Table 22. Comparison of mean triglycerides in three groups
GROUP
TRIGLYCERIDES
MEAN SD
T2DM 169.32 20.6
T2DM+NPDR 182.06 19.2
T2DM+PDR 186.68 16.8
P VALUE - 0.001 SIGNIFICANT
ANOVA
Chart 20. Comparison of mean triglycerides in three groups
16
9.
32
18
2.
06
18
6.
68
T 2 D M T 2 D M + N P D R T 2 D M + P D R
90
Table 23. Comparison of mean HDL in three groups
GROUP
HIGH DENSITY LIPOPROTEIN
MEAN SD
T2DM 43.4 8.28
T2DM+NPDR 42.48 9.28
T2DM+PDR 37.72 6.18
P VALUE - 0.001 SIGNIFICANT
ANOVA
Chart 21. Comparison of mean HDL in three groups
37.72
42.48
43.4
34 35 36 37 38 39 40 41 42 43 44
T2DM T2DM+NPDR T2DM+PDR
91
Table 24. Comparison of mean WBC in three groups
GROUP
WHITE BLOOD CELLS
MEAN SD
T2DM 6042 1017
T2DM+NPDR 6546 1425
T2DM+PDR 6490 1496
P VALUE - 0.119 NON SIGNIFICANT
ANOVA
Chart 22. Comparison of mean WBC in three groups
6042
6546
6490
5700 5800 5900 6000 6100 6200 6300 6400 6500 6600
T2DM T2DM+NPDR T2DM+PDR
92
Table 25.Comparison of mean Lymphocyte count in three groups
GROUP
LYMPHOCYTES
MEAN SD
T2DM 2363.2 417
T2DM+NPDR 2342.8 611.52
T2DM+PDR 2250.9 876
P VALUE - 0.567 NON SIGNIFICANT
ANOVA
Chart 23.Comparison of mean lymphocyte count in three groups
2180 2200 2220 2240 2260 2280 2300 2320 2340 2360 2380
T2DM T2DM+NPDR T2DM+PDR
93
Table 26. Comparison of mean neutrophil count in three groups
GROUP
NEUTROPHIL
MEAN SD
T2DM 2824.1 631
T2DM+NPDR 3011.8 886
T2DM+PDR 3140 876
P VALUE - 0.146 NON SIGNIFICANT
ANOVA
Chart 24. Comparison of mean neutrophil count in three groups
28
24
.1
30
11
.8
31
40
T 2 D M T 2 D M + N P D R T 2 D M + P D R
94
Table 27 . Comparison of mean monocyte count in three groups
GROUP
MONOCYTE
MEAN SD
T2DM 334.1 113.69
T2DM+NPDR 442.1 158.4
T2DM+PDR 453.44 171.2
P VALUE - 0.002 SIGNIFICANT
ANOVA
Chart 25. Comparison of mean monocyte count in three groups
334.1
442.1 453.44
0 50 100 150 200 250 300 350 400 450 500
T2DM T2DM+NPDR T2DM+PDR
95
Table 28. Comparison of mean platelet count in three groups
GROUP
PLATELET
MEAN SD
T2DM 211840 29983
T2DM+NPDR 236798 67227
T2DM+PDR 243327 74332
P VALUE - 0.025 SIGNIFICANT
ANOVA
Chart 26. Comparison of mean platelet count in three groups
211840
236798
243327
195000 200000 205000 210000 215000 220000 225000 230000 235000 240000 245000 250000
T2DM T2DM+NPDR T2DM+PDR
96
Table 29.Comparison of NLR in three groups
GROUP
NEUTROPHIL/LYMPHOCYTE
MEAN SD
T2DM 1.17 0.1
T2DM+NPDR 1.32 0.08
T2DM+PDR 1.42 0.08
P VALUE - 0.002 SIGNIFICANT
ANOVA
Chart 27. Comparison of NLR in three groups
1.17
1.32
1.42
0 0.2 0.4 0.6 0.8 1 1.2 1.4 1.6
T2DM T2DM+NPDR T2DM+PDR
97
Table 30. Comparison of MLR in three groups
GROUP
MONOCYTE/LYMPHOCYTE
MEAN SD
T2DM 0.13 0.02
T2DM+NPDR 0.19 0.03
T2DM+PDR 0.195 0.04
P VALUE - 0.001 SIGNIFICANT
ANOVA
Chart 28. Comparison of MLR in three groups
0.13
0.19 0.195
0 0.05 0.1 0.15 0.2 0.25
T2DM T2DM+NPDR T2DM+PDR
98
Table 31. Comparison of PLR in three groups
GROUP
PLATELET/LYMPHOCYTE
MEAN SD
T2DM 91.73 17.29
T2DM+NPDR 102.01 9.31
T2DM+PDR 106.72 8.97
P VALUE - 0.001 SIGNIFICANT
ANOVA
Chart 29. Comparison of PLR in three groups
91.73
102.01
106.72
80 85 90 95 100 105 110
T2DM T2DM+NPDR T2DM+PDR
99
PEARSON CORRELATION WITH RETINOPATHY
FACTORS R VALUE P VALUE
AGE IN YEARS 0.377 0.001
DURATION OF DM 0.065 0.427
SYSTOLIC BP 0.801 0.001
DIASTOLIC BP 0.339 0.029
FASTING BLOOD SUGAR 0.178 0.001
HBA1C 0.567 0.001
TOTAL CHOLESTEROL 0.586 0.466
TRIGLYCERIDES 0.068 0.001
HDL 0.395 0.001
WBC 0.353 0.001
LYMPHOCYTE 0.278 0.095
NEUTROPHIL 0.137 0.316
MONOCYTE 0.082 0.051
PLATELET 0.16 0.042
NEUTROPHIL/LYMPHOCYTE 0.736 0.001
MONOCYTE/LYMPHOCYTE 0.52 0.001
PLATELET/LYMPHOCYTE 0.43 0.001
P VALUE < 0.05 IS SIGNIFICANT AT 95% CI