1
School census results, 2014
This Statistical First Release is based upon information collected by the Schools’ Census in January 2014. It
reports information for the number of pupils by age, gender, free school meal eligibility, ethnicity and
special educational needs, together with information on the number of schools, teachers and support staff.
The tables provide all Wales information for each category listed, plus a breakdown to local authority (LA)
level for schools, pupils, teachers and support staff.
Information on sickness absence of teachers has been incorporated into this release for the first time this
year (see table 19). These figures are not included in the School Census; they are collected directly from
local authorities. They were previously published as part of the ‘Teachers in service, vacancies and sickness
absence’ release, which has now been discontinued following our consultation on the
publication of official
statistics
.
Key results from the January 2014 school census
Schools and pupils (Tables 1-6)
In January 2014 there were 17 nursery, 1,357 primary, 4 middle schools, 213 secondary schools and 42
special schools. Of these, 444 primary, 2 middle and 52 secondary schools were classified as Welsh
medium. There were 70 independent schools, 2 more than in January 2013. Overall, there were 23
fewer LA maintained schools than at January 2013.
The total number of pupils (headcount) in LA maintained nursery, primary, middle, secondary and
special schools was 465,081, a rise of 213 pupils since January 2013.
Chart 1: Number of pupils, by age group, in maintained
schools
0 50,000 100,000 150,000 200,000 250,000
'00 '01 '02 '03 '04 '05 '06 '07 '08 '09 '10 '11 '12 '13 '14
N
u
m
b
e
r
o
f
p
u
p
il
s
Under 5 5 to 10 11 to 15 16 & over
The numbers of pupils aged
11 to 15 increased from 2000
to 2004 and have decreased
year on year since then.
The numbers of pupils aged 5
to 10 have increased to 200,580
in 2014 compared to 195,604 in
2013. Prior to 2011, they had
been decreasing year on year
since 2000.
The numbers of pupils aged
under 5 have been increasing
since 2006.
SDR 111/2014 24 July 2014
Statistician:
Stephen Hughes
Tel:
029 2082 5060
Email:
Teachers and support staff (Tables 7-10)
There were 24,822.5 full-time equivalent (FTE) qualified teachers in LA maintained schools, an
increase of 51.9 over the year.
The pupil teacher ratio for all LA maintained schools was 18.2, unchanged from 2013.
There were 24,354.5 support staff (FTE) in LA maintained schools, an increase of 807.7 staff in the last
year and continuing the trend of recent years. The introduction of the Foundation Phase and the
Teacher Workload Agreement are the two main drivers behind the increase in support staff.
Free school meals (Table 11)
The percentage of pupils of compulsory school age in LA maintained schools known to be eligible for
free school meals in 2014 was 19.1 per cent – down from 19.5 per cent in 2013.
Ethnicity (Table 12)
In LA maintained schools 90.5 per cent of pupils (aged 5 and over) were classified as White British,
8.9 per cent were of minority ethnic origin and 0.6 per cent were unknown or not stated.
Pupils with Special Educational Needs (SEN) (Tables 13-16)
In January 2014 12,530 pupils in maintained schools had statements of SEN, 208 more pupils than in
January 2013.
In primary, maintained schools, 2.7 per cent of pupils had statements of SEN and a further 19.9 per
cent of pupils had special educational needs but no statement.
In the Independent sector 4.5 per cent of pupils had statements of SEN and a further 12.7 per cent of
pupils had special needs but no statement.
Class size (Tables 17 & 18)
6.9 per cent of pupils (7,301) were in infant classes of over 30 pupils, up from 6.6 per cent in January
2013.
Sickness Absence of Teachers (Table 19)
60 per cent of teachers took sickness absence during 2013, compared with 62 per cent during 2012.
Chart 2: Percentage of pupils known to be eligible for free
school meals
0 5 10 15 20 25
'04 '05 '06 '07 '08 '09 '10 '11 '12 '13 '14
%
o
f
e
li
g
ib
le
p
u
p
il
s
All ages Aged 5-15
The percentage of pupils
known to be eligible for free
school meals in primary,
middle, secondary and special
schools has fluctuated over the
last decade, generally
Contents
Page
Schools and Pupils
Table 1
Number of schools, by local authority, January 2014
4
Table 2
Welsh medium schools and pupils, by local authority, January 2014
5
Table 3
Number of pupils, by age group, in maintained schools
5
Table 4
Number of pupils, full-time and part-time, by age and sex, in maintained schools,
January 2014
6
Table 5
Pupil numbers, by local authority, January 2014
7
Table 6
Full-time equivalent pupils, by local authority, January 2014
7
Teachers and support staff
Table 7
Number of qualified teachers, by local authority, January 2014
8
Table 8
Full-time equivalent qualified teachers, by local authority, January 2014
9
Table 9
Pupil teacher ratios within schools, by local authority, January 2014
10
Table 10
Full-time equivalent support staff, by local authority, January 2014
10
Free school meals
Table 11
Pupils known to be eligible for free meals in maintained schools
11
Ethnicity
Table 12
Number of pupils aged 5 or over, by ethnic background, January 2014
12
Pupils with Special Educational Needs (SEN)
Table 13
Pupils with special educational needs in independent schools, by major need,
January 2014
13
Table 14
Pupils with a statement of special educational needs in maintained schools, by
type of school and major need, January 2010-2014
14
Table 15
Pupils with a special educational need but no statement, in maintained schools,
by type of school and major need, January 2010-2014
15
Table 16
All pupils with special educational needs in maintained schools, by type of school
and major need, January 2010-2014
16
Class Size
Table 17
Infant class sizes in primary and middle schools
18
Table 18
Junior class sizes in primary and middle schools
19
Sickness Absence of Teachers
Table 19
Sickness absence of teachers in maintained schools, 1 January - 31 December
20
Schools and Pupils
The local authority with the most schools was Cardiff with 136, and the local authority with the fewest
was Blaenau Gwent and Merthyr Tydfil, both with 29 schools. (
Table 1
)
Gwynedd had the most Welsh medium primary schools with 96, and the local authority with the
fewest was Blaenau Gwent with 1 school. Gwynedd had the most Welsh medium secondary schools
with 13, and there were 4 local authorities with no Welsh medium secondary schools: Merthyr Tydfil,
Blaenau Gwent, Monmouthshire and Newport. (
Table 2
)
Of the pupils aged under 5 in maintained schools in Wales, the majority of them were attending school
on a full time basis. (
Table 4
)
In the ten years to 2010, the total number of pupils in primary schools in Wales had decreased
year-on-year, but there have been increases each year from January 2011, representing the first increase in the
sector since 1998. (
Table 3
)
The number of pupils in each local authority ranged between 8,850 in Merthyr Tydfil, to 54,701 in
Cardiff. (
Table 5
)
The number of full-time equivalent pupils in schools was highest in Cardiff at 52,417.5 pupils and
lowest in Merthyr Tydfil at 8,761.0 pupils. (
Table 6
)
The numbers of pupils aged 5 and under have been increasing since 2006 while those of pupils aged
5-10 have been increasing since 2011. The increase in pupil numbers of these two age groups explain the
recent increase of overall pupil numbers in Wales, reversing the long term downward trend.
Table 1: Number of schools, by local authority, January 2014
Nursery Primary Middle Secondary Special Total Independent All schools
Isle of Anglesey 0 48 0 5 1 54 2 56
Gw ynedd 0 97 0 14 2 113 3 116
Conw y 0 59 0 7 1 67 2 69
Denbighshire 0 47 1 7 2 57 3 60
Flintshire 1 68 0 12 2 83 3 86
Wrexham 1 60 0 9 1 71 3 74
Pow ys 0 86 0 13 3 102 7 109
Ceredigion 0 51 1 6 0 58 1 59
Pembrokeshire 0 61 0 8 1 70 5 75
Carmarthenshire 1 103 0 12 2 118 8 126
Sw ansea 0 80 0 14 2 96 5 101
Neath Port Talbot 0 66 0 11 3 80 0 80
Bridgend 1 49 0 9 2 61 4 65
The Vale of Glamorgan 3 48 0 8 3 62 3 65
Rhondda Cynon Taf 1 110 1 18 4 134 1 135
Merthyr Tydfil 1 23 0 4 1 29 0 29
Caerphilly 0 75 0 14 1 90 1 91
Blaenau Gw ent 0 24 1 3 1 29 0 29
Torfaen 2 29 0 7 1 39 0 39
Monmouthshire 0 31 0 4 1 36 6 42
New port 3 47 0 8 1 59 2 61
Cardiff 3 95 0 20 7 125 11 136
Wales 17 1,357 4 213 42 1,633 70 1,703
Wales – January 2013 20 1,374 4 216 42 1,656 68 1,724
Wales – January 2012 22 1,412 . 221 43 1,698 66 1,764
Wales – January 2011 23 1,435 . 222 43 1,723 66 1,789
Wales – January 2010 25 1,462 . 223 43 1,753 64 1,817
Source: School Census
Table 2: Welsh medium schools and pupils, by local authority, January 2014
Schools Pupils Schools Pupils Schools Pupils
Isle of Anglesey 47 5,363 0 0 4 3,107
Gw ynedd 96 9,719 0 0 13 5,812
Conw y 25 2,305 0 0 2 1,381
Denbighshire 18 2,270 0 0 3 3,035
Flintshire 5 872 0 0 1 489
Wrexham 8 1,534 0 0 1 757
Pow ys 21 2,770 0 0 4 2,286
Ceredigion 45 3,652 1 1,086 5 2,477
Pembrokeshire 19 2,919 0 0 1 1,018
Carmarthenshire 73 9,530 0 0 5 5,699
Sw ansea 11 3,033 0 0 2 1,490
Neath Port Talbot 11 2,175 0 0 1 1,026
Bridgend 4 1,133 0 0 1 556
The Vale of Glamorgan 7 1,720 0 0 1 806
Rhondda Cynon Taf 16 4,830 1 491 3 2,577
Merthyr Tydfil 2 620 0 0 0 0
Caerphilly 11 2,817 0 0 1 1,439
Blaenau Gw ent 1 296 0 0 0 0
Torfaen 3 831 0 0 1 989
Monmouthshire 2 342 0 0 0 0
New port 3 624 0 0 0 0
Cardiff 16 5,011 0 0 3 2,456
Wales 444 64,366 2 1,577 52 37,400
Wales – January 2013 452 63,192 2 1,634 53 37,692
Wales – January 2012 461 62,446 . . 56 41,262
Wales – January 2011 467 61,073 . . 56 41,764
Wales – January 2010 476 60,318 . . 58 43,432
Source: School Census
(a) Primary schools include Welsh Medium, Dual stream and Transitional schools. (b) Include Welsh medium and Bilingual schools.
Primary (a) Middle (b) Secondary (b)
Table 3: Number of pupils, by age group, in maintained schools (a)
2010 2011 2012 2013 2014
Nursery Under 5 1,672 1,572 1,530 1,434 1,353
5 and over 0 0 0 0 0
All ages 1,672 1,572 1,530 1,434 1,353
Primary Under 5 65,421 67,721 69,766 70,262 70,655
5 to 10 191,907 191,359 192,293 193,878 198,726
11 to 15 107 101 76 44 39
16 and over 10 8 9 2 1
All ages 257,445 259,189 262,144 264,186 269,421
Middle Under 5 . . . 238 268
5 to 10 . . . 621 660
11 to 15 . . . 2,343 2,278
16 and over . . . 446 336
All ages . . . 3,648 3,542
Secondary 5 to 10 6 5 19 2 9
11 to 15 173,914 171,142 168,204 162,843 157,831
16 and over 29,987 30,083 29,792 28,434 28,587
All ages 203,907 201,230 198,015 191,279 186,427
Special Under 5 198 217 213 224 238
5 to 10 1,032 1,008 1,062 1,103 1,185
11 to 15 2,116 2,117 2,111 2,070 1,933
16 and over 771 839 868 924 982
All ages 4,117 4,181 4,254 4,321 4,338
Total Under 5 67,291 69,510 71,509 72,158 72,514
5 to 10 192,945 192,372 193,374 195,604 200,580
11 to 15 176,137 173,360 170,391 167,300 162,081
16 and over 30,768 30,930 30,669 29,806 29,906
All ages 467,141 466,172 465,943 464,868 465,081
Source: School Census
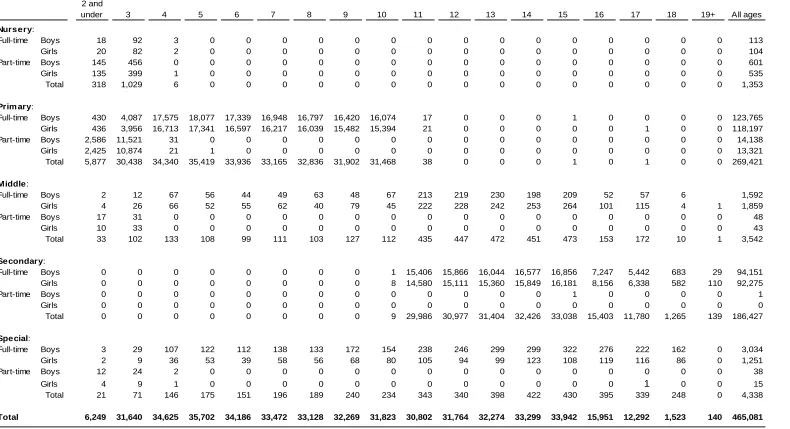
[image:5.595.30.551.444.752.2]Table 4: Number of pupils, full-time and part-time, by age and sex, in maintained schools, January 2014 (a)
2 and
under 3 4 5 6 7 8 9 10 11 12 13 14 15 16 17 18 19+ All ages
Nursery:
Full-time Boys 18 92 3 0 0 0 0 0 0 0 0 0 0 0 0 0 0 0 113
Girls 20 82 2 0 0 0 0 0 0 0 0 0 0 0 0 0 0 0 104
Part-time Boys 145 456 0 0 0 0 0 0 0 0 0 0 0 0 0 0 0 0 601
Girls 135 399 1 0 0 0 0 0 0 0 0 0 0 0 0 0 0 0 535
Total 318 1,029 6 0 0 0 0 0 0 0 0 0 0 0 0 0 0 0 1,353
Prim ary:
Full-time Boys 430 4,087 17,575 18,077 17,339 16,948 16,797 16,420 16,074 17 0 0 0 1 0 0 0 0 123,765
Girls 436 3,956 16,713 17,341 16,597 16,217 16,039 15,482 15,394 21 0 0 0 0 0 1 0 0 118,197
Part-time Boys 2,586 11,521 31 0 0 0 0 0 0 0 0 0 0 0 0 0 0 0 14,138
Girls 2,425 10,874 21 1 0 0 0 0 0 0 0 0 0 0 0 0 0 0 13,321
Total 5,877 30,438 34,340 35,419 33,936 33,165 32,836 31,902 31,468 38 0 0 0 1 0 1 0 0 269,421
Middle:
Full-time Boys 2 12 67 56 44 49 63 48 67 213 219 230 198 209 52 57 6 1,592
Girls 4 26 66 52 55 62 40 79 45 222 228 242 253 264 101 115 4 1 1,859
Part-time Boys 17 31 0 0 0 0 0 0 0 0 0 0 0 0 0 0 0 0 48
Girls 10 33 0 0 0 0 0 0 0 0 0 0 0 0 0 0 0 0 43
Total 33 102 133 108 99 111 103 127 112 435 447 472 451 473 153 172 10 1 3,542
Secondary:
Full-time Boys 0 0 0 0 0 0 0 0 1 15,406 15,866 16,044 16,577 16,856 7,247 5,442 683 29 94,151
Girls 0 0 0 0 0 0 0 0 8 14,580 15,111 15,360 15,849 16,181 8,156 6,338 582 110 92,275
Part-time Boys 0 0 0 0 0 0 0 0 0 0 0 0 0 1 0 0 0 0 1
Girls 0 0 0 0 0 0 0 0 0 0 0 0 0 0 0 0 0 0 0
Total 0 0 0 0 0 0 0 0 9 29,986 30,977 31,404 32,426 33,038 15,403 11,780 1,265 139 186,427
Special:
Full-time Boys 3 29 107 122 112 138 133 172 154 238 246 299 299 322 276 222 162 0 3,034
Girls 2 9 36 53 39 58 56 68 80 105 94 99 123 108 119 116 86 0 1,251
Part-time Boys 12 24 2 0 0 0 0 0 0 0 0 0 0 0 0 0 0 0 38
Girls 4 9 1 0 0 0 0 0 0 0 0 0 0 0 0
1
0 0 15Total 21 71 146 175 151 196 189 240 234 343 340 398 422 430 395 339 248 0 4,338
Total 6,249 31,640 34,625 35,702 34,186 33,472 33,128 32,269 31,823 30,802 31,764 32,274 33,299 33,942 15,951 12,292 1,523 140 465,081
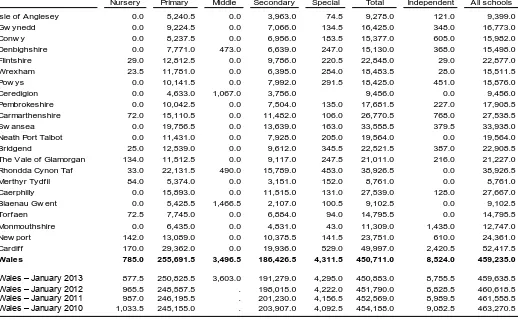
Table 5: Pupil numbers, by local authority, January 2014
Nursery Primary Middle Secondary Special Total Independent All schools
Isle of Anglesey 0 5,550 0 3,963 75 9,588 121 9,709
Gw ynedd 0 9,833 0 7,066 135 17,034 348 17,382
Conw y 0 8,810 0 6,956 184 15,950 605 16,555
Denbighshire 0 8,315 477 6,639 249 15,680 368 16,048
Flintshire 58 13,661 0 9,786 226 23,731 29 23,760
Wrexham 47 12,618 0 6,395 284 19,344 28 19,372
Pow ys 0 10,362 0 7,992 293 18,647 451 19,098
Ceredigion 0 4,782 1086 3,756 0 9,624 0 9,624
Pembrokeshire 0 10,569 0 7,504 135 18,208 227 18,435
Carmarthenshire 72 15,333 0 11,482 106 26,993 768 27,761
Sw ansea 0 21,505 0 13,639 167 35,311 409 35,720
Neath Port Talbot 0 12,450 0 7,928 205 20,583 0 20,583
Bridgend 30 12,675 0 9,612 347 22,664 391 23,055
The Vale of Glamorgan 268 12,272 0 9,117 250 21,907 221 22,128
Rhondda Cynon Taf 33 22,161 491 15,789 483 38,957 0 38,957
Merthyr Tydfil 93 5,454 0 3,151 152 8,850 0 8,850
Caerphilly 0 17,064 0 11,515 131 28,710 128 28,838
Blaenau Gw ent 0 5,863 1488 2,107 101 9,559 0 9,559
Torfaen 132 8,203 0 6,884 95 15,314 0 15,314
Monmouthshire 0 6,670 0 4,831 43 11,544 1,457 13,001
New port 280 13,811 0 10,379 143 24,613 621 25,234
Cardiff 340 31,460 0 19,936 534 52,270 2,431 54,701
Wales 1,353 269,421 3,542 186,427 4,338 465,081 8,603 473,684
Wales – January 2013 1,434 264,186 3,648 191,279 4,321 464,868 8,862 473,730
Wales – January 2012 1,530 262,144 . 198,015 4,254 465,943 8,929 474,872
Wales – January 2011 1,572 259,189 . 201,230 4,181 466,172 9,088 475,260
Wales – January 2010 1,672 257,445 . 203,907 4,117 467,141 9,222 476,363
Source: School Census 0.00046
Table 6: Full-time equivalent pupils, by local authority, January 2014
FTE
Nursery Primary Middle Secondary Special Total Independent All schools
Isle of Anglesey 0.0 5,240.5 0.0 3,963.0 74.5 9,278.0 121.0 9,399.0
Gw ynedd 0.0 9,224.5 0.0 7,066.0 134.5 16,425.0 348.0 16,773.0
Conw y 0.0 8,237.5 0.0 6,956.0 183.5 15,377.0 605.0 15,982.0
Denbighshire 0.0 7,771.0 473.0 6,639.0 247.0 15,130.0 368.0 15,498.0
Flintshire 29.0 12,812.5 0.0 9,786.0 220.5 22,848.0 29.0 22,877.0
Wrexham 23.5 11,781.0 0.0 6,395.0 284.0 18,483.5 28.0 18,511.5
Pow ys 0.0 10,141.5 0.0 7,992.0 291.5 18,425.0 451.0 18,876.0
Ceredigion 0.0 4,633.0 1,067.0 3,756.0 9,456.0 0.0 9,456.0
Pembrokeshire 0.0 10,042.5 0.0 7,504.0 135.0 17,681.5 227.0 17,908.5
Carmarthenshire 72.0 15,110.5 0.0 11,482.0 106.0 26,770.5 768.0 27,538.5
Sw ansea 0.0 19,756.5 0.0 13,639.0 163.0 33,558.5 379.5 33,938.0
Neath Port Talbot 0.0 11,431.0 0.0 7,928.0 205.0 19,564.0 0.0 19,564.0
Bridgend 25.0 12,539.0 0.0 9,612.0 345.5 22,521.5 387.0 22,908.5
The Vale of Glamorgan 134.0 11,512.5 0.0 9,117.0 247.5 21,011.0 216.0 21,227.0
Rhondda Cynon Taf 33.0 22,131.5 490.0 15,789.0 483.0 38,926.5 0.0 38,926.5
Merthyr Tydfil 84.0 5,374.0 0.0 3,151.0 152.0 8,761.0 0.0 8,761.0
Caerphilly 0.0 15,893.0 0.0 11,515.0 131.0 27,539.0 128.0 27,667.0
Blaenau Gw ent 0.0 5,428.5 1,466.5 2,107.0 100.5 9,102.5 0.0 9,102.5
Torfaen 72.5 7,745.0 0.0 6,884.0 94.0 14,795.5 0.0 14,795.5
Monmouthshire 0.0 6,435.0 0.0 4,831.0 43.0 11,309.0 1,438.0 12,747.0
New port 142.0 13,089.0 0.0 10,378.5 141.5 23,751.0 610.0 24,361.0
Cardiff 170.0 29,362.0 0.0 19,936.0 529.0 49,997.0 2,420.5 52,417.5
Wales 785.0 255,691.5 3,496.5 186,426.5 4,311.5 450,711.0 8,524.0 459,235.0
Wales – January 2013 877.5 250,828.5 3,603.0 191,279.0 4,295.0 450,883.0 8,755.5 459,638.5
Wales – January 2012 965.5 248,587.5 . 198,015.0 4,222.0 451,790.0 8,828.5 460,618.5
Wales – January 2011 987.0 246,195.5 . 201,230.0 4,156.5 452,569.0 8,989.5 461,558.5
Wales – January 2010 1,033.5 245,155.0 . 203,907.0 4,092.5 454,188.0 9,082.5 463,270.5
Teachers and support staff
The number of teachers in maintained schools in each local authority ranged between 3,030 in Cardiff,
to 505 in Merthyr Tydfil. (
Table 7
)
The number of full-time equivalent qualified teachers in maintained schools was highest in Cardiff at
2,735.7 teachers and lowest in Merthyr Tydfil at 485.9 teachers. (
Table 8
)
Ceredigion had the lowest primary pupil teacher ratio at 17.1, and Torfaen had the highest at 23.6. The
lowest secondary pupil teacher ratio was also in Ceredigion at 14.1, and the highest was in Newport at
17.2. (
Table 9
)
The pupil teacher ratio is highest in primary schools at 20.8 and lowest in special schools at 6.5. (
Table 9
)
The number of full-time equivalent support staff in maintained schools was highest in Cardiff at
2,542.8 support staff, and lowest in Merthyr Tydfil at 450.9 support staff. (
Table 10
)
The introduction of the Foundation Phase and the Teacher Workload Agreement are the two main
drivers behind the increase in support staff. (
Table 10
)
Table 7: Number of qualified teachers, by local authority, January 2014
Nursery Primary Middle Secondary Special Total
Isle of Anglesey 0 289 0 262 12 563
Gw ynedd 0 536 0 520 21 1,077
Conw y 0 486 0 480 30 996
Denbighshire 0 442 34 433 37 946
Flintshire 2 690 0 666 35 1,393
Wrexham 3 666 0 422 30 1,121
Pow ys 0 614 0 562 53 1,229
Ceredigion 0 313 75 289 0 677
Pembrokeshire 0 559 0 473 22 1,054
Carmarthenshire 4 859 0 768 24 1,655
Sw ansea 0 1041 0 876 31 1,948
Neath Port Talbot 0 611 0 522 38 1,171
Bridgend 3 594 0 656 51 1,304
The Vale of Glamorgan 10 647 0 599 56 1,312
Rhondda Cynon Taf 4 1033 36 1029 66 2,168
Merthyr Tydfil 4 287 0 196 18 505
Caerphilly 0 758 0 755 24 1,537
Blaenau Gw ent 0 300 91 131 14 536
Torfaen 4 351 0 431 14 800
Monmouthshire 0 334 0 334 13 681
New port 6 675 0 653 27 1,361
Cardiff 19 1585 0 1321 105 3,030
Wales 59 13,670 236 12,378 721 27,064
Wales – January 2013 67 13,533 239 12,519 698 27,056
Wales – January 2012 73 13,451 . 12,651 694 26,869
Wales – January 2011 72 13,399 . 12,935 702 27,108
Wales – January 2010 78 13,582 . 13,102 673 27,435
Source: School Census
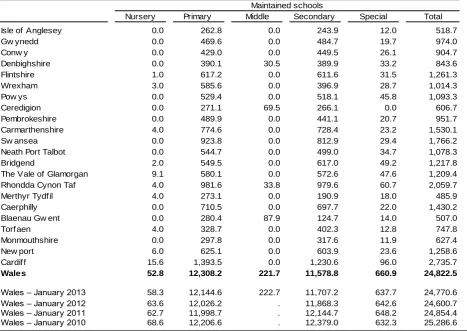
Table 8: Full-time equivalent qualified teachers, by local authority, January 2014
FTE
Nursery Primary Middle Secondary Special Total
Isle of Anglesey 0.0 262.8 0.0 243.9 12.0 518.7
Gw ynedd 0.0 469.6 0.0 484.7 19.7 974.0
Conw y 0.0 429.0 0.0 449.5 26.1 904.7
Denbighshire 0.0 390.1 30.5 389.9 33.2 843.6
Flintshire 1.0 617.2 0.0 611.6 31.5 1,261.3
Wrexham 3.0 585.6 0.0 396.9 28.7 1,014.3
Pow ys 0.0 529.4 0.0 518.1 45.8 1,093.3
Ceredigion 0.0 271.1 69.5 266.1 0.0 606.7
Pembrokeshire 0.0 489.9 0.0 441.1 20.7 951.7
Carmarthenshire 4.0 774.6 0.0 728.4 23.2 1,530.1
Sw ansea 0.0 923.8 0.0 812.9 29.4 1,766.2
Neath Port Talbot 0.0 544.7 0.0 499.0 34.7 1,078.3
Bridgend 2.0 549.5 0.0 617.0 49.2 1,217.8
The Vale of Glamorgan 9.1 580.1 0.0 572.6 47.6 1,209.4
Rhondda Cynon Taf 4.0 981.6 33.8 979.6 60.7 2,059.7
Merthyr Tydfil 4.0 273.1 0.0 190.9 18.0 485.9
Caerphilly 0.0 710.5 0.0 697.7 22.0 1,430.2
Blaenau Gw ent 0.0 280.4 87.9 124.7 14.0 507.0
Torfaen 4.0 328.7 0.0 402.3 12.8 747.8
Monmouthshire 0.0 297.8 0.0 317.6 11.9 627.4
New port 6.0 625.1 0.0 603.9 23.6 1,258.6
Cardiff 15.6 1,393.5 0.0 1,230.6 96.0 2,735.7
Wales 52.8 12,308.2 221.7 11,578.8 660.9 24,822.5
Wales – January 2013 58.3 12,144.6 222.7 11,707.2 637.7 24,770.6
Wales – January 2012 63.6 12,026.2 . 11,868.3 642.6 24,600.7
Wales – January 2011 62.7 11,998.7 . 12,144.7 648.2 24,854.4
Wales – January 2010 68.6 12,206.6 . 12,379.0 632.3 25,286.6
Source: School Census
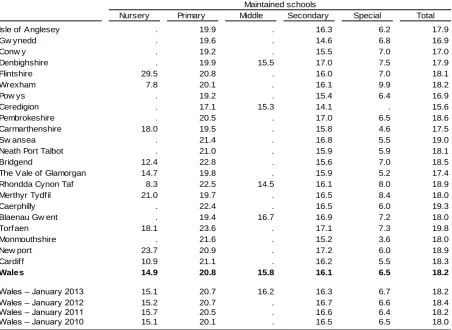
Table 9: Pupil teacher ratios within schools, by local authority, January 2014
Nursery Primary Middle Secondary Special Total
Isle of Anglesey . 19.9 . 16.3 6.2 17.9
Gw ynedd . 19.6 . 14.6 6.8 16.9
Conw y . 19.2 . 15.5 7.0 17.0
Denbighshire . 19.9 15.5 17.0 7.5 17.9
Flintshire 29.5 20.8 . 16.0 7.0 18.1
Wrexham 7.8 20.1 . 16.1 9.9 18.2
Pow ys . 19.2 . 15.4 6.4 16.9
Ceredigion . 17.1 15.3 14.1 . 15.6
Pembrokeshire . 20.5 . 17.0 6.5 18.6
Carmarthenshire 18.0 19.5 . 15.8 4.6 17.5
Sw ansea . 21.4 . 16.8 5.5 19.0
Neath Port Talbot . 21.0 . 15.9 5.9 18.1
Bridgend 12.4 22.8 . 15.6 7.0 18.5
The Vale of Glamorgan 14.7 19.8 . 15.9 5.2 17.4
Rhondda Cynon Taf 8.3 22.5 14.5 16.1 8.0 18.9
Merthyr Tydfil 21.0 19.7 . 16.5 8.4 18.0
Caerphilly . 22.4 . 16.5 6.0 19.3
Blaenau Gw ent . 19.4 16.7 16.9 7.2 18.0
Torfaen 18.1 23.6 . 17.1 7.3 19.8
Monmouthshire . 21.6 . 15.2 3.6 18.0
New port 23.7 20.9 . 17.2 6.0 18.9
Cardiff 10.9 21.1 . 16.2 5.5 18.3
Wales 14.9 20.8 15.8 16.1 6.5 18.2
Wales – January 2013 15.1 20.7 16.2 16.3 6.7 18.2
Wales – January 2012 15.2 20.7 . 16.7 6.6 18.4
Wales – January 2011 15.7 20.5 . 16.6 6.4 18.2
Wales – January 2010 15.1 20.1 . 16.5 6.5 18.0
Source: School Census
Maintained schools
Table 10: Full-time equivalent support staff, by local authority, January 2014
FTE
Nursery Primary Middle Secondary Special Total
Isle of Anglesey 0.0 268.0 0.0 189.6 28.4 486.1
Gw ynedd 0.0 504.6 0.0 245.6 48.2 798.4
Conw y 0.0 397.4 0.0 241.6 73.6 712.6
Denbighshire 0.0 495.1 18.5 281.0 100.2 894.8
Flintshire 3.5 764.0 0.0 328.9 79.2 1,175.5
Wrexham 7.4 781.9 0.0 258.8 140.6 1,188.6
Pow ys 0.0 555.6 0.0 278.9 118.5 953.0
Ceredigion 0.0 311.1 55.0 204.9 0.0 571.0
Pembrokeshire 0.0 822.5 0.0 334.5 84.6 1,241.6
Carmarthenshire 7.0 991.1 0.0 562.5 46.5 1,607.1
Sw ansea 0.0 1,278.8 0.0 616.9 96.4 1,992.2
Neath Port Talbot 0.0 653.1 0.0 253.6 92.5 999.2
Bridgend 4.0 716.4 0.0 297.0 277.9 1,295.2
The Vale of Glamorgan 19.4 555.7 0.0 297.1 149.0 1,021.2
Rhondda Cynon Taf 6.0 1,213.9 19.5 494.4 155.0 1,888.7
Merthyr Tydfil 7.0 294.6 0.0 89.2 60.1 450.9
Caerphilly 0.0 874.8 0.0 403.7 68.8 1,347.3
Blaenau Gw ent 0.0 354.9 60.4 70.4 66.8 552.6
Torfaen 8.5 483.1 0.0 258.1 55.0 804.7
Monmouthshire 0.0 390.7 0.0 170.1 36.4 597.2
New port 18.3 757.7 0.0 391.0 66.6 1,233.6
Cardiff 22.9 1,630.1 0.0 713.0 176.8 2,542.8
Wales 104.0 15,095.2 153.4 6,980.8 2,021.1 24,354.5
Wales – January 2013 115.2 14,675.2 144.6 6,767.6 1,844.2 23,546.8
Wales – January 2012 123.4 13,703.7 . 6,714.0 1,753.4 22,294.5
Wales – January 2011 125.1 12,850.2 . 6,653.2 1,692.0 21,320.5
[image:10.595.31.554.444.769.2]Free school meals (FSM)
The number of pupils eligible for free meals has decreased from 83,498 pupils in January 2013 to
81,538 pupils in January 2014.
Between 2008 and 2011, the percentage of compulsory aged school pupils known to be eligible for
free meals has increased year on year but has fluctuated slightly since 2011. The overall increasing trend
may be related to that seen in the number of claimants of Jobseeker’s Allowance in Wales, which is one
of the criteria for eligibility for free meals (more information can be seen in the Key Quality Information
at the back of this release).
The percentage of pupils known to be eligible for free meals was highest in special schools at 42.3 per
cent. (
Table 11
)
Table 11: Pupils known to be eligible for free meals in maintained schools (a)
Per Per Per Per Per Per
Number Cent Number Cent Number Cent Number Cent Number Cent Number Cent
All pupils:
2010 159 9.5 47,212 18.3 . . 31,737 15.6 1,641 39.9 80,749 17.3
2011 143 9.1 50,560 19.5 . . 32,314 16.1 1,789 42.8 84,806 18.2
2012 133 8.7 49,391 18.8 . . 31,276 15.8 1,743 41.0 82,543 17.7
2013 106 7.4 50,056 18.9 557 15.3 30,962 16.2 1,817 42.1 83,498 18.0
2014 81 6.0 49,315 18.3 577 16.3 29,730 15.9 1,835 42.3 81,538 17.5
Aged 5-15:
2010 . . 38,665 20.1 . . 29,805 17.1 1,321 42.0 69,791 18.9
2011 . . 40,422 21.1 . . 30,247 17.7 1,404 44.9 72,073 19.7
2012 . . 39,656 20.6 . . 29,252 17.4 1,357 42.8 70,265 19.3
2013 . . 40,135 20.7 508 17.1 28,835 17.7 1,415 44.6 70,893 19.5
2014 . . 39,881 20.1 534 18.2 27,589 17.5 1,414 45.3 69,418 19.1
Source: School Census (a) At January each year.
Ethnicity
Of the total number of pupils aged 5 or over at primary, middle, secondary and special schools in
Wales, over 9 in 10 pupils were classed as White British.
The percentage of pupils whose ethnic background was classified as minority ethnic origin was slightly
higher in primary schools than in middle, secondary or special schools.
Of the pupils whose ethnic background was classified as Black, 81.6 per cent of them were classified
as Black African.
Of the pupils whose ethnic background was classified as Asian, 21.0 per cent of them were classified
as Indian, 33.0 per cent as Pakistani, and 35.2 per cent as Bangladeshi.
(Table 12)
Table 12: Number of pupils aged 5 or over, by ethnic background, January 2014
Per Per Per Per Per
cent cent cent cent cent
Ethnic background Number (a) Number (a) Number (a) Number (a) Number (a)
White 373,478 93.4 369,760 93.2 367,176 93.1 365,356 93.0 364,260 92.8
White British 367,242 91.8 362,845 91.5 359,629 91.2 357,156 90.9 355,085 90.5
Traveller 254 0.1 288 0.1 323 0.1 345 0.1 346 0.1
Gypsy/ Roma 416 0.1 451 0.1 496 0.1 516 0.1 545 0.1
Any other White background 5,566 1.4 6,176 1.6 6,728 1.7 7,339 1.9 8,284 2.1
Mixed 7,570 1.9 8,025 2.0 8,420 2.1 8,808 2.2 9,337 2.4
White and Black Caribbean 1,952 0.5 2,019 0.5 2,046 0.5 2,082 0.5 2,172 0.6
White and Black African 837 0.2 909 0.2 979 0.2 1,052 0.3 1,120 0.3
White and Asian 1,777 0.4 1,857 0.5 1,958 0.5 2,016 0.5 2,115 0.5
Any other mixed background 3,004 0.8 3,240 0.8 3,437 0.9 3,658 0.9 3,930 1.0
Asian 7,225 1.8 7,573 1.9 7,971 2.0 8,276 2.1 8,696 2.2
Indian 1,495 0.4 1,543 0.4 1,634 0.4 1,731 0.4 1,830 0.5
Pakistani 2,376 0.6 2,472 0.6 2,630 0.7 2,704 0.7 2,866 0.7
Bangladeshi 2,569 0.6 2,703 0.7 2,816 0.7 2,933 0.7 3,064 0.8
Any other Asian background 785 0.2 855 0.2 891 0.2 908 0.2 936 0.2
Black 2,381 0.6 2,575 0.6 2,778 0.7 2,875 0.7 3,005 0.8
Black Caribbean 203 0.1 206 0.1 208 0.1 201 0.1 194 0.0
Black African 1,848 0.5 2,028 0.5 2,225 0.6 2,308 0.6 2,452 0.6
Any other Black background 330 0.1 341 0.1 345 0.1 366 0.1 359 0.1
Chinese 668 0.2 660 0.2 659 0.2 667 0.2 680 0.2
Any other ethnic group 3,250 0.8 3,567 0.9 3,863 1.0 3,951 1.0 4,145 1.1
Total w ith valid category 394,572 98.7 392,164 98.9 390,867 99.1 389,933 99.3 390,123 99.4
Unknow n or not stated 5,278 1.3 4,502 1.1 3,567 0.9 2,777 0.7 2,444 0.6
All pupils 399,850 100.0 396,662 100.0 394,434 100.0 392,710 100.0 392,567 100.0
Source: School Census
(a) Of all pupils aged 5 or over.
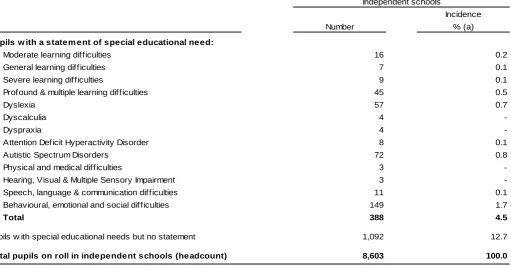
Special educational needs (SEN)
17.2 per cent of pupils at independent schools have some form of special educational need; 26.2 per
cent of these pupils with SEN have statements of SEN. Of the pupils with statements of special
educational needs, 38.4 per cent had behavioural, emotional and social difficulties as their major need,
18.6 per cent of pupils had autistic spectrum disorders and 14.7 per cent of pupils had dyslexia as their
major need. (
Table 13
)
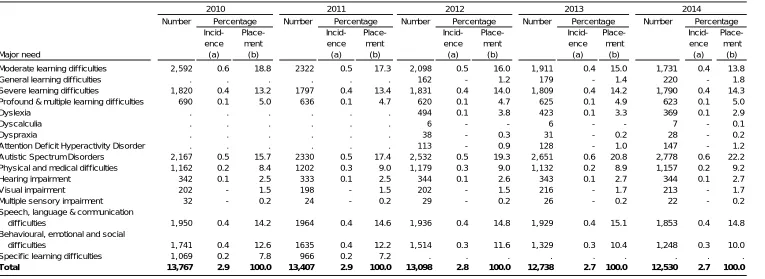
22.6 per cent of all pupils at maintained schools in Wales have some form of special educational need;
11.9 per cent of the pupils with special educational needs have statements of SEN.
(Table 14)
[image:13.595.42.554.273.539.2]Of the pupils with special educational needs, the most common major need was general learning
difficulties, representing 23.6 per cent of pupils with some form of SEN.
(Table 14 & Table 15)
Table 13: Pupils with special educational needs in independent schools, by major need, January
2014
Incidence
Number % (a)
Pupils w ith a statem ent of special educational need:
Moderate learning difficulties 16 0.2
General learning difficulties 7 0.1
Severe learning difficulties 9 0.1
Profound & multiple learning difficulties 45 0.5
Dyslexia 57 0.7
Dyscalculia 4
-Dyspraxia 4
-Attention Deficit Hyperactivity Disorder 8 0.1
Autistic Spectrum Disorders 72 0.8
Physical and medical difficulties 3
-Hearing, Visual & Multiple Sensory Impairment 3
-Speech, language & communication difficulties 11 0.1
Behavioural, emotional and social difficulties 149 1.7
Total 388 4.5
Pupils w ith special educational needs but no statement 1,092 12.7
Total pupils on roll in independent schools (headcount) 8,603 100.0
Source: School Census
Table 14: Pupils with a statement of special educational needs in maintained schools, by major need, January 2010 - 2014
Number Number Number Number Number
Incid- Place- Incid- Place- Incid- Place- Incid- Place- Incid-
Place-ence ment ence ment ence ment ence ment ence ment
Major need (a) (b) (a) (b) (a) (b) (a) (b) (a) (b)
Moderate learning difficulties 2,592 0.6 18.8 2322 0.5 17.3 2,098 0.5 16.0 1,911 0.4 15.0 1,731 0.4 13.8
General learning difficulties . . . 162 - 1.2 179 - 1.4 220 - 1.8
Severe learning difficulties 1,820 0.4 13.2 1797 0.4 13.4 1,831 0.4 14.0 1,809 0.4 14.2 1,790 0.4 14.3
Profound & multiple learning difficulties 690 0.1 5.0 636 0.1 4.7 620 0.1 4.7 625 0.1 4.9 623 0.1 5.0
Dyslexia . . . 494 0.1 3.8 423 0.1 3.3 369 0.1 2.9
Dyscalculia . . . 6 - - 6 - - 7 - 0.1
Dyspraxia . . . 38 - 0.3 31 - 0.2 28 - 0.2
Attention Deficit Hyperactivity Disorder . . . 113 - 0.9 128 - 1.0 147 - 1.2
Autistic Spectrum Disorders 2,167 0.5 15.7 2330 0.5 17.4 2,532 0.5 19.3 2,651 0.6 20.8 2,778 0.6 22.2
Physical and medical difficulties 1,162 0.2 8.4 1202 0.3 9.0 1,179 0.3 9.0 1,132 0.2 8.9 1,157 0.2 9.2
Hearing impairment 342 0.1 2.5 333 0.1 2.5 344 0.1 2.6 343 0.1 2.7 344 0.1 2.7
Visual impairment 202 - 1.5 198 - 1.5 202 - 1.5 216 - 1.7 213 - 1.7
Multiple sensory impairment 32 - 0.2 24 - 0.2 29 - 0.2 26 - 0.2 22 - 0.2
Speech, language & communication
difficulties 1,950 0.4 14.2 1964 0.4 14.6 1,936 0.4 14.8 1,929 0.4 15.1 1,853 0.4 14.8
Behavioural, emotional and social
difficulties 1,741 0.4 12.6 1635 0.4 12.2 1,514 0.3 11.6 1,329 0.3 10.4 1,248 0.3 10.0
Specific learning difficulties 1,069 0.2 7.8 966 0.2 7.2 . . . .
Total 13,767 2.9 100.0 13,407 2.9 100.0 13,098 2.8 100.0 12,738 2.7 100.0 12,530 2.7 100.0
Source: School Census
(a) Incidence - the number of pupils expressed as a proportion of the total number of pupils on roll in maintained schools.
(b) Placement - the number of pupils expressed as a proportion of the total number of pupils w ithin each SEN grouping in maintained schools.
e.g. Number of pupils w ith a statement of SEN of moderate learning difficulties divided by the total number of pupils w ith a statement of SEN in maintained schools.
Percentage Percentage Percentage Percentage
2010 2011 2012 2013
Table 15: Pupils with a special educational need but no statement, in maintained schools, by major need, January 2010-2014
Number Number Number Number Number
Incid- Place- Incid- Place- Incid- Place- Incid- Place- Incid-
Place-ence ment ence ment ence ment ence ment ence ment
Major need (a) (b) (a) (b) (a) (b) (a) (b) (a) (b)
Moderate learning difficulties 41,943 9.0 49.2 42179 9.0 48.7 31,999 6.9 35.6 27,338 5.9 30.0 23,077 5.0 24.9
General learning difficulties . . . 16,706 3.6 18.6 20,855 4.5 22.9 24,670 5.3 26.6
Severe learning difficulties 622 0.1 0.7 622 0.1 0.7 625 0.1 0.7 654 0.1 0.7 549 0.1 0.6
Profound & multiple learning difficulties 83 - 0.1 68 - 0.1 109 - 0.1 150 - 0.2 152 - 0.2
Dyslexia . . . 8,810 1.9 9.8 8,738 1.9 9.6 8,609 1.9 9.3
Dyscalculia . . . 414 0.1 0.5 476 0.1 0.5 616 0.1 0.7
Dyspraxia . . . 459 0.1 0.5 506 0.1 0.6 546 0.1 0.6
Attention Deficit Hyperactivity Disorder . . . 688 0.1 0.8 858 0.2 0.9 1,020 0.2 1.1
Autistic Spectrum Disorders 955 0.2 1.1 1121 0.2 1.3 1,436 0.3 1.6 1,576 0.3 1.7 1,814 0.4 2.0
Physical and medical difficulties 2,864 0.6 3.4 2900 0.6 3.4 3,088 0.7 3.4 3,200 0.7 3.5 3,280 0.7 3.5
Hearing impairment 1,305 0.3 1.5 1380 0.3 1.6 1,588 0.3 1.8 1,738 0.4 1.9 1,805 0.4 1.9
Visual impairment 571 0.1 0.7 614 0.1 0.7 621 0.1 0.7 629 0.1 0.7 649 0.1 0.7
Multiple sensory impairment 42 - - 40 - - 35 - - 40 - - 35 -
-Speech, language & communication
difficulties 9,800 2.1 11.5 10300 2.2 11.9 11,308 2.4 12.6 12,011 2.6 13.2 12,827 2.8 13.8
Behavioural, emotional and social
difficulties 11,308 2.4 13.3 11611 2.5 13.4 12,054 2.6 13.4 12,284 2.6 13.5 13,124 2.8 14.1
Specific learning difficulties 15,744 3.4 18.5 15688 3.4 18.1 . . . .
Total 85,237 18.2 100.0 86,523 18.6 100.0 89,940 19.3 100.0 91,053 19.6 100.0 92,773 19.9 100.0
Source: School Census
(a) Incidence - the number of pupils expressed as a proportion of the total number of pupils on roll in maintained schools.
(b) Placement - the number of pupils expressed as a proportion of the total number of pupils w ithin each SEN grouping in maintained schools.
e.g. Number of pupils w ith a statement of SEN of moderate learning difficulties divided by the total number of pupils w ith a statement of SEN in maintained schools.
2010 2011 2012 2013
Percentage Percentage Percentage Percentage Percentage
Table 16: All pupils with special educational needs in maintained schools, by major need, January 2010-2014
Number Number Number Number Number
Incid- Place- Incid- Place- Incid- Place- Incid- Place- Incid-
Place-ence ment ence ment ence ment ence ment ence ment
Major need (a) (b) (a) (b) (a) (b) (a) (b) (a) (b)
Moderate learning difficulties 44,535 9.5 42.3 44,501 9.5 44.5 34,097 7.3 33.1 29,249 6.3 28.2 24,808 5.3 23.6
General learning difficulties . . . 16,868 3.6 16.4 21,034 4.5 20.3 24,890 5.4 23.6
Severe learning difficulties 2,442 0.5 2.3 2,419 0.5 2.4 2,456 0.5 2.4 2,463 0.5 2.4 2,339 0.5 2.2
Profound & multiple learning difficulties 773 0.2 0.7 704 0.2 0.7 729 0.2 0.7 775 0.2 0.7 775 0.2 0.7
Dyslexia . . . 9,304 2.0 9.0 9,161 2.0 8.8 8,978 1.9 8.5
Dyscalculia . . . 420 0.1 0.4 482 0.1 0.5 623 0.1 0.6
Dyspraxia . . . 497 0.1 0.5 537 0.1 0.5 574 0.1 0.5
Attention Deficit Hyperactivity Disorder . . . 801 0.2 0.8 986 0.2 0.9 1,167 0.3 1.1
Autistic Spectrum Disorders 3,122 0.7 3.0 3,451 0.7 3.5 3,968 0.9 3.9 4,227 0.9 4.1 4,592 1.0 4.4
Physical and medical difficulties 4,026 0.9 3.8 4,102 0.9 4.1 4,267 0.9 4.1 4,332 0.9 4.2 4,437 1.0 4.2
Hearing impairment 1,647 0.4 1.6 1,713 0.4 1.7 1,932 0.4 1.9 2,081 0.4 2.0 2,149 0.5 2.0
Visual impairment 773 0.2 0.7 812 0.2 0.8 823 0.2 0.8 845 0.2 0.8 862 0.2 0.8
Multiple sensory impairment 74 - 0.1 64 - 0.1 64 - 0.1 66 - 0.1 57 - 0.1
Speech, language & communication
difficulties 11,750 2.5 11.2 12,264 2.6 12.3 13,244 2.8 12.9 13,940 3.0 13.4 14,680 3.2 13.9
Behavioural, emotional and social
difficulties 13,049 2.8 12.4 13,246 2.8 13.3 13,568 2.9 13.2 13,613 2.9 13.1 14,372 3.1 13.6
Specific learning difficulties 16,813 3.6 16.0 16,654 3.6 16.7 . . . .
Total 99,004 21.2 100.0 99,930 21.4 100.0 103,038 22.1 100.0 103,791 22.3 100.0 105,303 22.6 100.0
Total num ber of pupils on roll 467,141 466,172 465,943 464,868 465,081
Source: School Census
(a) Incidence - the number of pupils expressed as a proportion of the total number of pupils on roll in maintained schools.
(b) Placement - the number of pupils expressed as a proportion of the total number of pupils w ithin each SEN grouping in maintained schools.
e.g. Number of pupils w ith a statement of SEN of moderate learning difficulties divided by the total number of pupils w ith a statement of SEN in maintained schools.
Percentage Percentage Percentage Percentage
2010 2011 2012 2013
Class sizes
The January 2013 PLASC count was the first time class size data has been collected from schools,
replacing the annual local authority collection in September. The timing of these different collections is
significant here as the January pupil cohort would be greater than the September one. Care should be
taken when comparing data from these two collections.
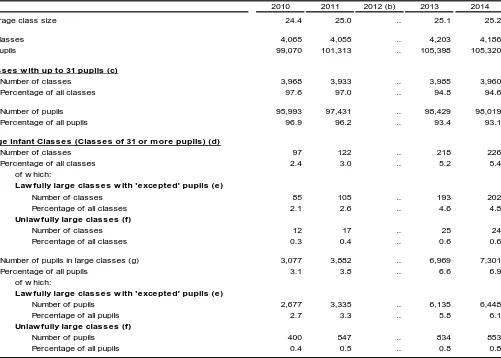
6.9 per cent of pupils (7,301) were in infant classes of over 30 pupils, up from 6.6 per cent in January
2013. (
Table 17
)
226 infant classes (5.4 per cent) in Wales had more than 30 pupils, with 202 of these classes having
permissible exceptions. This is more than at January 2013 when 218 classes (5.2 per cent) had over 30
pupils, of which 193 had permissible exceptions. (
Table 17
)
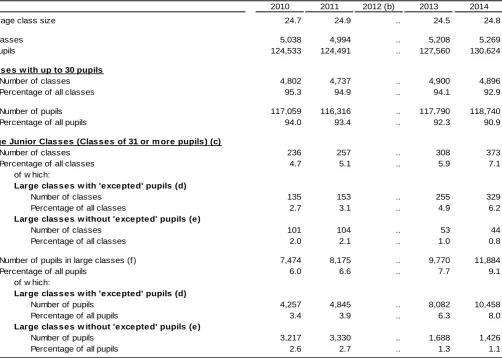
7.1 per cent of Key Stage 2 classes (373) were regarded as large classes and had a total of 11,884 pupils
(9.1 per cent of all pupils). This is more than at January 2013 when 308 classes (5.9 per cent) were
considered large and they had a total of 9,770 pupils (7.7 percent of all pupils).
(Table 18)
Table 17: Infant class sizes in primary and middle schools (a)
2010 2011 2012 (b) 2013 2014
24.4 25.0 .. 25.1 25.2
4,065 4,055 .. 4,203 4,186
99,070 101,313 .. 105,398 105,320
3,968 3,933 .. 3,985 3,960
97.6 97.0 .. 94.8 94.6
95,993 97,431 .. 98,429 98,019
96.9 96.2 .. 93.4 93.1
97 122 .. 218 226
2.4 3.0 .. 5.2 5.4
Number of classes 85 105 .. 193 202
Percentage of all classes 2.1 2.6 .. 4.6 4.8
Number of classes 12 17 .. 25 24
Percentage of all classes 0.3 0.4 .. 0.6 0.6
3,077 3,882 .. 6,969 7,301
3.1 3.8 .. 6.6 6.9
Number of pupils 2,677 3,335 .. 6,135 6,448
Percentage of all pupils 2.7 3.3 .. 5.8 6.1
Number of pupils 400 547 .. 834 853
Percentage of all pupils 0.4 0.5 .. 0.8 0.8
Source: School Census (a)
(b) No data collection in September 2012. (c)
(d)
(e)
(f) Classes of 31 or more, excluding those large classes engaged in an excepted activity. (g) Includes all pupils in large classes, including those w ith excepted activity.
At January each year. At September each year prior to 2013. Class sizes prior to 2012 relate to Key Stage 1 w hereas those after 2012 relate to Foundation Phase. Includes Middle schools from 2013.
Law fully large classes w ith 'excepted' pupils (e)
Unlaw fully large classes (f)
Number of pupils in large classes (g) Percentage of all pupils
Both infant and junior classes w ith one teacher are allow ed to have more than 30 children in very specific circumstances. These are called exceptions. Exception categories for infant classes are defined in the Schedule to the Education (Infant Class Sizes) (Wales) Regulations 1998, as amended by the Education (Infant Class Sizes) (Wales) (Amendment) Regulations 2009. Exception categories for junior classes are not set out in regulations but are enforced as part of the data collection.
Includes only those classes w here there are pupils w ho have been admitted as exceptions making the class size w ithin the legal limit of 30 pupils or less.
of w hich:
Law fully large classes w ith 'excepted' pupils (e)
Unlaw fully large classes (f)
The Schools Standards and Framew ork Act 1998 and associated regulations placed a statutory duty on local authorities and governing bodies to limit the size of Reception classes to 30 from 1999; Reception and Year 1 classes from 2000 and Reception, Year 1 and Year 2 from 2001. Mixed year or mixed Key Stage classes are subject to the limit, w here the majority of the class is made up of pupils in the appropriate year groups; this includes mixed nursery/reception classes. In this table, w here a class has more than one teacher the number of pupils divided by the number of teachers determines if the size is over 30.
Number of pupils Percentage of all pupils
Large Infant Classes (Classes of 31 or m ore pupils) (d)
Number of classes Percentage of all classes
of w hich: Average class size
All classes All pupils
Classes w ith up to 31 pupils (c)
Table 18: Junior class sizes in primary and middle schools (a)
2010 2011 2012 (b) 2013 2014
24.7 24.9 .. 24.5 24.8
5,038 4,994 .. 5,208 5,269
124,533 124,491 .. 127,560 130,624
4,802 4,737 .. 4,900 4,896
95.3 94.9 .. 94.1 92.9
117,059 116,316 .. 117,790 118,740
94.0 93.4 .. 92.3 90.9
236 257 .. 308 373
4.7 5.1 .. 5.9 7.1
Number of classes 135 153 .. 255 329
Percentage of all classes 2.7 3.1 .. 4.9 6.2
Number of classes 101 104 .. 53 44
Percentage of all classes 2.0 2.1 .. 1.0 0.8
7,474 8,175 .. 9,770 11,884
6.0 6.6 .. 7.7 9.1
Number of pupils 4,257 4,845 .. 8,082 10,458
Percentage of all pupils 3.4 3.9 .. 6.3 8.0
Number of pupils 3,217 3,330 .. 1,688 1,426
Percentage of all pupils 2.6 2.7 .. 1.3 1.1
Source: School Census
(a) At January each year. At September each year prior to 2013. Includes Middle schools from 2013. (b) No data collection in September 2012.
(c)
(d)
(e) Classes of 31 or more, excluding those large classes engaged in an excepted activity. (f) Includes all pupils in large classes, including those w ith excepted activity.
Large classes w ith 'excepted' pupils (d)
Large classes w ithout 'excepted' pupils (e)
Number of pupils in large classes (f) Percentage of all pupils
Includes only those classes w here there are pupils w ho have been admitted as exceptions making the class size w ithin the legal limit of 30 pupils or less.
of w hich:
Large classes w ith 'excepted' pupils (d)
Large classes w ithout 'excepted' pupils (e)
Both infant and junior classes w ith one teacher are allow ed to have more than 30 children in very specific circumstances. These are called exceptions. Exception categories for infant classes are defined in the Schedule to the Education (Infant Class Sizes) (Wales) Regulations 1998, as amended by the Education (Infant Class Sizes) (Wales) (Amendment) Regulations 2009. Exception categories for junior classes are not set out in regulations but are enforced as part of the data collection. In this table, w here a class has more than one teacher the number of pupils divided by the number of teachers determines if the size is over 30. Number of pupils
Percentage of all pupils
Large Junior Classes (Classes of 31 or m ore pupils) (c)
Number of classes Percentage of all classes
of w hich: Average class size
All classes All pupils
Classes w ith up to 30 pupils
Sickness absence of teachers
60 per cent of teachers took sickness absence during 2013, compared with 62 per cent during 2012.
The average annual number of sick-days per teacher taking sickness absence was 10 days.
The total number of sick-days taken by teachers during 2013 was 177,334 – over 10,000 days less than
during 2012.
Table 19: Sickness absence of teachers in maintained schools, 1 January - 31 December (a) (b)
2009 2010 2011 2012 2013
Teachers taking a period of sickness absence (c): Full-time teachers:
Number 15,932 15,647 14,229 14,343 13,779
Percentage 69 70 65 65 62
Part-time teachers:
Number 2,298 2,762 2,720 2,861 2,955
Percentage 44 50 48 51 53
Total teachers:
Number 18,230 18,409 16,949 17,204 16,734
Percentage 65 66 61 62 60
Average number of days lost due to sickness:
per full-time teacher taking a period of sick leave 13 11 13 11 10
per teacher (all full-time teachers) 9 8 8 7 6
Average number of days lost due to sickness:
per part time teacher taking a period of sick leave 15 14 12 11 12
per teacher (all part-time teachers) 7 7 6 6 6
Average number of days lost due to sickness:
per teacher taking a period of sick leave 13 12 13 11 11
per teacher (all teachers) 8 8 8 7 6
Sickness absences by duration (in days): Full-time teachers:
5 days or less 62,140 58,363 50,083 52,020 44,666
6 to 20 days 43,953 29,067 36,635 28,719 23,692
more than 20 days 95,946 91,075 94,032 75,447 72,960
Total (full-time) 202,038 178,505 180,750 156,186 141,318
Part-time teachers:
5 days or less 8,186 10,058 8,498 8,731 8,962
6 to 20 days 7,833 6,537 8,409 5,772 5,634
more than 20 days 18,116 23,251 15,660 16,688 21,420
Total (part-time) 34,136 39,846 32,567 31,191 36,016
Total 236,174 218,350 213,317 187,377 177,334
Source: Local Authorities
(a) Sickness absence (including unpaid absence) of qualified and unqualified teachers w ith permanent contracts or contracts of more than 1 month.
(b) 2014 w as the first year teacher numbers w ere not collected from the STATS3 return. The percentage of teachers taking a period of sickness absence has been calcualted using PLASC data. Previous years have also been recaluated. Link to previous data is attached
Teachers in service, vacancies and sickness absence.
Key Quality Information
Coverage
The census data in this release relates to all maintained and independent schools in Wales. The teacher
sickness absence data relates to all maintained schools only.
Status
Schools’ data are derived from the Pupil Level Annual School Census (PLASC) returns and STATS 1
returns supplied by schools open on Census day in January each year. The returns are authorised by
headteachers and validated by Local Authorities. The teacher sickness absence data is collected directly
from the local authorities in January each year.
Timeliness
The census data in this release relate to the position on Tuesday 14 January 2014. The teacher sickness
absence data relates to the preceding calendar year.
Source of data
Pupil Level Annual School Census (PLASC) / School Census (STATS1 Return)
PLASC is an electronic collection of pupil and school level data provided by all maintained schools in
January each year. Schools record data on pupils and the school throughout the year in their Management
Information System (MIS) software. This data is collated into an electronic PLASC return and submitted to
the Welsh Government through DEWI, a secure online data transfer system developed by the Welsh
Government. Various stages of automated validation and sense-checking are built into the process to
ensure a high quality of data to inform policy making and funding.
From January 1994 independent schools in Wales complete a STATS1 return which replaced Form 101A
(school census return for independent schools prior to January 1994).
Teacher sickness absence data collection
This information is collected directly from the local authorities in January each year. The data covers the
sickness absence (including unpaid absence) of qualified and unqualified teachers with permanent
contracts or contracts of more than 1 month, during the previous calendar year. The data used to be
published as part of the release on Teachers in service, vacancies and sickness absence’. This release has
now been discontinued following our consultation on the
publication of official statistics
.
Class Size Data
: The January 2013 PLASC count was the first time class size data had been collected from
schools, replacing the annual local authority collection in September. Care should be taken when
comparing data from these two collections. The following are points to bear in mind when comparing the
most recent data with earlier years.
Pupils are leaving and joining part way through the academic year
Data is now collected through the management information system of a school rather than a
spreadsheet completed by a local authority
Any intake in January may affect class sizes
The final September primary class size data can be found here:
Class Sizes in Primary Schools, September 2011
Definitions
Full-time equivalent (FTE):
FTE pupil numbers count part-time pupils as 0.5.
Pupil Teacher Ratio (PTR):
calculated by dividing the FTE number of pupils by the FTE number of
qualified teachers (head teachers, acting head teachers, assistant head teachers, deputy heads and other
qualified teachers).
Free School Meals:
Pupils are eligible for free school meals if their families receive Income Support or
Income Based Jobseeker’s Allowance or Support under Part VI of the Immigration and Asylum Act 1999 or
the guarantee element of State Pension Credit. They are also eligible if their parents are in receipt of Income
Related Employment and Support Allowance (IR). Employment and Support Allowance is an integrated
contributory and income related allowance and replaced, for new claimants, Incapacity and Income
Support, where it is paid on the grounds of incapacity and sickness. Children who receive Income Support
or Income Based Jobseeker’s Allowance in their own right are also eligible to receive free school meals.
Children whose families are in receipt of Child Tax Credit, providing they are not entitled to Working Tax
Credit, and have an annual income, as assessed by HM Revenue & Customs that does not exceed £16,190
are also eligible for free school meals.
Special educational needs
: for further information please see these
guidance notes
.
Ethnic background
: please see these
guidance notes
for further information on categories and data
collection methods.
Welsh medium schools:
for further information please see these
guidance notes
.
Rounding:
In tables where figures have been rounded to the nearest final digit there may be an apparent
discrepancy between the sum of the constituent items and the total as shown.
Symbols:
The following symbols have been used throughout the publication:
.. not available
. not applicable
- the data item is not exactly zero but less than 0.05
Comparability: Other countries’ releases
Attached is the latest available data for England:
Schools, Pupils and their Characteristics, January 2014
School workforce in England: November 2013
Scotland publishes some data on pupils as part of a larger publication on schools. Their latest release was
published on 11 December 2013:
Summary Statistics for Schools in Scotland, No. 4 2013 Edition
Scotland also publishes some data on school meals as part of a different publication. Their latest release was
published on 25 June 2013:
Summary statistics for attainment, leaver destinations and healthy living, No. 3: 2013 Edition
The latest available release for Northern Ireland, published on 20 March 2014, can be found here:
Enrolments at schools and in funded pre-school education in Northern Ireland 2013/14 (revised)
Related data for Wales
This release shows final data at Wales level for 2010 - 2014.
The previous census data published were for 2013, in the form of a Statistical First Release:
Schools Census Results, 2013
, published on 11 July 2013.
Claimant Count: data on the latest claimant count can be obtained by following this link:
Who are the key users of this data?
These statistics are used both within and outside the Welsh Government. Some of the key users are:
Ministers and the Members Research Service in the National Assembly for Wales;
The Department for Education and Skills in the Welsh Government;
Other areas of the Welsh Government;
The research community;
Students, academics and universities;
Individual citizens and private companies.
What are the data used for?
These statistics are used in a variety of ways. Some examples of these are:
resource allocation in the Welsh Local Government Finance Settlement and the Pupil Deprivation
Grant;
advice to Ministers;
the all-Wales education core data packs (the replacement for the National Pupil Database);
local authority and school comparisons and benchmarks;
to inform the education policy decision-making process in Wales including school reorganisation;
to inform ESTYN during school inspections;
the education domain of the Welsh Index of Multiple Deprivation;
as a basis for School Banding;
to assist in research in educational attainment.