Statistical
First Release
PUPIL ABSENCE IN SCHOOLS IN ENGLAND: 2012 to 2013
INTRODUCTION
This Statistical First Release reports on absence in state-funded primary, secondary and special schools during the 2012/13 academic year. For the first time, information on absence in the sixth half term has also been published. However, the headline measures focus on five half terms to ensure of consistent time series.
SUMMARY
Persistent absentee rates have continued to fall. Overall absence rates increased slightly, but the rate in 2012/13 remains substantially lower than in 2010/11 and previous years.
KEY POINTS
[image:1.595.159.518.551.767.2]Persistent absentees, five half terms
Table 1: Percentage of pupil enrolments that are persistent absentees continues to decrease
2008/09 2009/10 2010/11 2011/12 2012/13
Primary 4.6 4.4 3.9 3.1 3.0
Secondary 10.2 9.2 8.4 7.4 6.4
Special 18.0 17.1 16.7 16.3 16.1
Total 7.4 6.8 6.1 5.2 4.6
Chart 1: Percentage of pupil enrolments that are persistent absentees SFR 09/2014
25 March 2014
Coverage: England
Theme: Children, Education and Skills
Issued by
Department for Education Sanctuary Buildings Great Smith Street London SW1P 3BT
Telephone: Press Office
020 7783 8300
Public Enquiries
0370 000 2288
Statistician
Eleanor Cotzias
schools.statistics@educati on.gsi.gov.uk
Internet
2
Persistent absentee
rates have continued to decrease
The percentage of pupil enrolments that are persistent absentees decreased from 5.2 per cent in 2011/12 to 4.6 per cent in 2012/13 (table 1.3). The largest falls were seen in secondary schools.
Persistent absentees now account for less overall absence
In 2012/13, persistent absentees accounted for 22.4 per cent of overall absence compared to 25.1 per cent in 2011/12 (table 1.3).
However, the absence gap between
persistent absentees and other pupils widened slightly
The overall absence gap between persistent absentees and all other pupils widened by 0.3 percentage points in 2012/13, from 20.6 to 20.9 percentage points (table 7.2).
Primary schools have lower levels of
persistent absence than secondary schools
The percentage of the school population who were persistent absentees was 9.0 per cent or lower in 97.5 per cent of state-funded primary schools compared to 82.4 per cent of state-funded secondary schools in 2012/13 (table 9.1).
[image:2.595.57.418.528.767.2]Absence rates, five half terms
Table 2: Absence rates increased by 0.1 percentage points in 2012/13
2008/09 2009/10 2010/11 2011/12 2012/13
Primary 5.3 5.2 5.0 4.4 4.7
Secondary 7.2 6.9 6.5 5.9 5.8
Special 10.7 10.3 10.0 9.6 9.7
Total 6.3 6.0 5.8 5.1 5.2
3 Overall absence rates
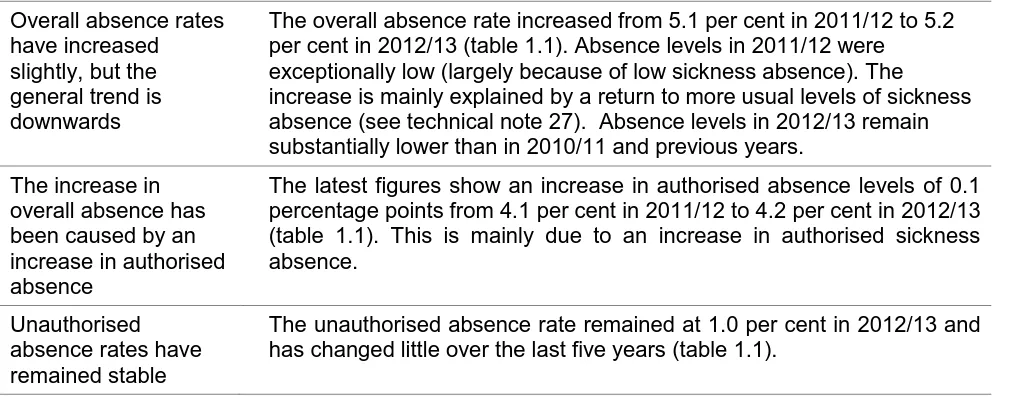
have increased slightly, but the general trend is downwards
The overall absence rate increased from 5.1 per cent in 2011/12 to 5.2 per cent in 2012/13 (table 1.1). Absence levels in 2011/12 were
exceptionally low (largely because of low sickness absence). The
increase is mainly explained by a return to more usual levels of sickness absence (see technical note 27). Absence levels in 2012/13 remain substantially lower than in 2010/11 and previous years.
The increase in overall absence has been caused by an increase in authorised absence
The latest figures show an increase in authorised absence levels of 0.1 percentage points from 4.1 per cent in 2011/12 to 4.2 per cent in 2012/13 (table 1.1). This is mainly due to an increase in authorised sickness absence.
Unauthorised absence rates have remained stable
The unauthorised absence rate remained at 1.0 per cent in 2012/13 and has changed little over the last five years (table 1.1).
Six half terms absence
[image:3.595.57.562.113.316.2]This is the first year the Department has collected absence for the second half of the summer term (6th half term). In the past absence data has been based on the autumn term, spring term and the first half of the summer term (see technical note 1).
Table 3: The overall absence rate was slightly higher for six half terms than for five half terms
2012/13
five half terms six half terms
Percentage of sessions missed due to:
Overall absence 5.2 5.3
Authorised absence 4.2 4.2
Unauthorised absence 1.0 1.1
Percentage of pupil enrolments that are
persistent absentees 4.6 4.6
Overall absence was slightly higher for six half terms
The overall absence rate for six half terms was 0.1 percentage points higher than the rate for five half terms (tables 1.1 and 1.2). The increase is mostly explained by higher levels of agreed family holidays and unauthorised absence.
The additional 6th half term had no effect on persistent absence
4 Reason for absence, six half terms
Illness remains the most common reason for absence
Illness (not medical or dental appointments) accounted for 58.3 per cent of all absences (table 2.1).
Family holiday is also a common reason for absence
Absence for family holidays accounted for 11.4 per cent of all absences in 2012/13 (table 2.1).
In the first five half terms of 2012/13, absence for family holidays decreased from 10.1 per cent in 2011/12 to 9.0 percent in 2012/13 (table 7.1).
Absence by pupil characteristics, six half terms
Absence levels for FSM pupils are higher than the national average
The rate of overall absence for those pupils who are known to be eligible for and claiming free school meals (FSM) was 7.6 per cent compared to 4.7 per cent for non FSM pupils (table 5.1).
The percentage of pupil enrolments that are persistent absentees and eligible for FSM was 10.6 per cent, compared to 3.3 per cent of pupil enrolments that were persistent absentees and not eligible for FSM (table 5.2).
The overall absence level for pupils eligible for FSM for the first five half terms has changed little over the years.
Absence levels for SEN pupils are above the national average
The overall absence rate for pupils with a statement of special
educational needs (SEN) was 8.2 per cent. For pupils with no identified SEN the overall absence rate was 4.8 per cent (table 5.1).
The persistent absentee rate for pupils with a statement of SEN is approximately three times higher than the rate for pupils with no identified SEN (table 5.2).
Absence rates are higher later in school
The rate of overall absence for pupils in national curriculum year group 11 was 1.4 times the rate of overall absence for those pupils in national curriculum year group 7 (table 5.1).
Absence rates for Traveller of Irish Heritage and Gypsy /Roma pupils are higher than any other pupil characteristic
The overall absence rates for Traveller of Irish Heritage and Gypsy /Roma ethnic groups was 21.4 per cent and 15.3 per cent respectively (see technical note 4). The overall absence rates for pupils of a Chinese and Black-African ethnicity were substantially lower than the national average at 3.1 and 3.2 per cent respectively (table 5.3).
Overall absence levels in the most deprived areas are higher than in the least deprived areas
5 Distribution of absence, six half terms
Table 4: The highest proportion of pupils were absent for five days or fewer
Percentage of pupil enrolments Number of days overall absence:
No absence 6.2
0.5 to 5 days 36.1
5.5 to 10 days 25.7
10.5 to 15 days 14.7
15.5 to 20 days 7.8
20.5 to 25 days 4.0
more than 25 days 5.5
The majority of pupils were absent for five days or fewer
42.3 per cent of pupil enrolments had five of fewer days of absence in 2012/13 (table 3.1).
Pupils in special schools missed the greatest number of days
6 MAIN TABLES
Charts:
Chart 1 State-funded primary, secondary and special schools: Percentage of pupil enrolments that are persistent absentees, England 2008/09 to 2012/13
Chart 2 State-funded primary, secondary and special schools: Overall absence rates by sector, England 2008/09 to 2012/13
Tables:
Table 1.1 State-funded primary, secondary and special schools: Pupil absence by type of school, five half terms, England 2008/09 to 2012/13
Table 1.2 State-funded primary, secondary and special schools: Pupil absence by type of school, six half terms, England 2012/13
Table 1.3 State-funded primary, secondary and special schools: Persistent absentees, five half terms, England 2008/09 to 2012/13
Table 1.4 State-funded primary, secondary and special schools: Persistent absentees, six half terms, England 2012/13
Table 2.1 State-funded primary, secondary and special schools: Absence by reason and gender, six half terms, England 2012/13
Table 2.2 State-funded primary, secondary and special schools: Absence by reason for persistent absentees, six half terms, England 2012/13
Table 3.1 State-funded primary, secondary and special schools: Distribution of enrolments by length of overall absence, six half terms, England 2012/13
Table 3.2 State-funded primary, secondary and special schools: Percentage of enrolments by their overall absence rates, six half terms, England 2012/13
Table 4.1 State-funded primary, secondary and special schools: Number of schools by the percentage of persistent absentees, six half terms, England 2012/13
Table 5.1 State-funded primary, secondary and special schools: Pupil absence by characteristics, six half terms, England 2012/13
Table 5.2 State-funded primary, secondary and special schools: Characteristics of persistent absentees, six half terms, England 2012/13
Table 5.3 State-funded primary, secondary and special schools: Pupil absence by ethnic group, six half terms, England 2012/13
Table 5.4 State-funded primary, secondary and special schools: Persistent absentees by ethnic group, six half terms, England 2012/13
7 Table 6.1 State-funded primary, secondary and special schools: Pupil absence in schools by
Income Deprivation Affecting Children Indices (IDACI) decile of pupil residence, six half terms, England 2012/13
ADDITIONAL TABLES
Table 7.1 State-funded primary, secondary and special schools: Absence by reason and gender, five half terms, England 2012/13
Table 7.2 State-funded primary, secondary and special schools: Absence by reason for persistent absentees, five half terms, England 2012/13
Table 8.1 State-funded primary, secondary and special schools: Distribution of enrolments by length of overall absence, five half terms, England 2012/13
Table 8.2 State-funded primary, secondary and special schools: Percentage of enrolments by their overall absence rates, five half terms, England 2012/13
Table 9.1 State-funded primary, secondary and special schools: Number of schools by the percentage of persistent absentees, five half terms, England 2012/13
Table 10.1 State-funded primary, secondary and special schools: Pupil absence by characteristics, five half terms, England 2012/13
Table 10.2 State-funded primary, secondary and special schools: Characteristics of persistent absentees, five half terms, England 2012/13
Table 10.3 State-funded primary, secondary and special schools: Pupil absence by ethnic group, five half terms, England 2012/13
Table 10.4 State-funded primary, secondary and special schools: Persistent absentees by ethnic group, five half terms, England 2012/13
Table 10.5 State-funded primary, secondary and special schools: Absence rates by type of special educational need, five half terms, England 2012/13
LOCAL AUTHORITY ANALYSIS
Table 11.1 State-funded primary, secondary and special schools: Pupil absence by type of school and local authority, five half terms, England 2012/13
Table 11.2 State-funded primary, secondary and special schools: Pupil absence by type of school and local authority, six half terms, England 2012/13
Table 12.1 State-funded primary, secondary and special schools: our year olds absence by local authority, five half terms, England 2012/13
Table 12.2 State-funded primary, secondary and special schools: Four year olds absence by local authority, six half terms, England 2012/13
8 Table 13.2 Pupil absence in schools by local authority district of school location, six half terms,
England 2012/13
Table 13.3 Pupil absence in schools by IDACI decile of pupil residence, six half terms, England 2012/13
Table 13.4 Pupil absence in schools by degree of rurality of pupil residence, six half terms, England 2012/13
Table 13.5 Pupil absence in schools by local authority district of pupil residence, six half terms, England 2012/13
Table 13.6 Pupil absence in schools by IDACI decile and degree of rurality of pupil residence, six half terms, England 2012/13
ADDITIONAL INFORMATION
Additional analyses showing absence in pupil referral units will not be made available in this statistical first release. See technical note 3.
Underlying data (including some summary school level analyses) is published in the ‘Underlying Data’ section.
RELATED PUBLICATIONS
DfE: Pupil absence in schools in England, including pupil characteristics, 2011/12
https://www.gov.uk/government/publications/pupil-absence-in-schools-in-england-including-pupil-characteristics
DfE: Pupil absence in schools in England: autumn term 2012
https://www.gov.uk/government/publications/pupil-absence-in-schools-in-england-autumn-term-2012
DfE: Pupil absence in schools in England: autumn 2012 and spring 2013
https://www.gov.uk/government/publications/pupil-absence-in-schools-in-england-autumn-2012-and-spring-2013
DfE: Outcomes for children looked after by LAs in England, as at 31 March 2013
https://www.gov.uk/government/publications/outcomes-for-children-looked-after-by-las-in-england.
9 NATIONAL STATISTICS PUBLICATION
The United Kingdom Statistics Authority has designated these statistics as National Statistics, in accordance with the Statistics and Registration Service Act 2007 and signifying compliance with the Code of Practice for Official Statistics.
Designation can be broadly interpreted to mean that the statistics:
meet identified user needs;
are well explained and readily accessible;
are produced according to sound methods, and
are managed impartially and objectively in the public interest.
Once statistics have been designated as National Statistics it is a statutory requirement that the Code of Practice shall continue to be observed.
The Department has a set of statistical policies in line with the Code of Practice for Official Statistics, these are published here: http://www.education.gov.uk/a00196924/national-statistics
CONFIDENTIALITY
The Code of Practice for Official Statistics requires that reasonable steps should be taken to ensure that all published or disseminated statistics produced by the Department for Education protect confidentiality. Enrolment numbers at national and regional levels have been rounded to the nearest 5. Enrolment numbers of 1 or 2 have been suppressed, being replaced in the tables by an ‘x’. Where any number is shown as zero (0), the original figure was also zero. Where the numerator or denominator of any percentage calculated on enrolment numbers is less than 3, this has been replaced by an ‘x’. This suppression is consistent with the Departmental statistical policy which can be found at
http://media.education.gov.uk/assets/files/policy%20statement%20on%20confidentiality.pdf
REVISIONS
There are no planned revisions to this Statistical First Release. However, if at a later date we need to make a revision, this will comply with the departmental revisions policy which is published at:
10 TECHNICAL NOTES
Definitions
1. This is the first year the Department has collected absence data for the second half of the summer term (the 6th half term); previously absence data has been collected for autumn term, spring term and the first half of the summer term. Therefore, this Statistical First Release provides tables for both six half terms and five half terms to allow for comparisons with previous years. We plan to do this until we have a three year time series for the six half term figures.
2. Absence data for four year olds (who are not of compulsory school age) was collected for the first time for the autumn term 2012. The Department’s view is children as young as 4 should have good attendance as part of their education. It is important that schools are able to work with parents of 4 year olds to develop good patterns of school attendance before they reach
compulsory school age, and avoid it becoming a problem later on in their schooling career. This will ensure that good attendance habits are embedded in children as soon as they reach
compulsory school age.
3. Pupil referral unit (PRU) absence data will not be included in this Statistical First Release as due to the School Census changes the 2012/13 PRU data has not been collected. From the 2013/14 academic year PRU absence will be collected on a termly rather than an annual basis. It has not yet been decided how PRU data will feature in the 2013/14 statistical first releases.
4. Caution is recommended when interpreting the data for Traveller of Irish Heritage and Gypsy/Roma children due to potential under-reporting for these ethnic classifications. 5. The measures of absence used here are rates of overall, authorised and unauthorised
absence and persistent absentees. Some cases of unauthorised absence may change to authorised absence at a later stage (once an explanation has been reported to the school). However, if this is supplied to the school after the School Census database has closed, the absence will still be recorded as ‘no reason yet’. In this respect, using overall absence rates and the rate of persistent absentees gives more suitable data for performance reporting. 6. The Department has published ‘Advice on School Attendance’, which explains how
schools should apply the Education (Pupil Registration) (England) Regulations 2006 and subsequent amendments and the use of the national codes to record pupil attendance and absence in schools. This advice is available at
http://www.education.gov.uk/schools/pupilsupport/behaviour/attendance/a00216341/schoo
l-attendance.
11 8. Schools are required to take attendance registers twice a day: once at the beginning of the
morning session and once during the afternoon session. In their register, schools are required to distinguish whether pupils are present, engaged in an approved educational activity or are absent. Where a day pupil of compulsory school age is absent, schools have to indicate in their register whether the absence is authorised by the school or unauthorised.
9. Authorised absence is absence with permission from a teacher or other authorised representative of the school. This includes instances of absence for which a satisfactory explanation has been provided (for example, illness).
10. Unauthorised absence is absence without permission from a teacher or other authorised representative of the school. This includes all unexplained or unjustified absences. Arriving late for school, after the register has closed, is recorded as unauthorised absence.
11. The Department’s key measure of persistent absence relates to the academic year. A pupil is classified as a persistent absentee for the academic year if missing around 15 per cent or more of possible sessions (46 or more sessions for five half terms and 56 or more sessions for six half terms). See table below:
Persistent absence threshold (around 15 per cent of possible sessions)
Autumn term 22 sessions
Spring term 16 sessions
Autumn and Spring terms 38 sessions Full year – five half terms 46 sessions Full year – six half terms 56 sessions
12. To account for high levels of study leave and other authorised absence, the 6th half term absence data for 15 year old pupils has been discounted. The persistent absence (PA) threshold has been adjusted accordingly. See below.
Persistent absence threshold (around 15 per cent of possible sessions)
First five half terms 46 sessions
Six half terms
56 sessions for enrolments aged below 15
46 sessions for enrolments aged 15. Calculation of absence rates
13. The methodology used to calculate absence rates is shown below. Further calculations, including absence rates by reason, can be found in the metadata specification document in the Underlying Data section of this release at:
12 Percentage of sessions missed due to overall absence:
Percentage of sessions missed due to authorised absence:
Percentage of sessions missed due to unauthorised absence:
Percentage of pupil enrolments that are persistent absentees:
Percentage of sessions missed by persistent absentees due to overall absence:
Percentage of sessions missed by persistent absentees due to authorised absence:
Percentage of sessions missed by persistent absentees due to unauthorised absence:
Percentage of overall absence for which persistent absentees are responsible:
Percentage of authorised absence for which persistent absentees are responsible:
Percentage of unauthorised absence for which persistent absentees are responsible:
13 Presentation
14. The tables include local authority maintained primary schools, primary sponsor-led and converter academies including free schools in a category labelled ‘state-funded primary’. City technology colleges and all secondary academies, including free schools, university technical colleges and studio schools are categorised as ‘state-funded secondary. ’Local authority maintained special schools, non-maintained special schools and special
academies including special free schools are categorised as ‘special’. Data collection
15. In 2006 the School Census started to collect pupil level absence data on a termly basis (spring, summer and autumn collections) from maintained secondary schools, city technology colleges and academies relating to absence during the 2005/06 school year. For the 2006/07 school year the scope of collection of the School Census was extended to include maintained primary schools and special schools. Special schools provide annual absence data in the autumn School Census.
16. Reason for absence was collected for the first time for the autumn term 2006. Schools are able to provide absence data using a reason code or by using total figures for the number of sessions missed due to authorised or unauthorised absence. Some schools do not have the required software to provide absence data by reason, and therefore are only able to provide overall totals. In such instances absence is categorised as ‘unclassified’ reason for absence. To derive absence rates, the sum of absence by reason has been used. If this is missing or is less than the total provided, overall totals have been used.
17. Data are collected a term in arrears, meaning that where a school closes, data are not collected for the last term the school was open. School closures tend to take place in the summer, in which case data for the summer term (first half of) will not be collected. Year on year comparisons of local authority data may be affected due to schools converting to academies.
18. Guidance on the School Census, including absence, is available on the DfE statistics website:
http://www.education.gov.uk/researchandstatistics/stats/schoolcensus/b00208370/sc2012.
The technical specification for School Census can be found at:
http://webarchive.nationalarchives.gov.uk/20130903181919/http://www.education.gov.uk/researc
handstatistics/stats/schoolcensus/a00208045/school-census-2013. This explains what data are
collected and what validation are in place. Data coverage and quality
14 20. The School Census collects information for a pupil’s attendance in the term prior to the
census. For example, the spring School Census collects information on absence during the previous autumn term. Absence data for the 2012/13 year have been derived by linking pupil records collected in the spring 2013 School Census, summer 2013 School Census and autumn 2013 School Census to derive overall annual totals for the number of possible sessions; the number of sessions missed by reason for absence and the number of sessions missed due to authorised and unauthorised absence for each enrolment. Derived annual absence totals have been linked to a pupil’s characteristics data at the time of the absence. Where characteristics data are missing, information collected in the following census have been used, except for ethnicity which is only collected in the spring School Census.
21. Information on pupil absence counts the number of pupil enrolments rather than the number of pupils. Where a pupil has moved school during the year, they will be counted more than once as they have recorded attendance data in more than one school. Pupil absence is recorded for the period a pupil is enrolled at a school. Where a pupil has a dual registration their absence may be returned from both schools, if both schools return absence data via the School Census.
22. For a pupil enrolment, if the number of possible sessions in a term is zero/missing or is less than the total number of sessions missed due to authorised and unauthorised
absence, or if the total number of possible sessions exceeds the limit for the term, then the absence variables have been set to zero for that term only, and that term’s information has been discounted from this release. If the total number of possible sessions for each and every term equals zero, then the enrolment has not been included.
23. From September 2011 the way schools record attendance and absence for dually registered pupils changed. Attendance code D (Dual registered at another educational establishment) is no longer counted in the School Census as an attendance. Each school now only records the attendance and absence for the sessions a pupil is required to attend at their school, previously each school recorded all absence. This change affects a
relatively small number of pupils and has only a marginal effect on absence rates.
24. Following changes to attendance regulations and procedures, from 2012 the School Census collects attendance information about pupils unable to attend school due to exceptional circumstances using attendance code Y. Schools use code Y to record the sessions where a pupil is unable to attend because:
The school site, or part of it, is closed due to an unavoidable cause;
The transport provided by the school or a local authority is not available, and their home is not within walking distance; or
A local or national emergency has resulted in widespread disruption to travel which has prevented the pupil from attending school.
15 25. Four sponsor-led academies have been removed from the analysis as they submitted data for
their predecessor school. One sponsored academy opened on 1st September 2013, but has been removed from the analysis as it should have no attendance in 2012/13 academic year. Absence data for two independent schools who later converted to free schools has been removed from the analysis. In addition, 18 schools reporting fewer than five pupil enrolments have also been excluded from this analysis to prevent disclosure of information.
26. By the end of July 2011 the Isle of Wight local authority completed restructuring of their education system, phasing out their middle schools and moving to a two-tier system. Care should be taken when making comparisons with previous year’s data. All middle schools on the island, other than Christ The King College, closed for pupils as of 21 July 2011. Instead of the four years at middle school, children have been given 2 extra years in primary school and then move straight onto secondary school. Children already in middle school transferred straight to the new secondary schools at the start of the next academic year, whether they are in year 6, 7 or 8.
27. In autumn term 2011 there was a very substantial decrease in absence levels which we believe was due to a combination of factors, including:
A large decrease in absence rates for illness reasons – illness being by far the most common reason for pupil absence. Figures from the Health Protection Agency suggest that lower levels of flu-like illness may be a factor;
Eid fell out of term time and explains some of the relatively large fall in absence for religious observance;
There was also a relatively large decrease in absence for agreed family holidays and for “other authorised” reasons. This may reflect a growing reluctance for absence to be approved.
28. The information in this release is based on data returned by schools as part of the School Census. It does not include data which has been submitted by local authorities or schools outside of the School Census data collection.
29. The data presented here are based on the attendance registers which are taken twice a day: once at the beginning of the morning session and once during the afternoon session. It therefore does not include “internal unauthorised absence”. This is defined as unauthorised absence by pupils between the school's twice daily registrations, i.e. a pupil is effectively recorded as attending during morning or afternoon registration but is physically not present at another part of the relevant session. The Department's current data systems are limited insofar as they only record and measure the registrations, not any subsequent absence.
30. The data contained in this release relates only to those pupils on the roll of a state-funded primary, state-funded secondary or special school. It does not include those children who are not registered at a school.
Local Area Statistics
16 32. IDACI is a subset of the Income Deprivation Domain of the Index of Multiple Deprivation 2010. Each SOA is given a score showing the percentage of children aged under 16 that live in families that are income deprived, i.e. they are in receipt of certain benefits and their equivalised income is below 60% of median before housing costs. Further information about IDACI can be found on the CLG website at:
http://www.communities.gov.uk/publications/corporate/statistics/indices2010?view=Standard.
33. IDACI bands for 2012/13, 2011/12 and 2010/11 are based on 2010 IDACI scores. IDACI bands for 2007/08, 2008/09 and 2009/10 are based on 2007 IDACI scores. Care should be taken when comparing IDACI tables based on different IDACI scores.
Urban / Rural Areas
34. The Rural and Urban Area Classification is a product of a joint project to produce a single and consistent classification of urban and rural areas. The project was sponsored by a number of government departments. The rural and urban definitions classify output areas, wards and super output areas by aggregating the underlying hectare grid squares classifications for the measures of settlement size and sparsity. Up to eight classes of output areas could be distinguished; four settlement types (urban, town and fringe, village, hamlet and isolated dwelling) in either a sparse or less sparse regional setting. Further information about the Rural and Urban Area Classification 2004 can be found on the National Statistics website at:
http://www.ons.gov.uk/ons/guide-method/geography/products/area-classifications/rural-urban-definition-and-la/index.html
Symbols used
35. For national tables (tables 1.1 to 10.5), pupil or enrolment numbers have been rounded to the nearest 5. Pupil or enrolment numbers of 1 or 2 have been suppressed, being replaced in the table by an ‘x’. The corresponding absence rates have also been suppressed. Where any number is shown as zero (0), the original figure was also zero. Where the numerator or denominator of any percentage calculated on enrolment numbers is 1 or 2, this has been replaced by an ‘x’.
36. For the local authority tables (tables 11.1 to 12.2), national and region enrolment numbers have been rounded to the nearest 5. Enrolment numbers of 1 or 2 have been suppressed, being replaced in the table by an ‘x’. The corresponding absence rates have also been
suppressed. Where any number is shown as zero (0), the original figure was also zero. Where the numerator or denominator of any percentage calculated on enrolment numbers is 1 or 2, this has been replaced by an ‘x’.
37. For tables 13.1 to 13.6 an ‘x’ indicates that a figure has been suppressed due to small numbers. Values of 1 to 2 inclusive, or percentages of persistent absentees based on 1 or 2 pupils who were (or were not) persistent absentees are suppressed. Some additional figures have also been suppressed to prevent the possibility of a suppressed figure being revealed.
38. All percentages have been rounded to one decimal place. 39. The following symbols have been used within this publication:
0 – zero
17 ENQUIRIES
Enquiries (non-media) about information contained in this document should be addressed to
Education Standards Evidence and Dissemination Division, Level 4, Sanctuary Buildings, Great Smith Street, London, SW1P 3BT or e-mail schools.statistics@education.gsi.gov.uk