State-funded schools inspections and outcomes
as at 31 March 2019
This release contains:
▪ schools’ most recent inspections and outcomes as at 31 March 2019
▪ provisional data for inspections completed between 1 January 2019 and 31 March 2019
[image:1.595.72.466.561.735.2]▪ revised data for inspections completed between 1 September and 31 December 2018.
Figure 1: Outcomes of inspections of exempt primary and secondary schools, by year
85% of all schools are good
or outstanding At the end of March 2019, we had judged 85% of all 21,700 schools to be good or outstanding at their most recent inspection, compared to 86% in August 2018 and 87% in August 2017.
Of those exempt outstanding schools inspected due to concerns about performance, 16% remained outstanding
Outstanding primary and secondary schools are exempt from routine inspection but can be inspected if we have concerns about performance. As such they are likely to decline. Only 16% of the exempt schools inspected this year remained outstanding, which is lower than in most of the previous years.
The fall in the proportion of exempt outstanding schools that remained outstanding is partly driven by the mix of schools inspected this year
Seventy-eight per cent of the exempt outstanding schools inspected in 2018/19 were primary schools, compared to 68% in 2017/18. As exempt primary
schools are less likely to remain outstanding, the change in the mix of phases inspected is one of the main
Contents
Introduction 3
Main findings 4
Inspections between 1 September 2018 and 31 March 2019 4
Schools at their most recent inspection 11
Revisions to previous release 13
Notes 14
Glossary 15
Acknowledgements
Introduction
The purpose of these official statistics is to disseminate the data on school standards collected through Ofsted’s role as an inspectorate. They provide information about how the judgements of schools have changed over time and vary across different phases of education and different parts of the country.
This official statistics release reports on the outcomes of state-funded school inspections carried out under sections 5 or 8 of the Education Act 2005:
https://www.legislation.gov.uk/ukpga/2005/18/contents. These inspections were carried
out between 1 September 2018 and 31 March 2019. This release also includes the most recent inspections and outcomes for all schools that have been inspected, as at 31 March 2019.
Main findings
Inspections between 1 September 2018 and 31 March 2019
1. Between 1 September 2018 and 31 March 2019, Ofsted conducted 1,462 full inspections. Of these, 300 were conducted under section 81 of the Education Act 2005 and became full section 5 inspections part way through. Full inspections result in a set of graded inspection judgements.
2. There were 1,787 short inspections which did not convert to a full inspection and the school maintained its previous grade of good or outstanding. There were also 13 short inspections that converted to a full inspection where there were serious concerns about safeguarding, behaviour or the quality of education.
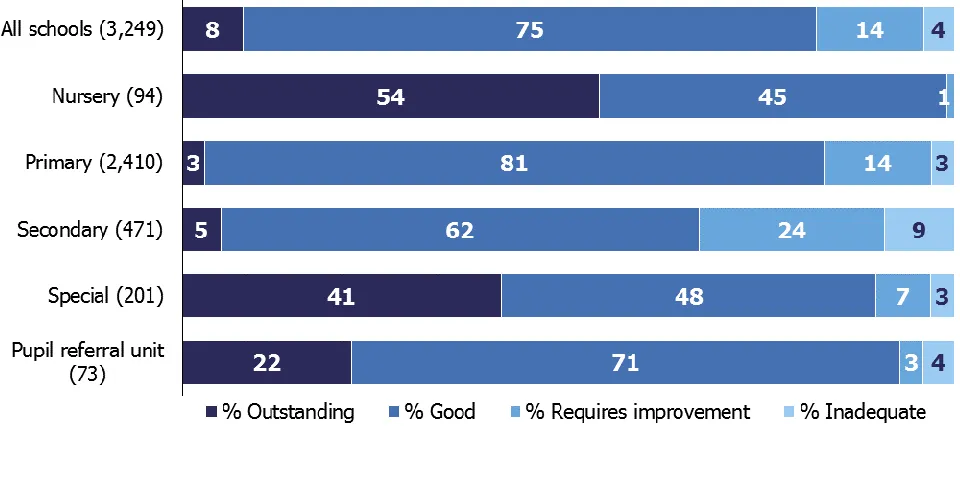
[image:4.595.60.540.436.675.2]3. Eighty-two per cent of the 3,249 schools inspected through a full or short inspection were judged good or outstanding. In most cases, either the current school or its predecessor school had been inspected previously2. There were 32 schools that had not been inspected previously in any form, and of these 24 were judged to be good or outstanding.
Figure 2: Overall effectiveness of schools inspected between 1 September 2018 and 31 March 2019
(including short inspections that did not convert)
1 See the glossary for details of section 5 and section 8 inspections.
Inspections of schools previously judged to be outstanding
4. Between 1 September 2018 and 31 March 2019 there were 447 inspections of schools that were previously outstanding. These inspections included outstanding nursery schools, primary schools, secondary school, special schools, and pupil referral units. Two hundred and eighty two of the 447 inspections were full inspections.
5. As part of the 2011 Education Act the government made outstanding primary and secondary schools exempt from routine inspection. Despite this we are still able to inspect outstanding primary or secondary schools if their performance gives cause for concern, or they have undergone a significant change. Most inspections of exempt schools are carried out because the school’s performance appears to be declining. Exempt schools are subject to a risk assessment3 three times a year, based on their latest performance data, and a desk-based review by a senior HMI in one of our regional teams. Some inspections are due to complaints we receive about the schools. Others are because the school has substantially changed since it was judged to be outstanding (for instance, it has taken on another key stage or merged with another school).
6. In 2018/19 we have substantially increased the number of inspections of exempt outstanding schools that we carry out. This is due to concerns about some outstanding schools now having been exempt from inspection for a long time, and the consequent gaps in our knowledge about the quality of education and safeguarding in these schools4. This increase in the number of inspections carried out began in the autumn term, and we inspected 117 exempt schools between 1 September and 31 December 2018. In December 2018 the Department for Education asked Ofsted to increase its inspections of exempt outstanding schools, and to inspect 10% of such schools in the coming year5. Following this request, we have continued to inspect high numbers of exempt schools, and between 1 September 2018 and 31 March 2019 we have
inspected 305 such schools. This is 8% of the exempt schools operating at the start of the academic year. The number of inspections carried out so far this year is more than double the number of these inspections completed between 1 September 2017 and 31 August 2018. See figure 3.
7. Of these 305 exempt school inspections, 270 (89%) were deemed a full inspection. There were also 35 section 8 inspections that were not deemed a full inspection, and therefore remained outstanding.
3For further details see ‘Risk assessment methodology for schools and further education and skills providers’, Ofsted, March 2019: www.gov.uk/government/publications/risk-assessment-methodology-for-schools-and-further-education-and-skills-providers#history
4See HMCI’s Annual Report, December 2018, for further details of Ofsted’s concerns:
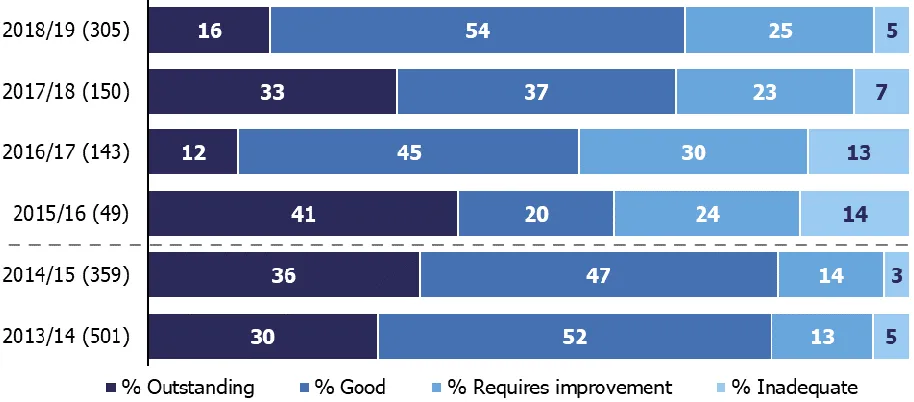
8. Including the section 8 inspections that were not deemed a full inspection, only 16% of exempt schools that were inspected remained outstanding. This is 17 percentage points lower than the proportion of exempt schools that remained outstanding
[image:6.595.78.535.245.446.2]following inspections that took place between 1 September 2017 and 31 August 2018. It is also lower than the proportion in most of the previous five years. See Figure 3. One of the reasons for this is the mix of schools inspected.
Figure 3: Outcomes of inspections of exempt primary and secondary schools, by year
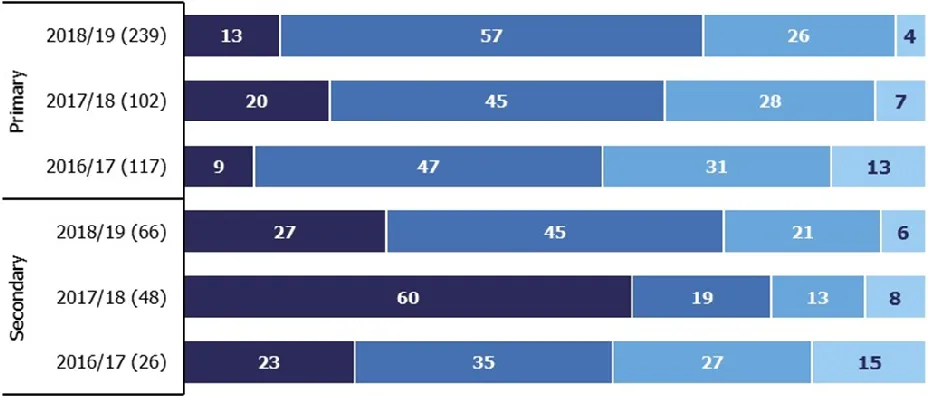
Figure 4: Outcomes of inspections of exempt primary and secondary schools, by year and phase
10.Seventy-eight per cent of the exempt outstanding schools inspected in 2018/19 were primary schools, compared to 68% in 2017/18. As exempt primary schools are less likely to remain outstanding, the change in the mix of phases inspected is one of the main reasons for the decline in the overall proportion of exempt schools remaining outstanding this year.
11.In addition to the 305 exempt schools inspected this year we have also inspected 142 non-exempt outstanding schools. These are nursery schools, special schools and pupil referral units.
Inspections of schools previously judged to be good
12.Schools previously judged to be good may have a short inspection or a full section 5 inspection. The type of inspection they have depends on the findings of the previous short inspection, whether they have had a change of status, and whether a risk assessment raised any concerns about the school.
13.There were 1,670 short inspections of good schools this year. Of these short inspections, 76% confirmed that the school remains good. There were 205 schools (12%) where inspectors believed that the school may have declined from good if it had been a full inspection. There were 187 schools (11%) where inspectors believed that the school may have improved to outstanding if it had been a full inspection. In both these cases we will schedule a full inspection for one to two years’ time6.
6‘School inspection handbook –section 8’, Ofsted, September 2018;
14.Only 13 short inspections (1%) have converted to a full inspection in 2018/19. Following a policy change in January 2018, short inspections only convert to a full inspection if there are concerns on safeguarding, behaviour or the quality of education.
15.We have returned to 253 schools where the previous short inspection recommended that the next inspection should be a full section 5 inspection. This included 128 full inspections of good schools where the outcome of the previous short inspection was
for a ‘section 5 inspection next’ as the school was potentially improving. Of these, 81
(63%) improved to outstanding. There have also been 125 full inspections of good schools where the outcome of the previous short inspection was for a ‘section 5
inspection next’ as the school was potentially declining. Of these 59 (47%) declined
from good.
16.Following an earlier policy change in November 2017, primary and secondary schools that were judged good at their previous inspection may be selected for a full section 5 inspection instead of a short inspection. This decision is based on a risk assessment to determine if they have undergone significant change, such as a change of the age range of the school, or where the quality of provision may have deteriorated
significantly. There have been 390 of these inspections this year, and of these, 2% improved to outstanding, 48% remained good and 51% declined from good to requires improvement or inadequate7.
Inspections of schools previously judged to require improvement
17.This year there have been 384 full inspections of schools that were previously judged to require improvement. Of these 384 inspections, 62% improved to good or
[image:8.595.63.501.509.673.2]outstanding, 28% remained requires improvement and 10% declined to inadequate.
Figure 5: Grade movement for state-funded schools previously judged to require improvement, by year8
7 Percentages are rounded which is why they appear to add to more than 100%.
18.Since 1 September 2016 there has been a decline in the percentage of schools that improved from requires improvement to good or outstanding. This was due to a decline in the percentage of both primary and secondary schools that were previously judged to require improvement and improved to good or outstanding in 2015/16.
19.Between 2015/16 and 2016/17 the percentage of primary schools improving from requires improvement to good or outstanding dropped from 74% to 66%, and the percentage of secondary schools improving from requires improvement to good or outstanding also dropped from 55% to 44%. In the three years since 1 September 2016, the percentage of both primary and secondary schools improving from requires improvement to good or outstanding has remained stable at an average of 68% for primary schools and 44% for secondary schools.
Schools that have had consistently poor inspection outcomes for a long time
20.In the 2018 Annual Report9 we identified around 490 schools that had been judged to require improvement, to be satisfactory, or be inadequate in every inspection they had between 1 September 2005 and 31 August 201810. Since 1September 2018 we have inspected over 100 of these schools, and, of these, over half have improved to good or outstanding.
21.However there remain around 430 schools that are currently in a cycle of poor outcomes. Eighty-six per cent are academies and of these, 98% are in a multi-academy trust (MAT). This reflects the Department for Education’s (DfE) policies for struggling schools, such as the Directive Academy Order process where inadequate local authority maintained schools are legally required to become an academy.
22.Of the academies that are in a MAT, around half have been inspected since becoming an academy, but were still judged to be inadequate or to require improvement. The other half are within their first 3 years of opening11 and so have not yet been inspected in their current form.
9For related research on ‘stuck’ schools please see HMCI’s Annual Report, December 2018:
www.gov.uk/government/publications/ofsted-annual-report-201718-education-childrens-services-and- skills/the-annual-report-of-her-majestys-chief-inspector-of-education-childrens-services-and-skills-201718#schools-stuck
10 Based on inspections from September 2005 as this is when section 5 inspections began, and the overall effectiveness judgement is broadly comparable across frameworks from this point onwards. If a school has become an academy, or changed its unique reference number for any other reason, then analysis includes both the current school and the predecessor school. Only schools with four or more inspections since 2005 are included.
Section 8 inspections12
23.In addition to the 1,800 short inspections carried out, there have been 380 other section 8 inspections completed this year. These were:
◼ 35 inspections of exempt schools due to concerns ◼ 11 inspections of good schools due to concerns
◼ 124 monitoring inspections of schools previously judged to require improvement
◼ 6 inspections of schools previously judged to require improvement due to concerns
◼ 145 monitoring inspections of schools in special measures ◼ 45 monitoring inspections of schools with serious weaknesses ◼ 14 inspections of inadequate schools due to concerns.
24.These inspections do not result in an overall effectiveness judgement and therefore these schools retain their previous overall effectiveness grade. This is the first release where this data has been shown at a school level See the Excel file that accompanies this release for the details of the schools.
Schools at their most recent inspection
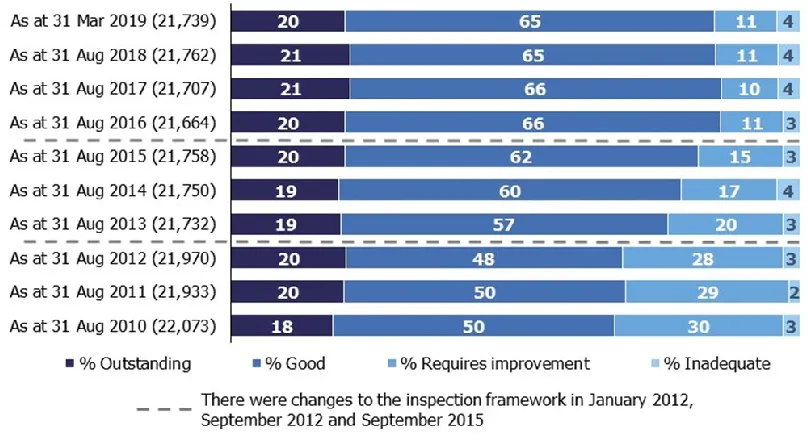
At the end of March 2019 we had judged 85% of schools to be good or outstanding at their most recent inspection. This is the same proportion as in the previous official
[image:11.595.81.503.261.456.2]statistics release (which covered inspections to 31 December 2018). There was also little change from the position at the end of August 2018 (86%), although this fall continues the trend seen since 2017 (87%). Outcomes continue to be higher for primary schools (87% good or outstanding) compared to secondary schools (75%).
Figure 6: Overall effectiveness of state-funded schools at their most recent inspection, as at 31 March 2019
[image:11.595.70.474.534.755.2]Comparability of inspection outcomes over time
Care should be taken when comparing outcomes over time. Factors which may affect the comparability include; changes in inspection frameworks, policy, legislation, the way schools are selected for inspection, and the exemption for outstanding schools. Please see our latest methodology and quality report13 for more details.
13 State-funded schools inspections and outcomes as at 31 March 2019: methodology and quality
Revisions to previous release
The provisional data in the previous release relates to inspections that took place between 1 September 2018 and 31 December 2018, with the reports published by 31 January 2019. Revised data for inspections in this period is provided in tables 1R and 2R of the Excel file accompanying this release: www.gov.uk/government/statistics/state-funded-schools-inspections-and-outcomes-as-at-31-march-2019.
This revised data includes an additional 16 full inspections that had not been published by 31 January but were published by 30 April 2019. These inspections resulted in the
following additional overall effectiveness judgements: ◼ 2 good
◼ 1 requires improvement ◼ 13 were inadequate.
The inclusion of these inspections resulted in a change to the percentage of inadequate schools, up from 9% to 11%.
Seven of the additional inspections were of primary schools, eight were of secondary schools and one was of a special school.
Notes
Inspections are conducted under sections 5 and 8 of the Education Act 2005. The inspection framework was most recently revised on 1 September 2015. Ofsted introduced a common inspection framework for all settings on the Early Years Register, state-funded schools, non-association independent schools and further education and skills providers. The common inspection framework can be found at:
www.gov.uk/government/publications/common-inspection-framework-education-skills-and-early-years-from-september-2015.
An explanation of the main uses of this data, further contextual information and the arrangements for quality assurance is provided in the methodology:
http://www.gov.uk/government/statistics/state-funded-schools-inspections-and-outcomes-as-at-31-march-2019. This report provides information about strengths and limitations of
the statistics.
Glossary
AcademiesAcademies are publicly funded independent schools. Academies do not have to follow the national curriculum and can set their own term times. They still have to follow the same rules on admissions, special educational needs and exclusions as other state schools.
Academies get money directly from the government, not the local authority. They are run by an academy trust, which employs the staff. Some academies have sponsors such as businesses, universities, other schools, faith groups or voluntary groups. Sponsors are responsible for improving the performance of their schools.
Academies include converter and sponsor-led academies, free schools, university technical colleges and studio schools.
Academy converters
Academy converters are schools which have opted to become an academy, most of which were good or outstanding local authority maintained schools before they became an academy.
Academy converters retain their latest inspection grade, even if the most recent inspection was of the predecessor school.
Sponsor-led academies
Sponsor-led academies are academies which have sponsors such as businesses,
universities, other schools, faith groups or voluntary groups. Sponsors are responsible for improving the performance of their schools.
Sponsor-led academies are viewed as new legal entities and do not retain their inspection history.
Free schools
Free schools are funded by the government and are not run by the local authority. They are set-up on a not-for-profit basis by charities, universities, and community and faith groups, among others.
Free schools are ‘all-ability’ schools, so cannot use academic selection processes like a
grammar school. They can set their own pay and conditions for staff and change the length of school terms and the school day. Free schools do not have to follow the national curriculum.
Local authority maintained schools
Maintained schools are funded by the government and run by the local authority. They must follow the national curriculum.
Section 5 and section 8
Ofsted is required to inspect at prescribed intervals all schools to which section 5 applies.14 The regulations set the interval for section 5 inspections ‘within five school years from the end of the school year in which the last inspection took place.’15 The exceptions to this requirement are schools that are exempt from section 5 inspection (known as ‘exempt schools’).
Section 8 enables Her Majesty’s Chief Inspector (HMCI) to conduct inspections for a range
of purposes, including monitoring visits by Her Majesty’s Inspectors (HMI) to schools that
are in a category of concern following a section 5 inspection. HMI may also visit schools to aid HMCI in keeping the Secretary of State informed or to contribute to reports on, for example, the teaching in a curriculum subject or a particular aspect of the work of
schools. Section 8 is also used to enable HMCI, where she has concerns, to undertake an inspection of those outstanding schools that are exempt from routine inspection under section 5.
Inspections conducted under section 8 include:
◼ short inspections of schools judged to be good at their most recent section 5 inspection and those outstanding schools that are not exempt from section 5.
− Short inspections are a one-day inspection visit and take place approximately every four years. A short inspection determines whether the school
continues to provide the same good or outstanding standard of education for pupils. A short inspection does not result in individual graded judgements nor does it change the overall effectiveness grade of the school. If the school shows significant decline, a short inspection is converted to a full inspection, where inspectors will make the full set of graded judgements required under section 5.
− From November 2017, around 20% of previously good schools are now subject to a full section 5 inspection instead of a short inspection, where our risk assessment tells us that a short inspection would be highly likely to convert. For example, where a school underwent significant change, such as changing its age range, or where the quality of provision may have
deteriorated significantly.
− From January 2018 short inspections are only converted to a full inspection where there are serious concerns. Where a short inspection does not
convert, there are additional outcomes where the school remains either good or outstanding but the next inspection will be a section 5 inspection.
◼ monitoring inspections of schools judged as requires improvement, having serious weaknesses or requiring special measures
◼ any inspection undertaken in other circumstances where the inspection has no specific designation
◼ unannounced behaviour inspections
14 Under section 5(1) of the Education Act 2005.
The Office for Standards in Education, Children's Services and Skills (Ofsted) regulates and inspects to achieve excellence in the care of children and young people, and in education and skills for learners of all ages. It regulates and inspects childcare and children's social care, and inspects the Children and Family Court Advisory and Support Service (Cafcass), schools, colleges, initial teacher training, further education and skills, adult and community learning, and education and training in prisons and other secure establishments. It assesses council children’s services, and inspects services for children looked after, safeguarding and child protection.
If you would like a copy of this document in a different format, such as large print or Braille, please telephone 0300 123 1231, or email [email protected].
You may reuse this information (not including logos) free of charge in any format or medium, under the terms of the Open Government Licence. To view this licence, visit www.nationalarchives.gov.uk/doc/open-government-licence, write to the Information Policy Team, The National Archives, Kew, London TW9 4DU, or email:
This publication is available at www.gov.uk/government/organisations/ofsted. Interested in our work? You can subscribe to our monthly newsletter for more information and updates: http://eepurl.com/iTrDn.
Piccadilly Gate Store Street Manchester M1 2WD
T: 0300 123 1231
Textphone: 0161 618 8524 E: [email protected] W: www.gov.uk/ofsted