Transcription and Host-Directed Therapy
Xinxia Peng,a,bPavel Sova,a,bRichard R. Green,a,bMatthew J. Thomas,a,bMarcus J. Korth,a,bSean Proll,a,bJiabao Xu,c Yanbing Cheng,cKang Yi,cLi Chen,cZhiyu Peng,c,dJun Wang,cRobert E. Palermo,a,bMichael G. Katzea,b
Department of Microbiology, University of Washington, Seattle, Washington, USAa
; Washington National Primate Research Center, Seattle, Washington, USAb ; BGI-Shenzhen, BGI-Shenzhen, Chinac
; BGI-Guangzhou, Guangzhou, Chinad
ABSTRACT
Polyadenylated mature mRNAs are the focus of standard transcriptome analyses. However, the profiling of nascent transcripts, which often include nonpolyadenylated RNAs, can unveil novel insights into transcriptional regulation. Here, we separately
se-quenced total RNAs (Total RNAseq) and mRNAs (mRNAseq) from the same HIV-1-infected human CD4ⴙT cells. We found that
many nonpolyadenylated RNAs were differentially expressed upon HIV-1 infection, and we identified 8 times more differentially expressed genes at 12 h postinfection by Total RNAseq than by mRNAseq. These expression changes were also evident by con-current changes in introns and were recapitulated by later mRNA changes, revealing an unexpectedly significant delay between transcriptional initiation and mature mRNA production early after HIV-1 infection. We computationally derived and validated the underlying regulatory programs, and we predicted drugs capable of reversing these HIV-1-induced expression changes fol-lowed by experimental confirmation. Our results show that combined total and mRNA transcriptome analysis is essential for fully capturing the early host response to virus infection and provide a framework for identifying candidate drugs for host-di-rected therapy against HIV/AIDS.
IMPORTANCE
In this study, we used mass sequencing to identify genes differentially expressed in CD4ⴙT cells during HIV-1 infection. To our surprise, we found many differentially expressed genes early after infection by analyzing both newly transcribed unprocessed pre-mRNAs and fully processed mRNAs, but not by analyzing mRNAs alone, indicating a significant delay between transcription initiation and mRNA production early after HIV-1 infection. These results also show that important findings could be missed by the standard practice of analyzing mRNAs alone. We then derived the regulatory mechanisms driving the observed expression changes using integrative computational analyses. Further, we predicted drugs that could reverse the observed expression changes induced by HIV-1 infection and showed that one of the predicted drugs indeed potently inhibited HIV-1 infection. This shows that it is possible to identify candidate drugs for host-directed therapy against HIV/AIDS using our genomics-based ap-proach.
R
ecently, we reported the first transcriptome deep sequencing(RNAseq) analysis of a CD4⫹T cell line infected with HIV-1
(1). We observed both the dramatic expansion of viral mRNA
expression and the widespread differential expression of host genes. Particularly, we observed a striking discordance between a small set (⬃1% of detected genes) of differentially expressed (DE)
host genes and the large amount of viral RNAs (⬃20% of total
mappable reads) present at 12 h postinfection (hpi), the earliest time point studied. Given the large quantity of viral RNA detected, this apparent silencing of the host transcriptional response at 12 hpi is intriguing, considering that the expression of multiple host transcription factors is already significantly altered at 12 hpi (1).
In that study, we adopted mRNAseq, the typical application of
RNAseq focusing on polyadenylated [poly(A)⫹] mature mRNAs
through the use of poly(T) priming (1), which is also standard for microarray analysis. By its design, mRNAseq leaves out the
non-polyadenylated [poly(A)⫺] fraction of the mammalian
transcrip-tome, which includes many noncoding RNAs (ncRNAs) and tran-scripts known to encode proteins such as histones (2,3). A more
recent report from the ENCODE project shows that poly(A)⫺
transcripts can be found in most protein-coding genes (4). Also, studies sequencing total RNAs or subcellular fractions of total RNAs have shown the capture of nascent pre-mRNAs in the
poly(A)⫺fraction of the mammalian transcriptome (5,6). Fur-ther, recent studies show that a clearly detectable lag exists be-tween pre-mRNA and mRNA production in response to stimuli such as macrophage activation by lipopolysaccharide (LPS) (6) or tumor necrosis factor (TNF) (7) and epithelial cell stimulation by epidermal growth factor (8). Also, splicing is indicated as a con-tributing factor to the delay between pre-mRNA and mRNA pro-duction (6,7), and HIV-1 infection can modulate host RNA
splic-ing machineries (9). Together, we reasoned that early host
transcriptional changes may be more evident by measuring nas-cent pre-mRNAs than mature mRNAs.
Total RNAseq, an alternative application of RNAseq, directly
Received17 March 2014Accepted17 May 2014 Published ahead of print21 May 2014 Editor:G. Silvestri
Address correspondence to Michael G. Katze, honey@uw.edu.
Supplemental material for this article may be found athttp://dx.doi.org/10.1128 /JVI.00768-14.
Copyright © 2014, American Society for Microbiology. All Rights Reserved.
doi:10.1128/JVI.00768-14
on November 7, 2019 by guest
http://jvi.asm.org/
sequences total RNA (depleted of rRNA), therefore covering both
the poly(A)⫹and poly(A)⫺fractions of the transcriptome.
Com-pared to mRNAseq, Total RNAseq generates many more short sequencing reads originating from regions outside known exons, i.e., introns or intergenic regions (3,5,10). Normally, the large amount of reads mapped to introns significantly complicates im-portant RNAseq applications such as mature mRNA assembly and isoform quantification. However, these intronic reads offer a dis-tinct benefit of detecting nascent transcription, i.e., incompletely spliced and nonpolyadenylated immature transcripts (5,6). De-spite the complementarities between mRNAseq and Total RNAseq, existing studies still use either of two RNAseq ap-proaches, due to factors such as high cost and analytical needs. Since the real impact of choosing a single RNAseq approach for specific biological questions is unknown, it is valuable to contrast mRNAseq and Total RNAseq to see if broader early host transcrip-tion changes could be detected at the pre-mRNA than at the mRNA level.
To further investigate the early host response to HIV-1
infec-tion, including poly(A)⫺ncRNAs and nascent pre-mRNAs, in
this study we performed Total RNAseq analysis of the same
HIV-1-infected CD4⫹T cell samples as those that we previously used
for mRNAseq analysis (1). Here we show that many poly(A)⫺
transcripts were differentially expressed during HIV-1 infection, which were accurately detected by Total RNAseq but not mRNAseq. Surprisingly, we identified much broader (about 8-fold-greater) host transcriptional changes at 12 hpi by Total RNAseq than mRNAseq. We found that the initiation of the early response to HIV-1 infection was largely independent of viral rep-lication, as treatment of cells with nonreplicating HIV-1 virions induced transcriptional changes of similar trends. We also identi-fied over 1,000 long ncRNAs differentially expressed during HIV-1 infection. The systematic characterization of early tran-scriptional changes, by integrating large-scale transcription factor chromatin immunoprecipitation (CHiP)-seq data and a human tissue mRNAseq expression compendium, enabled predictions of underlying regulators such as transcription factors and long ncRNAs. We then identified drugs capable of reversing the early transcriptional changes induced by HIV-1 infection and utilized the reversed drug expression profiles to refine regulator predictions. With these predicted regulators, we computationally derived regula-tory programs for the induction of early transcriptional changes from a compendium of published expression data and validated their pre-dictability. Finally, we showed experimentally that lycorine, one of the drugs predicted by our computational analyses, potently inhib-ited HIV-1 infection of CD4⫹T cells.
MATERIALS AND METHODS
Cell culture, viral infection, and drug treatment.Infection of the human CD4⫹T cell line SUP-T1 with HIV-1 strain LAI, cell and virus propaga-tion, and sample collection for RNAseq were described in reference1. Briefly, SUP-T1 cells were obtained from the American Type Culture Collection (CRL-1942) and propagated in RPMI 1640 medium (Gibco) supplemented with 10% fetal bovine serum (HyClone), penicillin (100 U/ml), streptomycin (100 g/ml), and GlutaMAX-I. HIV-1 strain LAI (cat-alog no. 2522) was obtained from the NIH AIDS Research and Reference Reagent Program (Germantown, MD) and propagated in SUP-T1 cells. U373-MAGI-CXCR4CEM cells were obtained from M. Emerman through the AIDS Research and Reference Reagent Program to test virus stock titers (11). Typical titers reached 107infectious units per ml. Infec-tions were carried out at a multiplicity of infection (MOI) of 5 and
per-formed in triplicate. Mock-infected samples received SUP-T1 cell condi-tioned medium and were also performed in triplicate. Inactivation of HIV-1 by UV irradiation was described in reference12. Briefly, UV-inac-tivated HIV-1 was generated by irradiating HIV preparations for 5 min, a dose we found sufficient to abrogate viral replication in U373-MAGI-CXCR4 cells and in SUP-T1 cells as detected by viral mRNA load Taq-Man quantitative reverse transcription-PCR (qPCR) (13), with GAPDH (glyceraldehyde-3-phosphate dehydrogenase) transcript serving as an in-ternal control (forward primer, 5=GGCCTCCAAGGAGTAAGACC3=; re-verse primer, 5=AGGGGTCTACATGGCAACTG3=). For qPCR assays of long noncoding RNAs (lncRNAs), an independent time course of infec-tions of SUP-T1 with HIV-1 LAI was carried out as described in reference
14. The infectious doses in both infections were optimized to achieve 100% infected cells at 24 hpi with⬃50% cell viability as measured by trypan blue exclusion assay. Infected cells were visualized by immunoflu-orescence assay with rabbit HIV-1SF2 p24 antiserum kindly provided by BioMolecular Technologies through the AIDS Research and Reference Reagent Program.
To test the effect of the drugs predicted to reverse HIV-1-induced expression changes, we first infected 1⫻106SUP-T1 cells with HIV-1 LAI at an MOI of 0.1 for 1 h. After washing away the virus inoculum, cells were suspended in medium containing dimethyl sulfoxide (DMSO) or lycorine and cultured for 24 h. Cells were pelleted, and total RNA was isolated and reversely transcribed into cDNA (using the QuantiTect kit; Qiagen), and intracellular viral RNA was quantified as described previously (13), with GAPDH transcript serving as an internal control (forward primer, 5=GG CCTCCAAGGAGTAAGACC3=; reverse primer, 5=AGGGGTCTACATG GCAACTG3=). Cells were also deposited on a microscopic slide, and im-munofluorescent Gag staining was carried out as described previously (1). For influenza virus infections of a polarized human bronchial epithe-lial cell line (Calu-3), three avian-origin influenza A viruses (IAVs) iso-lated from fatal human cases, i.e., strains A/Anhui/01/2013 (H7N9) (here Anhui01), A/Netherland/219/2003 (H7N7) (here NL219), and A/Viet-nam/1203/2004 (H5N1) (here VN1203), and a seasonal human virus, A/Panama/2007/1999 (H3N2) (here Pan99), were grown in the allantoic cavities of 10-day-old embryonated hen’s eggs for 24 to 28 h at 37°C for avian-origin viruses or for 48 h at 34°C for the H3N2 virus. Allantoic fluids from multiple eggs were pooled, clarified by centrifugation, aliquoted, and stored at⫺70°C. The propagation, polarization, and infection of Calu-3 cells were carried out as described in references15and16. Calu-3 cell sample collection and RNA isolation were described in reference16. All research with avian viruses was conducted under biosafety level 3 containment, including enhancements required by the U.S. Department of Agriculture and the Select Agent Program (http://www.cdc.gov/od/ohs /biosfty/bmbl5/bmbl5toc.htm).
Transcriptome sequencing analysis.For Total RNAseq analysis, ap-proximately 20g of total RNA from each sample was submitted to the Beijing Genomics Institute (BGI) for sequencing. In brief, rRNAs were depleted using the RiboMinus human/mouse transcriptome isolation kit (Invitrogen, CA). rRNA-depleted RNAs were fragmented, and cDNA syn-thesis was primed using random hexamers. Short fragments were purified for an average insert size of 200 nucleotides (nt) and then ligated with proprietary adapters. The (2⫻90)-nt paired-end sequencing was done using an Illumina HiSeq 2000. The mRNAseq data were acquired using the exact same samples as reported in reference1.
Read mapping and differential expression analysis.The read map-ping was carried out essentially as described in reference1. Briefly, we mapped short reads to human ribosomal sequences to remove potential rRNA sequences using the short-read aligner software Bowtie (17). We then mapped the remaining unmapped reads to the HIV genome (Gen-Bank accession no.K02013) using the gapped aligner software TopHat (18), which predicts HIV splicing junctions and maps intron-spanning reads to known splicing junctions. To quantify transcript expression, we mapped all reads that remained unmapped to the human reference ge-nome (hg19, build GRCh37, downloaded from the UCSC gege-nome
on November 7, 2019 by guest
http://jvi.asm.org/
browser [http://genome.ucsc.edu]) using TopHat. RefSeq transcript an-notations were supplied to facilitate the mapping of reads spanning known splicing junctions. Gene level quantification was obtained using HT-seq (http://www-huber.embl.de/users/anders/HTSeq/doc/overview .html). The differential expression analysis was performed using edgeR (19) separately for Total RNAseq and mRNAseq data sets. For each data set, for the downstream analyses, we kept only those genes with at least 10 raw read counts in at least three biological samples and which were con-sidered detected in this study. Clustering and other statistical analyses were performed using R (http://www.r-project.org/). For visualization, BAM files were generated using TopHat and SAMtools (20) and displayed using the UCSC Genome Browser.
Compilation of custom human genome annotation.We created a custom human genome annotation using a hybrid approach. First, we combined a published catalog of human long noncoding RNAs (21) with a reference human annotation recently released by the ENCODE project (Gencode v17). Independent of these known annotations, we recon-structed transcripts in each sample, using Cufflinks (22) based on reads mapped to the human genome, separately for mRNAseq and Total-RNAseq data sets. Only uniquely mapped reads were used, as this was meant to complement existing annotation. Transcripts assembled from individual samples were merged together using Cuffmerge. All newly as-sembled transcripts were checked against the known annotations as de-scribed above using the tool Cuffcompare from Cufflinks, and only those assembled transcripts with the class code “u” (unknown, intergenic tran-script) were added into the combined known annotations as predicted novel transcripts.
Identification of genes preferably detected by Total RNAseq relative to mRNAseq.To investigate if we captured nonpolyadenylated tran-scripts through Total RNAseq analysis, we compared for the same gene in the same sample the read counts from Total RNAseq analysis to that from mRNAseq analysis. We reasoned that if nonpolyadenylated transcripts were transcribed from a gene, Total RNAseq analysis would consistently collect more short reads than mRNAseq analysis. To facilitate the com-parison, first, for each sample by each RNAseq analysis, the raw gene read counts were scaled by the total gene read counts. Next, for each gene, we counted the number of samples in which the scaled read count from Total RNAseq analysis was 1.5-fold greater or more than that from the corre-sponding mRNAseq analysis. A gene was considered enriched in Total RNAseq data if it had more (1.5-fold or higher) reads in more than one-half of the total samples.
qPCR.RNA was reverse transcribed using the QuantiTect reverse transcription kit (Qiagen, Valencia, CA), and the resulting cDNA was diluted 50 times. Primers for gene targets of interest were designed using the Primer 3 program (http://frodo.wi.mit.edu/primer3). PCR was run on an ABI Prism 7900HT sequence detection system in triplicate per each sample and target. The relative change in transcript abundance was cal-culated using the⌬⌬CTmethod (whereCTis the threshold cycle) with GAPDH as an internal gene reference. We inspected the expression change of GAPDH in our RNAseq data, and the expression change was negligible. We also checked against a second calibrator (IRF-3) that did not change expression upon HIV-1 infection based on both the RNAseq data collected here and an unpublished microarray data set, and the re-sults were identical to those derived from the GAPDH-controlled exper-iment. Intracellular viral RNA load was quantified as previously described (13). The expression changes of a set of 46 host genes were quantified using qPCR. These genes were previously selected spanning a range of values for the validation of the results from mRNAseq analysis, but only the results from 34 of 46 genes were reported (1).
Transcription factor binding site enrichment analysis with ChIP-seq data.ChIP-seq identified transcription factor (TF) binding sites from the ENCODE project (23) were downloaded from the UCSC genome browser (http://genome.ucsc.edu). A TF was considered found in the pro-moter region of a gene if one of its binding sites was located within the window from 1,000 bp upstream to 100 bp downstream of its annotated
transcriptional start site. Considering that the ENCODE ChIP-seq data were a pool of data from different cell types, we limited our analysis to those genes that had at least one Pol II binding site located in their pro-moter regions, indicating that they were actually transcribed in the as-sayed cells. This requirement also ensured that the annotations of tran-scriptional start sites were less likely incorrect. A hypergeometric test was used to test if the binding sites of a TF were enriched in the promoters of a list of differentially expressed genes. For the list of genes differentially expressed at 12 hpi, we limited our analysis to protein-coding genes, as they were mostly (over 85%) protein-coding genes and the differences in the frequencies of gene biotypes between this set and the rest could bias the analysis. For lncRNAs, the enrichment analysis was performed for all differentially expressed lncRNAs (12 and 24 hpi results combined), as the list for 12 hpi was too small. Also, a similar analysis was done for the list of lncRNAs that were not differentially expressed during HIV-1 infection, in order to filter out TFs for which the enrichment might be due to differ-ences in gene biotypes. Three lncRNA categories were excluded from the analysis, i.e., 3prime_overlapping_ncrna, antisense, sense_intronic, and sense_overlapping, because their genomic overlapping with other anno-tated genes introduced ambiguities in assigning binding sites.
Functional enrichment analysis.Functional analysis was performed using Ingenuity Pathways Analysis (IPA; Ingenuity Systems, Inc.). The Ensembl gene identifier was used to map each gene to its corresponding molecule in the Ingenuity Pathways Knowledge Base, a curated repository of biological interactions and functional annotations. ThePvalue associ-ated with a function or a pathway was calculassoci-ated using the right-tailed Fisher exact test. For all analyses, IPA-generatedPvalues were adjusted using the Benjamini-Hochberg multiple testing correction. Enriched functions from IPA analysis were custom processed to summarize redun-dant entries, i.e., different functions containing the same or similar sets of genes, or a subset of genes in other functions. Specifically, a similarity measurement between two functions was defined as the ratio between the number of overlapping genes and the total number of genes in one of two functions with a smaller number of genes. The corresponding distance was defined as 1 minus the calculated similarity measure. Hierarchical clustering analysis was performed on the all-against-all distance matrix using the single-linkage clustering method to group IPA functional cate-gories into function groups. The most significantPvalue among all func-tions within each function group was defined as thePvalue for the func-tion group. These funcfunc-tion groups were further filtered if the genes in a function group were mostly covered by more-significant (smallerPvalue) function groups. A similar summarization and filtering process was done for enriched canonical pathways.
Association of long ncRNA with functions enriched in genes differ-entially expressed at 12 hpi.We downloaded the alignment files of the mRNAseq read alignment of 24 human tissues and cell types from the Human lincRNA Catalog website (http://www.broadinstitute.org/genome _bio/human_lincrnas/?q⫽home) and then quantified gene expression in each tissue in the same way as we did for the RNAseq data collected here. We added mRNAseq read counts collected from our control samples (the average of 3 mock-infected replicates from12 hpi as a single data column) representing T cells to the human tissue collection. Only those genes with at least 10 raw read counts in at least 3 tissues were kept for the down-stream analysis. The normalized read count, in counts per million (cpm), for each tissue was obtained using edgeR (19). After normalization, we further limited the following correlation analysis to those genes with non-zero entries across at least 60% of tissues. The normalized read cpms were log2transformed before the calculation of correlations, which was done using the bicor function provided by the WGCNA package (24). For each lncRNA differentially expressed at 12 hpi, we ranked all other genes by their correlation coefficients with the lncRNA. The ranked list was ana-lyzed using the GseaPreranked tool provided by gene set enrichment anal-ysis (GSEA) (25) to obtain the functions that were highly correlated with the lncRNA of interest. For GSEA analysis, the human gene symbol was used to map each gene to the corresponding genes in the reference
on November 7, 2019 by guest
http://jvi.asm.org/
tion annotation database, here the function groups enriched in 12 hpi DE genes, which were derived from the IPA analysis as described above and the gene modules as described below.
cmap database.To search for drugs that reversed the early expression changes induced by HIV-1 infection, we used the publicly available Con-nectivity Map (cmap) database (build 02) (26). cmap is a collection of genome-wide transcriptional data from cultured human cells treated with 1,309 different compounds. In cmap, the basic unit of data is defined as an instance, which is a pair of a single treatment of a compound and the corresponding control and the list of genes ordered by their extent of differential expression between the treatment and control. The same com-pound can be tested multiple times (under the same or different condi-tions), each of which is considered an instance. Given a query signature, i.e., a list of up- and downregulated genes, a value between⫹1 and⫺1 (called the connectivity score) is calculated for each of the instances in cmap. A high positive connectivity score indicates that the corresponding compound induced the expression of the query signature. A high negative connectivity score indicates that the corresponding compound reversed the expression of the query signature. Instances are rank ordered by de-scending connectivity score. The top-ranked instance (i.e., a score of⫹1) is said to be the most positively connected with the query signature. The bottom-ranked instance (i.e., a score of⫺1) is the most negatively con-nected with the query signature. For each compound, cmap calculates a measure of the enrichment of its instances in either end of the order list of all instances in cmap and a permutationPvalue for that enrichment score. By default, cmap returns a list of the top 20 compounds best connected (positively and negatively) with the query signature, ordered in ascending order ofPvalues and then ascending order of (absolute) enrichment. We used the 500 most upregulated and 500 most downregulated genes at 12 hpi for a query signature. Genes were mapped to Affymetrix HG-U133A probe sets using the Affymetrix NetAffy batch query tool to query the cmap database.
Gene module construction, regulatory model learning, and valida-tion.We manually queried NCBI GEO for human microarray data sets related to HIV infection and/or CD4⫹T cells. To minimize potential technical complications, we kept only data sets using the same microarray platform, Affymetrix Human Genome U133 Plus 2.0 array (accession numberGPL570in GEO). For each data set, we downloaded the raw cel files and reprocessed the data in the same way using the “rma” function in R/affy package (27). Probe set to gene mapping was obtained using the Affymetrix NetAffy batch query tool, and probe sets mapped to the same gene were averaged. Within each data set, we identified one control con-dition (untreated, uninfected, time point zero, etc.) and converted the expression measures to log2ratios between each sample and the mean of the control samples to focus on the effects of perturbations and to mini-mize potential technical differences across different data sets. This also facilitated the downstream interpretation. We also averaged technical replicates and replicates of cell line samples to maximally retain biological variations.
To find gene modules, we combined the obtained log2ratios from each data set and performed weighted coexpression network analysis using the R package WGCNA (24). We used the “signed” network with the value of 6 for power and biweight midcorrelation “bicor” for correlation calcula-tion. For each gene model, we then learned predictive models from the compiled expression data. To derive predictive models, we used a ma-chine learning procedure called “elastic net,” which is implemented by the R package “glmnet” (28). For each gene module, the predictor variables were a set of candidate predicators/regulators, and the response variable was the median expression changes of genes for each condition. In the case of 10 identified TFs as candidate regulators, we fitted a linear regression model (family “gaussian”) with the lasso penalty (alpha⫽1), as there were no strong correlations among predictor variables. The fitting proce-dure generates a set of selected regulators and the corresponding regres-sion coefficients for the linear regresregres-sion model. In the case of the ex-panded set of 115 TFs and lncRNAs as candidate regulators, we fitted a
linear regression model with the elastic net penalty. We compiled the expanded list of candidate regulators based on the Gene Ontology (TF, GO:0003700) and Gencode (lncRNA) annotation, and we excluded the ones that were not differentially expressed at 12 hpi during HIV infection. For each gene module, we searched a series of values between 0 and 1 for alpha and chose the one that gave the minimum mean cross-validation error. Here we used 10-fold cross-validation, i.e., the samples were ran-domly partitioned into 10 sets, of which 9 sets were used to learn a pre-dictive model, which was subsequently used to blindly predict the out-come in the 10th set. This process was repeated iteratively 10 times, and the model with the minimum mean cross-validation error was identified and subjected to the predictability assessment. To ensure that the learning and evaluation were robust, we first randomly divided the 173 conditions/ samples into 10 subsets and learned 10 predictive models by leaving out one of the subsets each time. Then we used the learned model to predict the overall expression changes of the gene module during HIV-1 infec-tion.
Nucleotide sequence accession numbers.The RNAseq data from this publication have been submitted to NCBI’s GEO database (http://www .ncbi.nlm.nih.gov/geo) and assigned the identifierGSE53993.
RESULTS
Total RNAseq uncovers nonpolyadenylated transcripts differ-entially expressed in HIV-1-infected CD4ⴙT cells.Previously,
we infected SUP-T1 cells, a human CD4⫹T lymphoblast cell line,
with HIV-1 LAI under conditions that gave a synchronous infec-tion in⬃100% of the cells, and we collected samples at 12 and 24 h postinfection (hpi) (1). To extend our prior mRNAseq analysis of poly(A)⫹transcripts into less-studied poly(A)⫺transcripts, we sequenced total RNAs (Total RNAseq) from the same set of samples plus additional samples from cells treated with UV-inac-tivated virions (see Table S1 in the supplemental material). Ac-cordingly, we expanded human gene annotation by combining
the recent annotation provided by ENCODE (29), a published
catalog of human large intergenic noncoding RNAs (lincRNAs,
one category of long ncRNAs) (21), and unannotated intergenic
transcripts reconstructed from this RNAseq data using Cufflinks
(22). As shown inTable 1, over 40% of genes in the expanded
annotation encode ncRNAs and intergenic transcripts, allowing us to better cover less-studied ncRNAs along with well-annotated protein-coding genes.
We then quantified host gene expression changes during HIV-1 infection, separately using mRNAseq and Total RNAseq (see Materials and Methods). In total, 11,094 genes were
differen-tially expressed (false-discovery rate [FDR] adjusted P value,
⬍0.05) at one or more time points following HIV infection, by
either or both of the RNAseq methods (Table 1). Due to the much deeper (2.2-fold-higher, on average) sequencing coverage of host nonribosomal transcripts by mRNAseq, the expression of 2,159 DE genes was detected only by mRNAseq. Yet, there were still 165 DE genes detected only by Total RNAseq, indicating that these
genes produced exclusively poly(A)⫺transcripts. Not
surpris-ingly, these genes were enriched with ncRNAs and intergenic tran-scripts while the majority of DE genes detected only by mRNAseq were protein-coding genes (Fig. 1A).
Since many human genes, including protein-coding ones, are
found in both poly(A)⫹and poly(A)⫺RNA fractions (4), we
investigated for which genes the measuring of both RNA fractions (by Total RNAseq) would improve the detection of differentially ex-pressed genes. To this end, we first identified genes for which Total RNAseq tended to generate consistently higher expression abun-dances than the parallel mRNAseq analysis across the same samples,
on November 7, 2019 by guest
http://jvi.asm.org/
an indication of the existence of poly(A)⫺transcripts. We found a set of 3,264 genes (of 17,316 genes detected overall) that had expression abundances 1.5-fold greater or higher in Total RNAseq than the cor-responding mRNAseq across more than 50% (6/11) of available sam-ples, hence considered enriched by Total RNAseq. Compared to the
rest of detected genes, it contained relatively fewer (62% versus 75%) protein-coding genes, and more (23% versus 12%) ncRNAs or
inter-genic genes, including known poly(A)⫺transcribed genes such as
[image:5.585.114.477.327.646.2]TERC and RMRP genes (see Fig. S1 in the supplemental material). Next, we examined the differential expressionPvalues of DE genes in TABLE 1Summary of the expanded human gene annotation and the numbers of differentially expressed genes identified
Gene biotypea Annotation
No. of differentially expressed genes identified in cells infected with:
Intact HIV UV-inactivated HIV
Total 12 hpi 24 hpi Total 12 hpi 24 hpi
Coding 20,317 8,570 1,660 8,189 1,118 826 425
Intergenic 359 248 64 234 51 44 17
lncRNA 16,927 1,098 98 1,074 45 29 18
sncRNA 8,527 29 4 26 6 0 6
Pseudogene 14,138 1,144 107 1,115 96 27 74
Other 841 5 0 5 1 1 0
Total 61,109 11,094 1,933 10,643 1,317 927 540
a
Gene biotype was based on the GENCODE classification. For lncRNA, processed_transcript, lincRNA,3prime_overlapping_ncrna, antisense, sense_intronic, sense_overlapping. For sncRNA, snRNA, snoRNA, misc_RNA, miRNA. For pseudogene, polymorphic_pseudogene, pseudogene, IG_V_pseudogene, TR_V_pseudogene. For “other,” IG_V_gene, TR_C_gene, TR_J_gene, TR_V_gene, rRNA.
A 12hr 24hr 12hr 24hr Enriched Not
-log10 (raw p-value)
0 0.5 1 1.5 2 absolute log2 fold change
0 5 10 15 B 3.5e−35 1.1e−09 5.1e−169 1 (328) (1802) (1542) (6537) 3.8e−28 0.97 6.9e−176 1 C -_ _ _ _ _ _ _ _ _ _ 3300 3300 3300 3300 3300 3300 3300 3300 3300 3300 0 0 0 0 0 0 0 0 0 0 MALAT1 -_ _ _ _ _ _ _ _ _ _ NEAT1 HIV HIV HIV mock mock HIV HIV HIV mock mock 300 300 300 300 300 300 300 300 300 300 0 0 0 0 0 0 0 0 0 0 Total mRNA 13kb 33kb
qPCR Total mRNA
MALAT1
NEAT1
Δ
Δ
Ct or log2 f
old change
D
4 12 16 20 24 12 24 12 24 hpi
4 12 16 20 24 12 24 12 24 hpi
0% 20% 40% 60% 80% 100% Total mRNA coding lncRNA sncRNA intergenic pseudogene other −1. 0 0 .0 1. 0 −0. 5 0 .5 1. 5
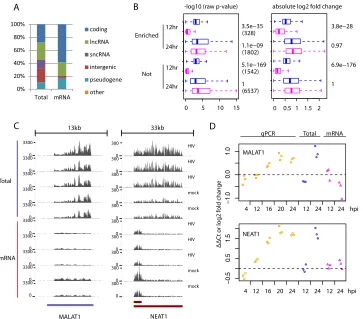
FIG 1Comparison of Total RNAseq versus mRNAseq detection of poly(A)⫺transcripts. Only genes from the list of 11,094 DE genes are included here. (A) Percentages of gene biotypes whose expressions were detected only by either Total RNAseq (Total) or mRNAseq (mRNA). The classification of gene biotypes is shown inTable 1. (B) Metrics (left,⫺log10rawPvalues; right, absolute log2-fold changes) of differential expression obtained from Total RNAseq (blue) versus mRNAseq (pink) data separately
for genes enriched (Enriched) versus those not enriched (Not) by Total RNAseq. The numbers on the right side show thePvalues from Wilcoxon tests comparing metrics from Total RNAseq versus mRNAseq analysis. For the boxplot, the whiskers extend to the most extreme data point, which is no more than 1.5 times the interquartile range from the box. (C) Raw read coverage (yaxis) across the MALAT1 and NEAT1 genes (xaxis) in samples collected at 24 hpi. (D) Temporal expression changes of MALAT1 and NEAT1 measured by qPCR and expression changes obtained by the two RNAseq methods. For qPCR, a mixture of oligo(dT) and random primers was used for cDNA synthesis.
on November 7, 2019 by guest
http://jvi.asm.org/
this Total RNAseq enriched set. Interestingly, these DE genes still tended to have betterPvalues in Total RNAseq than mRNAseq data, even though their expression was detected by both RNAseq methods (Fig. 1B). For some genes, such as NEAT1 and MALAT1 genes, that are known to be transcribed as poly(A)⫺transcripts, we observed clear discrepancies in expression changes between Total RNAseq and mRNAseq measurements, and independent analyses by qPCR agreed with Total RNAseq (Fig. 1CandD). In summary, these results con-vincingly demonstrated for the first time that many poly(A)⫺host transcripts were differentially expressed during HIV-1 infection in CD4⫹T cells. The first application of combined Total RNAseq and mRNAseq enabled the discovery of those genes that were differen-tially expressed during HIV-1 infection but not adequately addressed
by mRNAseq due to poly(A)⫺transcripts.
Total RNAseq reveals broad early host transcriptional changes not detected by mRNAseq.Similar to our previous re-port (1), even with this expanded annotation we still identified only a small set (220) of DE genes at 12 hpi by mRNAseq. Unex-pectedly, we found many more (1,801) DE genes at 12 hpi by Total RNAseq. Several comparisons showed that this difference was not a technical artifact. First, at 12 and 24 hpi, Total RNAseq measure-ments agreed well (Pearson correlation coefficient,r, 0.90 to 0.98) with separate qPCR measurements over a large set of genes (46 genes) that were selected independent of Total RNAseq data (see Fig. S2A in the supplemental material). Second, at 24 hpi, the overall expression changes of DE genes agreed between mRNAseq and Total RNAseq (see Fig. S2B in the supplemental material). These findings indicate that the 12 hpi expression changes de-tected by Total RNAseq are accurate.
We categorized the 1,933 DE genes identified at 12 hpi sequen-tially into four exclusive subgroups: subgroup a, genes with an
adjustedPvalue of⬍0.05 by mRNAseq; subgroup b, genes with a
rawPvalue of⬍0.2 by mRNAseq; subgroup c, genes enriched in
Total RNAseq as described above; and subgroup d, the rest (Fig.
2A). Subgroups a and b were intended to cover DE genes found by
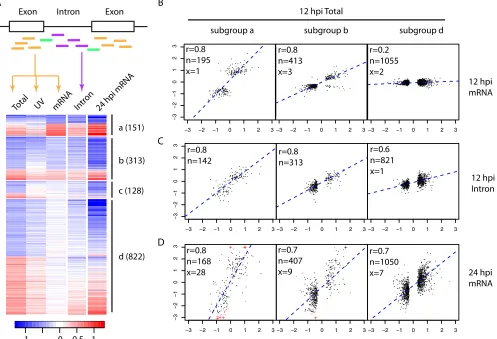
mRNAseq (a) or likely found by mRNAseq (b), and subgroup c was for genes inherently not well detected by mRNAseq, e.g., poly(A)⫺transcripts. Interestingly, for both subgroups a and b, the expression changes at 12 hpi measured by mRNAseq versus by Total RNAseq were highly consistent (Fig. 2B). Again, this agree-ment verifies the significant expression changes at 12 hpi detected by Total RNAseq.
To investigate the reasons for the apparent discrepancies
be-tween mRNAseq and Total RNAseq for subgroup d (Fig. 2B), we
counted reads mapped to introns for each gene and performed differential expression analysis in the same way as we did for reads mapped to exons. We reasoned that the additional immature tran-scripts captured by Total RNAseq could drive the observed differ-ences (5,6). Intriguingly, for subgroup d, the expression changes measured by reads mapped to introns were positively correlated (r⫽0.6) with the expression changes measured by reads mapped to exons (Fig. 2C). In addition, 12 hpi expression changes were posi-tively correlated (r⫽0.7) with expression changes at 24 hpi. This indicates that for subgroup d, transcriptional changes that occurred at 12 hpi did not affect the amount of mature mRNAs until a later time point such as 24 hpi (Fig. 2D). A similar trend was also evident for subgroup b, suggesting that mature mRNAs in this subgroup were affected by transcriptional changes observed at 12 hpi by Total RNAseq, but not as significantly as for genes in subgroup a (Fig. 2C). To investigate if these subgroups represent distinct biological
functions, we identified biological functions significantly enriched in all 12 hpi DE genes. For each enriched function, we then tabu-lated the number of genes from each subgroup. In total, we found 14 major biological functions enriched in 12 hpi DE genes (see Table S2 in the supplemental material). For most of these 14 en-riched functions, genes spread across multiple subgroups, but with different degrees of relative contributions from each sub-group. For example, subgroup a had relatively more genes related to T-cell differentiation, while genes associated with mitochon-drial dysfunction or CTLA4 signaling tended to be from subgroup d (see Fig. S4 in the supplemental material). This suggests that genes across different subgroups were part of the same biological processes but regulated distinctly as illustrated by different pat-terns of expression changes. In summary, by contrasting Total RNAseq and mRNAseq measurements, we show that thousands of
host genes in CD4⫹T cells had undergone significant
transcrip-tional changes as early as 12 hpi, but for most of these genes, changes in the abundance of mature mRNAs were not detected until 24 hpi.
The initiation of many of the HIV-mediated early host tran-scriptional changes, including the suppression of genes associ-ated with T cell functionality, is not dependent upon viral rep-lication.To investigate the mechanisms driving the expression changes observed at 12 hpi, we evaluated the expression changes in SUP-T1 cells treated with UV-inactivated, nonreplicating HIV virions. We performed this experiment because the interaction of cells with nonreplicating HIV virions (or HIV envelope protein gp120 alone) can trigger many intracellular molecular events (30,
31). Strikingly, nonreplicating HIV virions induced expression
changes similar to those of intact HIVs at 12 hpi, though the
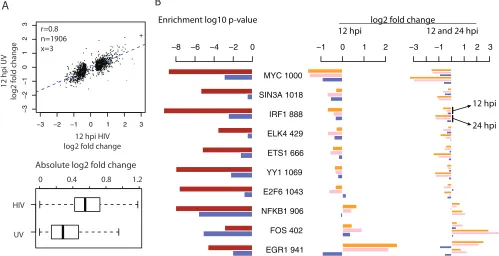
mag-nitude of expression changes was smaller (Fig. 3A). Functional
enrichment analysis also showed that similar functional categories (such as T cell functionality) were enriched in the two lists of DE genes (see Table S3 in the supplemental material). These results indicate that the initiation of early host responses to HIV-1 infec-tion in CD4⫹T cells was largely independent of viral replication. To investigate if any master regulators were driving the early host transcriptional changes, we searched for transcription factors (TFs) with binding sites enriched in the promoters of 12 hpi DE genes. Using the large-scale TF CHiP-seq data from ENCODE
(23), we found that the binding sites of 58 TFs were enriched
(hypergeometric testPvalue,⬍0.01) in the promoters of the 12
hpi DE genes. Clustering analysis indicated that the binding sites of some of these TFs tended to co-occur in the promoters of dif-ferent subsets of 12 hpi DE genes (see Fig. S5 in the supplemental material), suggesting that some TFs functioned together. Alterna-tively, the enrichment of binding sites of nonfunctional TFs could be merely due to the co-occurrence of their binding sites in the same promoters along with that of some other functional TFs.
Next, we explored if any of these enriched TFs were associated with the transcriptional changes induced by both the intact HIV-1 and UV-inactivated viruses. We examined 10 enriched TFs from subgroups a and b of 12 hpi DE genes as described above. Since the levels of mature mRNAs encoding these transcription factors also changed at 12 hpi, we reasoned that their regulatory activities were also more likely to be modulated. Together, these 10 TFs had at least one binding site in 75% (1,446/1,933) of 12 hpi DE genes, indicating their broad regulatory impacts on the early transcrip-tional changes. Among them, MYC was the most downregulated TF at 12 hpi in samples from HIV-1-infected cells and in samples
on November 7, 2019 by guest
http://jvi.asm.org/
from cells treated with UV-inactivated virions and had binding sites in the promoters of one-half (1,000/1,933) of the 12 hpi DE genes (Fig. 3B). MYC binding sites were also enriched in the DE genes derived from cells treated with UV-inactivated virions at 12 hpi, consistent with HIV-1 gp120 downregulation of MYC
pro-teins in human mesangial cells (32). NFKB1 and FOS are two
other enriched TFs with documented interactions with gp120 (33), and the expression changes of FOS in cells treated with UV-inactivated virions were in the same direction as in HIV-1-in-fected cells. The genes encoding two additional TFs, YY1 and ELK4, were among the genes differentially expressed in primary
peripheral blood mononuclear cells treated with gp120 (31).
However, EGR1 was the most upregulated TF in HIV-1-infected cells but was downregulated in cells treated with UV-inactivated virions, even though EGR1 binding sites were enriched in both cases, indicating that additional regulation likely occurred during
intact HIV-1 virus infection. To the best of our knowledge, this is the first report that contrasts the host response to intact HIV-1 viruses versus nonreplicating virions by whole-transcriptome analysis. The results show that the initiation of many of the early host responses was regulated in a replication-independent man-ner, involving master transcription factors likely triggered by early interactions between HIV-1 and host proteins.
Long noncoding RNAs are associated with HIV-mediated
early host transcriptional changes. Long ncRNAs (lncRNAs)
have emerged as a new class of important regulators in various diseases, including HIV-1 infection (34). Compared to our prior
analysis of mRNAseq data (1), here we identified many more
(1,098) DE lncRNAs (Table 1), due to the expanded lncRNA
an-notation and the added Total RNAseq data. To better evaluate the kinetics of lncRNA expression changes, we used qPCR to profile 11 annotated lncRNAs along with 8 newly identified intergenic −3 −2 −1 0 1 2 3
−3
−2
−1
0
1
2
3
subgroup a
−3 −2 −1 0 1 2 3 subgroup b
−3 −2 −1 0 1 2 3 subgroup d
−3 −2 −1 0 1 2 3 −3 −2 −1 0 1 2 3 −3 −2 −1 0 1 2 3
−
3
−
2
−
1
0123
12 hpi mRNA
++ +
+ +
+ +
+
−3 −2 −1 0 1 2 3
−
3
−
2
−
1
0123
+
+
−3 −2 −1 0 1 2 3 −3 −2 −1 0 1 2 3
12 hpi Intron
24 hpi mRNA r=0.8
n=195 x=1
r=0.8 n=413 x=3
r=0.2 n=1055 x=2
r=0.8 n=142
r=0.8 n=313
r=0.6 n=821 x=1
r=0.8 n=168 x=28
r=0.7 n=407 x=9
r=0.7 n=1050 x=7 12 hpi Total
A B
C
D
Exon Intron Exon
-1 0 0.5 1
a (151)
b (313)
c (128)
d (822) 24 hpi mRNA Total UV mRNA Intr
on
FIG 2Comparison of expression changes at 12 hpi measured by Total RNAseq versus mRNAseq. (A) Genes (rows of the heatmap) differentially expressed at 12 hpi were divided into four subgroups (a to d) as described in the text. The numbers of genes in each subgroup are in parentheses. Colors represent log2
infection/mock ratios, blue for downregulation and red for upregulation. The columns are infection/mock ratios for Total RNAseq of HIV infection (Total), Total RNAseq of cells treated with UV-inactivated virions (UV), mRNAseq of HIV infection (mRNA), intronic read counts from Total RNAseq of HIV infection (Intron) at 12 hpi, and mRNAseq of HIV infection at 24 hpi (24 hpi mRNA). To assist the visualization of intronic results, the heatmap shows only 1,414 genes with introns detected (at least 10 reads in at least 3 samples) at 12 hpi by Total RNAseq (Fig. S3 in the supplemental material shows a heatmap with all 1,933 DE genes). The scatterplots of panels B to D are based on the full list of DE genes at 12 hpi. (B to D) Scatterplots between log2infection/mock ratios by 12 hpi Total
RNAseq (xaxis) versus that by 12 hpi mRNAseq (B,yaxis), intronic read counts from 12 hpi Total RNAseq (C,yaxis), and 24 hpi mRNAseq (D,yaxis), separately for subgroups a, b, and d. In the top left corner of each scatterplot, the Pearson correlation coefficient (r) and the numbers of genes included in (n, black) or excluded from (x, red) the calculation of correlation are given. The exclusion criterion was a log2infection/mock ratio difference larger than 4. A log2
infection/mock ratio larger than 3 was truncated to 3 and is indicated with the symbol “⫹.”
on November 7, 2019 by guest
http://jvi.asm.org/
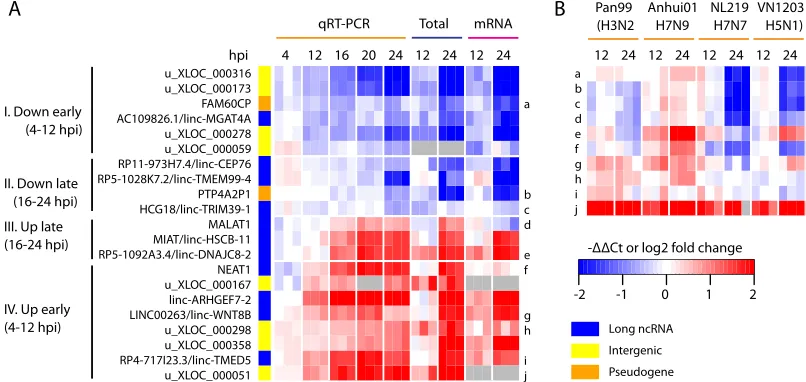
[image:7.585.47.544.71.410.2]loci and 2 annotated pseudogenes across a finer time course of
HIV-1 infection (Fig. 4A). As expected, all examined lncRNAs
were significantly differentially expressed at 24 hpi, confirming the RNAseq results. Overall, the expression of these lncRNAs tended to be monotonically up- or downregulated throughout the course of HIV-1 infection. Interestingly, even with this small set of lncRNAs, we observed four distinct expression change patterns, separated by the earliest time point showing significant change (t
testPvalue,⬍0.05) and the direction of expression change (Fig. 4A), indicating that the expression of these lncRNAs was tightly regulated during HIV-1 infection.
To investigate if the differential expression of these lncRNAs was exclusive to HIV-1 infection, we profiled a subset of these same lncRNAs in human airway epithelial cells infected with one of four strains of influenza virus, including highly pathogenic H5N1 and recent H7N9 viruses. Surprisingly, almost all of these lncRNAs were significantly differentially expressed during at least one of the influenza infections, and the directions of expression changes induced by influenza viruses were mostly similar to that in HIV-1 infection (Fig. 4B). These results indicate that many of the lncRNAs differentially expressed during HIV-1 infection are likely related to certain host responses triggered during different virus infections.
Next, we investigated how lncRNAs were involved in the early host response, given that there were 98 lncRNAs significantly
dif-ferentially expressed at 12 hpi. For this, we performed lncRNA function prediction by a “guilt-by-association” analysis similar to that described in reference35. We first obtained a collection of human tissue mRNAseq data (21), which allowed us to recalculate the expression of protein-coding and -noncoding genes consis-tently, in the same samples, and with the same annotation used here. Next, for each 12 hpi DE lncRNA, we calculated the correla-tions of the lncRNA tissue expression levels to protein-coding genes. We then applied gene set enrichment analysis (GSEA) to identify functional categories enriched in highly correlated pro-tein-coding genes to infer the biological functions associated with the lncRNA. As shown in Fig. S6A in the supplemental material, individual lncRNAs were strongly associated with the functions enriched in 12 hpi DE genes such as T cell functionalities and mitochondrial dysfunction. These results indicate that these less-studied lncRNAs are actually part of the early host response to HIV-1 infection.
To explore how lncRNA differential expression was regulated, we performed a similar TF binding site enrichment analysis on all DE lncRNAs (see Materials and Methods). We found that 12 TF
binding sites were enriched (P⬍0.05) in the promoters of DE
lncRNAs but not in non-DE lncRNAs (see Fig. S6B in the supple-mental material). Among the TFs identified, BCL11A is involved in negative regulation of gene expression and T cell differentiation (Gene Ontology annotation). Interestingly, three of the TFs, JUN, +
−3 −2 −1 0 1 2 3
−
3
−
2
−
1
0123
12 hpi HIV log2 fold change r=0.8
n=1906 x=3
12 hpi UV
log2 f
old change
A
Absolute log2 fold change
HIV
UV
0 0.4 0.8 1.2
−8 −6 −4 −2 0
MYC 1000
SIN3A 1018
IRF1 888
ELK4 429
ETS1 666
YY1 1069
E2F6 1043
NFKB1 906
FOS 402
EGR1 941
−1 0 1 2 −3 −1 1 2 3
12 hpi
24 hpi Enrichment log10 p-value log2 fold change 12 hpi 12 and 24 hpi
B
FIG 3Comparisons of expression changes induced by intact HIV-1 infection versus treatment with UV-inactivated virions at 12 hpi and enriched TFs. (A) Top, scatterplot of infection/mock ratios in cells infected by intact HIV-1 (xaxis) versus treated with UV-inactivated virions (yaxis) for 12 hpi DE genes. In the top left corner, the Pearson correlation coefficient (r) and the numbers of genes included in (n, black) or excluded from (x, red) the correlation analysis are given. The exclusion criterion was a log2infection/mock ratio difference larger than 4. A log2infection/mock ratio larger than 3 was truncated to 3 and is indicated with the
symbol “⫹.” Bottom, boxplots of the absolute values of log2ratios shown above. For the boxplot, the whiskers extend to the most extreme data point, which is
no more than 1.5 times the interquartile range from the box. (B) Enrichment of TFs in the promoters of DE genes detected in cells infected by intact HIV-1 viruses versus treated by UV-inactivated virions at 12 hpi. Left, enrichmentPvalues of 10 TFs using DE genes separately from HIV-1 infection (brown) and the treatment with UV-inactivated virions (blue) at 12 hpi. Next to each TF name is the number of 12 hpi DE genes with its binding sites. Middle, the log2infection/mock ratios
of enriched TFs at 12 hpi, in the order of mRNAseq, Total RNAseq, and UV-inactivated virions. Right, the log2infection/mock ratios of enriched TFs at both 12
and 24 hpi, showing that in general the increased changes at 24 hpi during HIV-1 infection were absent in the treatment of UV-inactivated virions.
on November 7, 2019 by guest
http://jvi.asm.org/
[image:8.585.43.542.73.329.2]FOS, and FOSL1, are related to the AP-1 complex, and the genes encoding these TFs were upregulated at 24 hpi. AP-1 is composed of a mixture of homo- and heterodimers formed between Jun and Fos proteins, and the upregulation of AP-1 during HIV infections and its interaction with various HIV proteins have been
exten-sively studied (33). The enrichment of AP-1 binding sites in
lncRNAs has also been observed recently (36,37), and our results show that AP-1 regulates lncRNAs in a specific context, i.e., HIV-1-infected CD4⫹T cells. Overall, this analysis indicates that many of the DE lncRNAs were likely direct targets of transcription fac-tors, providing an alternative mechanism to connect these less-studied lncRNAs with other functions.
Use of Connectivity Map data to refine predicted transcrip-tion factor regulatranscrip-tion of the early host response.Through the computational analyses above, we predicted specific TFs and lncRNAs as regulators of early host transcriptional changes. To assess and refine our predictions, we searched a large collection of drug transcriptional signatures in cell lines using Connectivity Map (cmap) (26), to see if any drug could reverse the expression changes induced by HIV-1 infection at 12 hpi. We reasoned that if our predicted regulatory relationships were robust, we would likely observe reversed expression changes in targets when the direction of expression change in the corresponding regulator was flipped. With a query signature, here the 500 most upregulated and 500 most downregulated genes at 12 hpi, cmap returned drugs that induced similar and opposite transcriptional changes relative to the query gene signature. We then looked for specific drugs with high negative connectivity scores, an indication that the drug re-versed the expression changes induced by HIV-1 infection. Lyco-rine, the highest-ranked drug with a negative connectivity score, had an average connectivity score of⫺0.699 over 5 different tests, ranging from⫺0.629 to⫺0.860 (see Table S4 in the supplemental material). Within the list of the top 20 ranked drugs, 5 other drugs
also had negative connectivity scores: carbimazole (⫺0.537),
gabazine (SR-95531) (⫺0.416), methiazole (Prestwick-1080)
(⫺0.263), diazoxide (⫺0.334), and theobromine (⫺0.385).
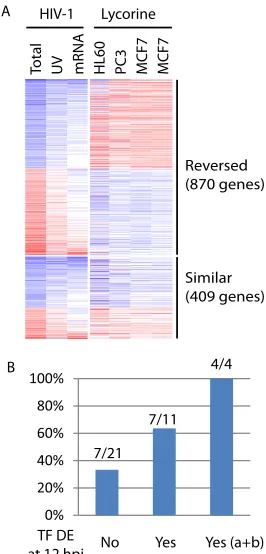
Next, we compared the actual gene expression changes in-duced by lycorine against that by HIV-1 infection at 12 hpi. Of the 1,279 genes differentially expressed at 12 hpi during HIV-1 infec-tion that had common identifiers mapped across the RNAseq and microarray platforms, most (68%, 870) had reversed expression
changes (Fig. 5A). This list of genes with reversed expression
changes included 32 TFs (of the 58 identified above) with binding sites enriched in the promoters of 12 hpi DE genes. For each of these 32 TFs, we then evaluated if its predicted targets were en-riched in the genes with reversed expression changes, indicating that the predicted TF-target relationships were recapitulated here. In total, 14 (44%) of 32 TFs had their predicted targets enriched
(hypergeometric testPvalue,⬍0.05) in the genes with reversed
expression changes (see Table S5 in the supplemental material). Interestingly, those TFs which themselves were also differentially expressed at 12 hpi during HIV-1 infection tended to be more likely to have targets enriched in genes with reversed expression changes (Fig. 5B). Specially, all 4 (100%) TFs that had mRNA level changes at 12 hpi (subgroups a and b shown inFig. 2) had targets enriched in the genes with reversed expression changes. There-fore, the use of both mRNA differential expression and binding site enrichment at 12 hpi significantly improved the precision of our TF predictions. We then pruned the initial list of 58 enriched TFs to those 10 TFs that already covered most (75%) of the 12 hpi DE genes as noted above.
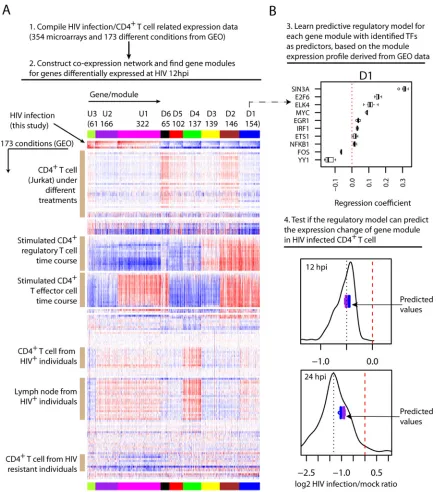
Derivation of regulatory programs to predict the early host transcriptional changes upon HIV-1 infection.Next, we investi-gated how these computationally identified TFs could regulate the observed early host response. To do so, we first compiled a com-pendium of human expression data that are related to HIV
infec-tion and/or CD4⫹T cells (354 microarrays of a single platform
from GEO; see Table S6 in the supplemental material). Using this compendium of expression data (without the RNAseq data col-lected in this study), we then constructed a coexpression network (24) for the genes that were identified above as differentially ex-pressed at 12 hpi during HIV infection. From the coexpression
net--2 -1 0 1 2 -ΔΔCt or log2 fold change I. Down early
(4-12 hpi)
II. Down late (16-24 hpi) III. Up late (16-24 hpi)
IV. Up early (4-12 hpi)
hpi 4 12 16 20 24 12 24 12 24 qRT-PCR Total mRNA
u_XLOC_000316 u_XLOC_000173 FAM60CP AC109826.1/linc-MGAT4A u_XLOC_000278 u_XLOC_000059 RP11-973H7.4/linc-CEP76 RP5-1028K7.2/linc-TMEM99-4 PTP4A2P1 HCG18/linc-TRIM39-1 MALAT1 MIAT/linc-HSCB-11 RP5-1092A3.4/linc-DNAJC8-2 NEAT1 u_XLOC_000167 linc-ARHGEF7-2 LINC00263/linc-WNT8B u_XLOC_000298 u_XLOC_000358 RP4-717I23.3/linc-TMED5 u_XLOC_000051
Long ncRNA Intergenic Pseudogene
(H3N2 H7N9 H7N7 H5N1) Pan99 Anhui01 NL219 VN1203
12 24 12 24 12 24 12 24
A
B
a b c d e f g h i j a
b c d
e f
g h
i j
FIG 4Long ncRNAs differentially expressed in HIV-1-infected CD4⫹T cells. (A) Temporal expression profiles of lncRNA, pseudogene, and unannotated intergenic transcripts during HIV-1 infection. Red on the heatmap indicates upregulation during HIV-1 infection, and blue indicates downregulation. Genes were clustered based on the earliest time point at which significant differential expression was detected by qPCR (ttestPvalue,⬍0.05). (B) qPCR measurements of temporal expression changes of a subset of ncRNAs shown in panel A (letter or number labels on the right of the heatmap) in human airway epithelial cell line Calu-3 cells infected with one of four strains of influenza A virus, each from a different serotype as shown in parentheses.
on November 7, 2019 by guest
http://jvi.asm.org/
[image:9.585.90.493.69.260.2]work, we identified 9 gene modules, i.e., clusters of highly intercon-nected genes. In total, 1,614 of 1,933 12 hpi DE genes were covered by the microarray platform, 1,292 of which were covered by 9 gene mod-ules together. As shown inFig. 6A, genes within each module had highly similar expression profiles across different conditions, and each module represented a distinct expression profile.
Both the patterns and the specific conditions of expression changes of gene modules offered additional insights into the reg-ulation of genes perturbed during HIV-1 infection (Fig. 6A). For
example, across both CD4⫹T cell activation time courses, the
genes in the module D1 were upregulated, but the genes in the module D4 were downregulated, suggesting that genes in both modules are related to CD4⫹T cell activation but regulated dif-ferently. Further, both modules tended to be upregulated in CD4⫹ T cells and lymph nodes isolated from HIV-infected patients, though more obviously for the module D4, indicating that the expression of these genes is also perturbedin vivo. Genes in the
module U1 also tended to be upregulated in CD4⫹T cells and
lymph nodes isolated from HIV-infected patients. However, their
expression changes in two types of activated CD4⫹T cells were
opposite: downregulated during regulatory T cell activation but upregulated during T effector cell activation, suggesting that the upregulation of these genes during HIV-1 infection is likely driven by regulatory mechanisms similar to those that occur during T effector cell activation. Interestingly, the genes of this
module also had a tendency to be downregulated in the CD4⫹
T cells from HIV-resistant patients, hinting that reversing their upregulation upon HIV infection might confer resistance to infection.
Next, we explored if the identified TFs could predict the ex-pression changes of gene modules during HIV infection, a strong indication of their regulatory roles. To do so, for each gene model we attempted to learn a predictive model from this compendium of expression data. Then, we used the learned model to predict the overall expression changes of the gene module during HIV-1 in-fection, with identified TFs as predictors. To derive the predictive model, we used a machine learning procedure called elastic net (28), which automatically selects relevant features from high-di-mensional data and generates a predictive model with the lowest error through cross-validation. Here, we used 10-fold cross-vali-dation, i.e., the samples were randomly partitioned into 10 sets, of which 9 sets were used to learn a predictive model, which was subsequently used to blindly predict the outcome in the 10th set. This process was repeated iteratively 10 times, and the model with the minimum mean cross-validation error was identified and sub-jected to the predictability assessment.
For each gene module, we built predictive models with those 10 identified TFs as candidate predictors and the median expression change of genes of the module as the response variable (Fig. 6B, step 3; see also Fig. S7 in the supplemental material). Very prom-isingly, we found that for all 6 downregulated gene modules, the learned models correctly predicted their downregulation (Fig. 6B, step 4; see also Fig. S8 and S9 in the supplemental material), and 3 of them had predicted values very close to the median expression change, the metric used to learn the predictive model. For com-parison, we expanded the set of candidate predictors to all 115 annotated TFs and lncRNAs that were identified as differen-tially expressed 12 hpi during HIV infection and covered by the microarray platform. Interestingly, the models learned with the expanded set of candidate predictors generated similar pre-dicted values for these 6 gene modules (Fig. 6B, step 4; see also Fig. S8 and S9 in the supplemental material), indicating that the small set of identified TFs was sufficient to achieve optimal predictability. However, for the module U1, the models de-rived from the expanded set of candidate regulators did cor-rectly predict its upregulation at 12 hpi (see Fig. S8 in the supplemental material), indicating that more regulators re-main to be identified in addition to those 10 TFs that were selected for this gene module. Across the predictive models of different gene modules, the common TFs tended to have varied regression coefficients (see Fig. S7 in the supplemental mate-rial), representing different configurations of multiple tran-scription factors for synergistic control of each gene module. For example, YY1 had the most negative regression coefficients for the module U1, indicating that it negatively regulates the module’s expressions. But YY1 had the most positive regres-sion coefficients for modules D4, D5, and D6, an indication of strong positive regulatory effects. ELK4 and ETS1 were not selected for module D4, suggesting no or very little regulatory effect, but they had relatively large regression coefficients for Reversed
(870 genes)
Similar (409 genes) HIV-1 Lycorine
To
tal
UV mRNA HL60 PC3 MCF7 MCF7
7/21 7/11
4/4
TF DE at 12 hpi
0% 20% 40% 60% 80% 100%
No Yes Yes (a+b) A
B
FIG 5Assessment of TF predictions for HIV-1 infection. (A) Side by side comparison of expression changes induced by HIV-1 infection (12 hpi) or by lycorine treatment. Colors represent log2infection/mock or treatment/
control ratios: blue for downregulation and red for upregulation. Columns represent individual conditions: Total RNAseq of HIV-1 infection (Total) or UV-inactivated virion treatment (UV), mRNAseq of HIV-1 infection (mRNA), and lycorine treatment of three different cell lines (one repeat for MCF7). Lycorine-induced expression profiles were from Connectivity Map. (B) Percentages of 32 identified TFs that themselves had reversed expression changes after lycorine treatment also had targets enriched in genes with reversed expression changes after lycorine treatment. These 32 TFs were grouped into three bins based on their own DE results at 12 hpi: not DE (No), DE (Yes), and DE and subgroups a and b shown inFig. 2[Yes (a⫹b)], which is a subset of DE (Yes).
on November 7, 2019 by guest
http://jvi.asm.org/
[image:10.585.97.230.66.343.2]FIG 6Gene module construction, regulatory model learning, and validation. (A) Identification of gene modules through coexpression network analysis. Top, computational approach for gene module identification. Bottom, expression profile overview of gene modules. The rows of the heatmap are experimental conditions with labels for selected conditions on the left. The HIV-1-induced expression changes measured in the present study are shown in the following order (top to bottom): 12 hpi Total RNAseq, 12 hpi UV-inactivated virions, 12 hpi mRNAseq, and 24 hpi mRNAseq. The columns are genes, and their assignment to each gene module is highlighted by the top colored band (repeated at bottom). The size and name of each gene module are shown above the colored band. (B) Learning and validation of regulatory models for gene modules. Top, an example showing the regression coefficients of the predictive models learned for gene model D1 with 10 identified TFs as candidate regulators (the dotted line indicates a regression coefficient value of zero). To assess if the learning and evaluation were robust, we randomly divided the 173 conditions/samples into 10 subsets and learned 10 predictive models, but leaving out one of the subsets each time (as described in the text). The boxplot for each TF shows the distribution of its regression coefficients across the 10 predictive models. For the boxplot, the whiskers extend to the most extreme data point, which is no more than 1.5 times the interquartile range from the box. Bottom, comparison of the predicted values and the measured expression changes for gene module D1 during HIV-1 infection, separately at 12 hpi (Total RNAseq) and 24 hpi (mRNAseq). Each of the 10 learned models generated one predicted expression change for the gene module. The boxplot in purple shows the spread of 10 predicted values from the models using 10 identified TFs as candidate regulators, and the boxplot in blue shows the models with the expanded set of 115 candidate regulators (102 TFs and 13 lncRNAs) as predictors. The black line shows the distribution of measured expression changes of genes in module D1, with the black dotted line indicating the median expression change and the red dashed line indicating no change.
on November 7, 2019 by guest
http://jvi.asm.org/
[image:11.585.75.511.64.556.2]modules D2, D3, and D6, an indication of large effects there. In summary, these results provide additional evidence that the computationally identified TFs are likely regulators, and they provide novel insights into the modular regulation of the early transcriptional changes induced by HIV infection.
Lycorine, a drug identified using a host transcriptional sig-nature, potently inhibits HIV-1 replication in CD4ⴙT cells.As shown above, the enrichment of relevant TFs was based on the prediction that lycorine could reverse the majority of the host
transcriptional changes in CD4⫹T cells induced by HIV-1
infec-tion. The gene module analysis indicated that reversed host ex-pression changes might be associated with HIV resistance
(mod-ule U1 in Fig. 6). We therefore reasoned that lycorine should
inhibit HIV-1 infection, and we tested this prediction
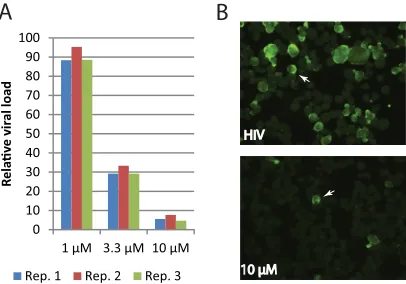
experimen-tally. As shown inFig. 7A, a diminishing amount of HIV-1 viral
RNAs was detected in SUP-T1 cells treated with increasing con-centrations of lycorine, from about 10% loss at 1M lycorine to over a 90% viral load loss in cells treated with 10M lycorine. Striking differences in viral loads were also visible by comparing
the amount of Gag staining in cell smears (Fig. 7B). Strong to
moderate staining of Gag antigen was present in approximately one-quarter of untreated cells, while less than one percent of cells
treated with 10M lycorine showed Gag staining. Further
analy-ses showed that the decrease of HIV-1 viral loads was not the result of direct killing of host cells by lycorine, while lycorine had inhibitory effect on cell proliferation (see Fig. S10 in the supplemental material). A manual search in PubChem (SID 56463667) showed that lycorine can target many host genes, such as SMAD3 gene, which is annotated as a negative regula-tor of cell proliferation. Lycorine also inhibits NFKB activation in T cells (PubChem CID 11972533; AIDs 489035, 489041, and 489033) and NFKB was upregulated here and identified as a
regulator (Fig. 3). More studies are needed to elucidate the
detailed mechanism driving lycorine’s inhibitory effect on HIV-1 infection, but these results convincingly demonstrate
the relevance of using the combined total and mRNA transcrip-tome analysis to fully capture the early host response and the feasibility of developing host-based therapies for HIV-1 infec-tion through systems analysis of the host response.
DISCUSSION
Due to technical constraints, the relevance of unconventional
transcripts, such as long ncRNAs and poly(A)⫺transcripts, to
HIV infection has not been systematically investigated. Here, we used RNAseq to generate an unbiased profiling of host transcrip-tome changes in response to HIV infection. The uniqueness of our approach is that we combined mRNAseq and Total RNAseq to quantify both poly(A)⫹and poly(A)⫺transcripts, in contrast to
standard transcriptome analysis focusing on poly(A)⫹ mature
mRNAs using microarray or mRNAseq. Through a side-by-side comparison, we showed that HIV-1 infection induced the differ-ential expression of many poly(A)⫺transcripts, which were accu-rately detected by Total RNAseq but not by the more frequently used mRNAseq. Since most annotated human genes transcribe both poly(A)⫹and poly(A)⫺transcripts (4), targeting only the
poly(A)⫹fraction significantly compromises transcriptome
anal-ysis due to incomplete coverage. As evident here, one big challenge for Total RNAseq is the need to deplete abundant rRNAs. Fortu-nately, protocols for more-efficient rRNA depletion have been developed, which will considerably improve Total RNAseq cover-age of nonribosomal transcripts.
Combined Total RNAseq and mRNAseq analysis revealed the striking finding that Total RNAseq detected a widespread early host response to HIV-1 infection at 12 hpi that was not detected by mRNAseq. Our analysis indicated that the discrepancy was driven mainly by nascent transcripts captured by Total RNAseq and the detectable delay between pre-mRNA transcription initiation and the production of mRNAs at the 12 h time point. Several recent studies have shown that a clearly detectable lag exists between pre-mRNA and mRNA production in response to stimuli such as LPS or TNF activation of macrophages (6,7) or epidermal growth factor stimulation of epithelial cells (8). The observation that splicing is a significant factor contributing to the delay between
pre-mRNA and mRNA production (6,7) is particularly notable
since HIV-1 infection can modulate host RNA splicing machiner-ies (1,9). These findings suggest that the analyses of nascent tran-scripts will likely offer a more accurate picture of the kinetics of transcriptional induction than mRNA analyses in the case of HIV-1 infection.
The discovery of large numbers of differentially expressed lncRNAs during HIV-1 infection presents new challenges and op-portunities in AIDS research. Zhang et al. reported that the
knock-down of the lncRNA NEAT1, also upregulated here (Fig. 1D),
enhanced HIV-1 production by increasing the export of Rev-de-pendent instability element-containing HIV-1 mRNAs from the nucleus to the cytoplasm (34). This example clearly demonstrates the relevance of lncRNAs to HIV-1 infection, but more-systematic approaches are needed to efficiently prioritize lncRNAs for mech-anistic studies. Here, we leveraged a human tissue expression compendium to infer lncRNA function through correlated ex-pression of functionally annotated genes. The effectiveness of this guilt-by-association strategy has been illustrated previ-ously, using expression data collected from custom-designed
ncRNA microarrays (35) or simply reannotating existing
mi-croarrays (38). With RNAseq or comparable technologies,
fu-HIV HIV
10 μM 10 μM
0 10 20 30 40 50 60 70 80 90 100
1 µM 3.3 µM 10 µM
R
ela
v
e v
ir
al
lo
ad
Rep. 1 Rep. 2 Rep. 3
A
B
FIG 7Lycorine inhibits HIV-1 viral replication. (A) Relative viral loads in HIV-1-infected cells treated with lycorine. SUP-T1 cells were infected with HIV-1 LAI at a multiplicity of infection (MOI) of 0.1 for 1 h. After washing away the virus inoculum, cells were suspended in medium containing DMSO or lycorine and cultured for 24 h. Viral load was quantified by qPCR with GAPDH as internal control. The relative viral load in cells treated with lycorine was calculated as the percentage of the viral load in similarly infected cells without drug (DMSO only). (B) Gag staining of cell smears from untreated (top, DMSO) and treated (bottom, 10M lycorine) samples collected at 24 hpi showing HIV-1 infection. To guide visualization, one HIV-1-infected cell is highlighted by a white arrow in each image.