R
ecent attention has focused on the emerging epidemic of cardiovascular disease in developing nations, and the role hypertension may play.1 While Australia as a nation fulfils The World Bank’s definition of a high income country (well surpassing the gross national income per head cut-off of US$12,476),2 significant inequality exists within the Australian population. Australia’s two Indigenous populations (Aboriginal people and Torres Strait Islanders) experience inequality related to income, education and health and this disparity is magnified for remote-living Indigenous populations. According to the 2008 National Aboriginal and Torres Strait Islander Social Survey, the median personal gross annual income for Aboriginal people and Torres Strait Islanders living in remote Australia was the equivalent of US$14,020 and 28% reported running out of money for basic living requirements in the previous 12 months.3Life expectancy for the Aboriginal and Torres Strait Islander population lies 10–11 years below the general Australian population.4 The cause of this life expectancy differential is heterogenous and complex. A history of colonisation, racism and familial separation underpins current disadvantage and there are additional disparities in access to healthcare.4-6
Cardiovascular and renal diseases contribute substantially to the discrepancy in life expectancy with Indigenous Australians experiencing higher rates and at a younger age.4,7-9 Their precursors (hypertension,
albuminuria, obesity and diabetes) are known to be common in Indigenous adults.4,10,11 Contrasting with this picture of chronic disease risk in adults, Indigenous and non-Indigenous Australian children have been reported to not differ in the prevalence of persistent chronic disease risk – in particular hypertension, albuminuria and obesity12,13 – although one small study found that 36% of a sample of Aboriginal and Torres Strait Islander children aged 5–14 years attending
for health checks in an urban setting were overweight or obese, a higher percentage than was reported for the general population of Queensland children aged 5–17 years (21.1% ).14
The epidemiology of cardiovascular disease in the Australian Indigenous population has been rapidly evolving over recent decades as a consequence of major social change, including the shift to Western diets and more sedentary living.15 The prevalence of chronic
Hypertension: high prevalence and a positive
association with obesity among Aboriginal and
Torres Strait Islander youth in far north Queensland
Danielle Esler,
1Alexandra Raulli,
2Rohan Pratt,
3Patricia Fagan
41. College of Public Health Medical and Veterinary Sciences, James Cook University, Queensland 2. Public Health, ACT Health, Australian Capital Territory
3. Cairns and Hinterland Hospital and Health Service, Queensland Health
4. Tropical Medicine and Rehabilitation Sciences, Public Health, James Cook University, Queensland
Correspondence to: Dr Danielle Esler, James Cook University, c/o 12 Pickworth Court, Rosanna, Vic 2084; e-mail: danielleesler@hotmail.com Submitted: September 2014; Revision requested: November 2014; Accepted: February 2015
This is an open access article under the terms of the Creative Commons Attribution-NonCommercial-NoDerivatives License, which permits use and distribution in any medium, provided the original work is properly cited, the use is non-commercial and no modifications or adaptations are made.
The authors have stated they have no conflict of interest.
Aust NZ J Public Health. 2016; 40 (Suppl. 1) S65-S69; doi: 10.1111/1753-6405.12401
Abstract
Objective: Hypertension and other chronic disease risks are common among Aboriginal and Torres Strait Islander adults but there is little evidence regarding the epidemiology of these risk factors during adolescence. This study examines the prevalence of pre-hypertension, hypertension and other cardiovascular risk factors in Aboriginal and Torres Strait Islander people aged 15–24 years living in remote Indigenous communities in north Queensland. In so doing, it aims to better inform the approach to cardiovascular disease in this population. Methods: This is a descriptive study that retrospectively examines health service data from a program of community screening, the Young Persons Check (YPC). Participants were 1,883 Aboriginal and Torres Strait Islander people aged 15–24 years who attended for a YPC in 11 remote communities in north Queensland between March 2009 and April 2011.
Results: Overall, the prevalence of pre-hypertension was 34.0%; stage I hypertension was 17.7% and stage II hypertension was 3.3%. The prevalence of elevated waist circumference was 47.6%, overweight or obesity 45.9%, elevated triglycerides 18.3%, decreased HDL 54.8% and proteinuria 24.3%. The prevalence of hypertension (stage I or II) among Torres Strait Islander males was 34.1%, Aboriginal males 26.9%, Torres Strait Islander females 12.6% and Aboriginal females 13.0%. Hypertension was associated with sex (males) (OR= 4.37, p<0.000), overweight (OR=2.46, p<0.000), obesity (OR=4.59, p<0.000) and elevated triglycerides (OR=2.38, p<0.000). Conclusion:Pre-hypertension, hypertension and other cardiovascular risk in this population is highly prevalent. Hypertension was particularly prevalent among male participants. The results reiterate the importance of early life experience in cardiovascular disease prevention.
diseases in remote Australian Indigenous populations is high;16 for example, diabetes prevalence in Torres Strait Islanders (>/=15 years) is 26%17 and self-reported diabetes was almost twice as prevalent among remote-living Indigenous participants in the National Aboriginal and Torres Strait Islander Health Survey.18 There is little published evidence regarding the onset and distribution of cardiovascular disease risk factors during Indigenous adolescence and young adulthood.
Pre-hypertension is described as representing the ‘grey zone’ between normal blood pressure and hypertension. A person with pre-hypertension is 3.5 times more likely to have a myocardial infarction and 1.7 times more likely to have coronary artery disease compared with someone with normal blood pressure.19 There are no published reports exploring pre-hypertension for any Aboriginal and Torres Strait Islander populations. The objective of this study was to fill an important evidence gap by describing the prevalence of hypertension and other chronic disease risks among remote-living Indigenous youth. As well as describing the prevalence of hypertension, pre-hypertension was explored.
Methods
Study participants
The Young Person Check program
Between 2009 and 2012, the regional health authority conducted a program of health screening – the Young Person Check or YPC – targeting Aboriginal and Torres Strait Islander youth aged 15–24 years living in remote largely Indigenous communities.20 Participants were not assessed by a doctor or nurse during a YPC; they were assessed by an Indigenous health worker from their own community. Assessments did not occur in a hospital, clinic, or research facility but rather in community spaces. The YPC program process has been reported elsewhere, including community consultation, recruitment of participants, conduct of the screen, participation rates and follow-up of abnormal findings.20
This study was approved by the Cairns Base Hospital Human Research Ethics Committee and was conducted with support from the relevant Indigenous community organisations.
Study participants were 1,883 Aboriginal and/ or Torres Strait Islander young people aged
15–24 years attending their first YPC in 11 north Queensland locations between March 2009 and April 2011. Overall, coverage of the 15–24 year Indigenous population across all YPC locations between 2009 and 2012 was 73% for females and 72% for males.
Measures
Blood pressure
Blood pressure was recorded using an Omron automatic blood pressure monitor with intellisense and the participant seated (the reading was taken immediately after sitting). If a participant had a systolic blood pressure >140 mmHg and/or diastolic blood pressure >80 mmHg a second reading was taken ten minutes later. The average of these two blood pressures was then recorded. Participants aged over 18 years with blood pressures ranging from 120–139 mmHg systolic and/ or 80–89 mmHg diastolic were defined as having pre-hypertension. Participants aged over 18 years with systolic blood pressures between 140 and 159 mmHg and/or diastolic blood pressures between 90 and 99 mmHg were defined as having stage l hypertension. Those with systolic blood pressure equal to or greater than 160mmHg and or diastolic equal to or greater than 100mgHg were defined as having as stage ll hypertension.19 Participants under 18 years were determined to have pre-hypertension, stage I hypertension and stage II hypertension as delineated in the Fourth Report on the Diagnosis, Evaluation, and Treatment of High Blood Pressure in Children and Adolescents.21
Body mass index (BMI)
Body weight was recorded using the same scales for each participant. Participants were asked to remove shoes and any heavy items from pockets. Weight was measured once to the nearest 0.1 kg. Height was measured using the same stadiometer for each participant. Participants were asked to remove shoes and hats prior to measuring height. Height was measured to the nearest 0.1 cm. Body Mass Index (BMI) was defined as weight divided by height squared (kg/m2) and categorised as underweight, healthy, overweight and obese. For participants aged 15–19 years, these categories were based on the Center for Disease Control paediatric charts.22 For participants aged over 19 years, BMI was categorised as: healthy (≥18.5–25), overweight (>25–30) and obese (>30) according to the World Health Organization definition used in the local clinical guidelines.23
Waist circumference
Waist circumference was measured with the participant standing clothed with feet slightly apart. The tape measure was placed once around the narrowest part of the abdomen approximately half way between the hips and ribs. Waist was measured as the participant exhaled. Waist was measured to 0.1 cm. Waist circumference was deemed normal if it was <80 cm for females and <94 cm for males.23
Plasma glucose
Blood samples were collected in the non-fasting state. All blood samples were analysed at the same central laboratory. Plasma glucose was defined as normal if it was <5.5 mmol/L for males and females. Those with a plasma glucose of 5.5-11 mmol/L were classified as having an uncertain diabetic state and requiring further testing. Those with plasma glucose >11 mmol/L were classified as having probable diabetes.24
Plasma lipids
Non-fasting blood lipids were assessed. High density lipoprotein (HDL) and triglycerides were examined. HDL was classified as reduced if it was <1.0 mmol/L and the triglyceride level was classified as elevated if >2.0 mmol/L.25
Urinalysis
A spot urine sample was collected from each participant and dipsticked immediately. A new package of urine dipsticks was used for each event and attention paid to temperature and other environmental requirements as per the instructions on the packaging. Proteinuria was defined as ≥1+ protein. Urinary albumin creatinine ratio (ACR) was assessed if proteinuria was present. ACR was defined as elevated if it was >2.5 mg/mmol for males >3.5 mg/mmol for females.26
Analysis
those aged 18–24 years according to different diagnostic criteria used for hypertension. A significance level of p<0.05 was used. Proportional Venn diagrams were drawn using BioInfoRx software.
Results
Demographics of the YPC
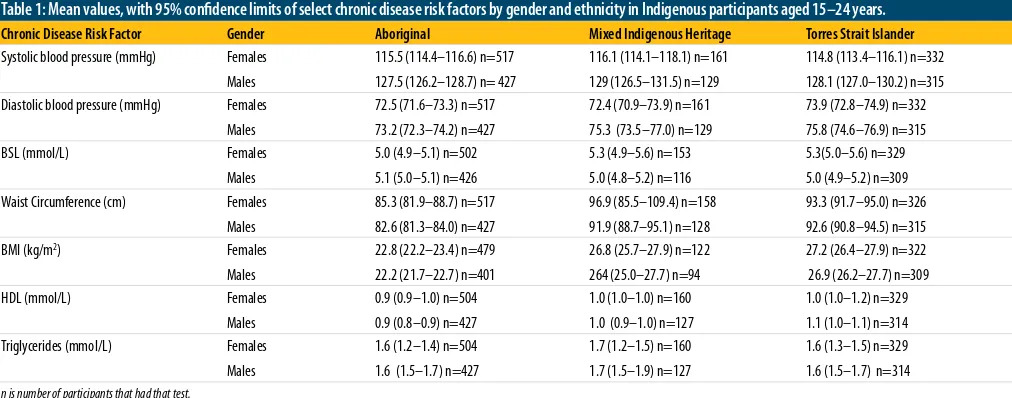
Among the 1,883 participants, who were Indigenous and aged 15–24 years, 50.2% identified as Aboriginal, 34.4% as Torres Strait Islander and 15.4% as both Aboriginal and Torres Strait Islander. Males represented 46.3% of those participating and females, 53.7%. Pregnant women were not excluded. The mean age of female Aboriginal participants was 19.1 years, female Torres Strait Islander participants 18.7 years and female participants who identified as both Aboriginal and Torres Strait Islander 18.3 years. The mean age of male Aboriginal participants was 18.9 years, male Torres Strait Islander participants 18.5 years, and male participants who identified as both Aboriginal and Torres Strait Islander 19.1 years. The mean age of participants overall was 18.8 years. Among all Indigenous participants the prevalence of pre-hypertension was 34.0%, stage I hypertension was 17.7% and stage II hypertension was 3.3%. The prevalence of elevated waist circumference was 35.4%, overweight or obesity 46.9%, elevated triglycerides 18.3%, decreased HDL 54.8%, proteinuria 25.4% and albuminuria 6.0%. Table 1 displays the mean values for selected risk factors with 95% confidence limits. Table 2 compares the prevalence of selected risk factors in male and female participants
by ethnicity. Of those with hypertension, 22% had proteinuria. Only 15.8% of the participants were free of all risk factors while 3.2% had all risk factors: overweight or obesity, increased waist circumference, hypertension, increased triglycerides and decreased HDL.
The final logistic regression model for those aged 18 years and over found only gender, overweight, obesity and elevated triglycerides were significantly associated with hypertension (Table 3). Elevated waist circumference and reduced HDL were significantly associated with hypertension in the univariate analysis (OR=1.98, 95%CI: 1.42-2.76) and (OR=0.17, 95% CI: 0.15-0.20) respectively, but did not reach significance in the multivariate analysis, due in part to co-linearity amongst the predictors.
No acceptable model could be found for participants aged under 18 years due to poor model fit.
Discussion
Pre-hypertension and hypertension were highly prevalent in this sample of Indigenous youth, particularly among males (Table 2). The mean systolic blood pressure for males of both ethnicities fulfils the criteria for pre-hypertension (Table 1). In addition, overweight and obesity were highly prevalent and associated with hypertension among Indigenous males and females aged 18–24 years.
In 2011-12 the Australian Health Survey found that 31.6% of all Australians aged over 18 years and 6.0% of those aged 18–24 years had hypertension.27In the same survey, 60.0% of
[image:3.595.60.566.559.758.2]men and 66.6% of women over 18 years had a waist circumference that put them at risk. The Australian Aboriginal and Torres Strait Islander Health Survey found that 20.4% of Indigenous adults had hypertension. It also found that 66% of Indigenous Australians aged 15 years and over were overweight (28.6%) or obese (37.4%).28 The results of our study contrast with the prevalence of hypertension measured among the general Queensland population aged 18–24 years (7.5%)29 and among Native American youth in the Strong Heart Study30 where the prevalence among women aged 20–24 years was 6.2% and among men was 16.4%. The hypertension prevalence among a sample of remote-living north Queensland Aboriginal and Torres Strait Islander adults in 2005 was 33.2%, only marginally higher than the overall prevalence of hypertension (that is, 21% had Stage I or II) found in this adolescent sample.31 Cardiovascular disease risk data from the general Queensland population provides some further insight. Based on self-report, 38.3% of Queensland males and 31.4% of Queensland females aged 18–24 are overweight or obese32 and 6.6% of the adult Australian population over 25 years have albuminuria.33 The overall prevalence of overweight or obesity (46.9%), hypertension (21.0%) and albuminuria (6.0%) in this remote and younger population suggest that Indigenous youth are experiencing a heavy burden of cardiovascular disease risk. The prevalence of probable diabetes was low when compared with other risk factors in this sample. Evidence suggests, however, that renal impairment and hypertension are the earliest overt signs of the metabolic syndrome in Indigenous Australians.34 This
Table 1: Mean values, with 95% confidence limits of select chronic disease risk factors by gender and ethnicity in Indigenous participants aged 15–24 years. Chronic Disease Risk Factor Gender Aboriginal Mixed Indigenous Heritage Torres Strait Islander
Systolic blood pressure (mmHg) Females Males
115.5 (114.4–116.6) n=517 127.5 (126.2–128.7) n= 427
116.1 (114.1–118.1) n=161 129 (126.5–131.5) n=129
114.8 (113.4–116.1) n=332 128.1 (127.0–130.2) n=315 Diastolic blood pressure (mmHg) Females
Males
72.5 (71.6–73.3) n=517 73.2 (72.3–74.2) n=427
72.4 (70.9–73.9) n=161 75.3 (73.5–77.0) n=129
73.9 (72.8–74.9) n=332 75.8 (74.6–76.9) n=315
BSL (mmol/L) Females
Males
5.0 (4.9–5.1) n=502 5.1 (5.0–5.1) n=426
5.3 (4.9–5.6) n=153 5.0 (4.8–5.2) n=116
5.3(5.0–5.6) n=329 5.0 (4.9–5.2) n=309 Waist Circumference (cm) Females
Males
85.3 (81.9–88.7) n=517 82.6 (81.3–84.0) n=427
96.9 (85.5–109.4) n=158 91.9 (88.7–95.1) n=128
93.3 (91.7–95.0) n=326 92.6 (90.8–94.5) n=315
BMI (kg/m2) Females
Males
22.8 (22.2–23.4) n=479 22.2 (21.7–22.7) n=401
26.8 (25.7–27.9) n=122 264 (25.0–27.7) n=94
27.2 (26.4–27.9) n=322 26.9 (26.2–27.7) n=309
HDL (mmol/L) Females
Males
0.9 (0.9–1.0) n=504 0.9 (0.8–0.9) n=427
1.0 (1.0–1.0) n=160 1.0 (0.9–1.0) n=127
1.0 (1.0–1.2) n=329 1.1 (1.0–1.1) n=314 Triglycerides (mmol/L) Females
Males
1.6 (1.2–1.4) n=504 1.6 (1.5–1.7) n=427
1.7 (1.2–1.5) n=160 1.7 (1.5–1.9) n=127
1.6 (1.3–1.5) n=329 1.6 (1.5–1.7) n=314
Table 2: Selected chronic disease risk factor prevalence in Aboriginal and Torres Strait Islander participants aged 15–24 years. Variable Aboriginal females
(percentage)
Mixed Indigenous heritage females (percentage)
Torres Strait Islander females (percentage)
p
value
Aboriginal males (percentage)
Mixed Indigenous heritage males
(percentage)
Torres Strait Islander males (percentage)
p
value
Pre–hypertension 26.6 (22.7–30.5) n=517 28.6 (21.1–36.1) n=161 24.3 (19.6–29.0) n=332 0.594 42.7 (37.9–47.5) n=427 50.4 (41.2–59.6) n=129 41.2 (35.7–46.8) n=315 0.226
Hypertension (Stage I or Stage II hypertension)
13.0 (10.0–16.0) n=517 17.9 (11.5–24.2) n=161 12.6 (9.0–16.2) n=332 0.274 26.9 (22.6–31.2) n=427 26.1 (18.0–34.2) n=129 34 (28.8–39.4) n=315 0.079
Stage II hypertension 1.8 (0.6–3.0) n=517 1.4 (–0.5–3.4) n=161 2.5 (0.8–4.2) n=332 0.769 4.7 (2.6–6.8) n=427 4.4 (0.6–8.1) n=129 4.9 (2.5–7.3) n=315 0.975
Uncertain diabetic state. BSL 5.5–11.0 mmol/L
19.3 (0.16–0.23) n=502 25.5 (15.9–22.8) n=153 21.3 (16.8–25.7) n=329 0.255 28.2 (23.9–32.5) n=426 24.1 (0.16–0.32) n=116 22.7 (17.7–27.0) n=309 0.188
Probable diabetes. BSL>11.1mmol/L
0.6 (0.1–1.3) n=502 0.1 (0–0.3) n=153 1.5 (0.2–2.8) n=329 0.400 0 n=426 0 n=116 0.3 (0.0–0.9) n=309 0.416
Elevated waist circumference 52.4 (48.1–56.7) n=517 72.2 (65.1–79.2) n=158 78.8 (74.4–83.3) n=326 0.000 19.2 (15.5–23.0) n=427 35.2 (26.8–43.5) n=128 38.4 (33.0–43.8) n=315 0.000
BMI overweight or obese 33.2 (29.0–37.4) n=479 64.8 (56.2–73.3) n=122 64.3 (59.0–69.5) n=322 0.000 28.2 (23.8–32.6) n=401 51.1 (40.9–61.3) n=122 60.5 (55.0–66.0) n=309 0.000
BMI Obese 16.9 (13.5–20.3) n=479 37.3 (29.1–46.4) n=122 37.7 (32.0–42.6) n=322 0.000 11.2 (8.1–14.3) n=401 24.5 (15.7–33.2) n=122 32.7 (27.4–37.9) n=309 0.000
Triglycerides >2.0 mmol/L 14.1 (11.0–17.1) n=504 14.4 (9.0–19.8) n=160 15.5 (11.6–19.4) n=329 0.849 19.7 (15.9–23.5) n=427 21.3(14.1–28.4) n=127 26.8 (21.8–31.7) n=314 0.070
HDL <1.0 mmol/L 61.3 (57.0–65.6) n=504 52.5 (44.7–60.3) n=160 44.1 (38.7–49.5) n=329 0.000 66.3 (61.8–70.8) n=427 52.8 (44.0–61.5) n=127 41.7 (36.2–47.2) n=314 0.000
Proteinuria 32.8 (28.8–36.9) n=518 21.7 (15.3–28.1) n=161 13.5 (9.8–17.2) n=333 0.000 28.3 (18.0–32.6) n=427 25.8 (18.0–33.2) n=129 17.1 (13.0–21.3) n=315 0.002
Proportion of those with proteinuria that demonstrated albuminuria* >3.5 mg/mol females >2.5 mg/mmol males
34.3 (26.4–42.1) 33.3 (15.1–51.6) 31.7 (17.2–46.2) NA 10.6 (4.3–17.5) 36.0 (16.7–55.3) 35.3 (22.0–48.6) NA
**Minimum albuminuria prevalence
9.5 5.6 3.9 NA 2.3 7.0 5.7 NA
n is number of participants that had that test. 95% confidence intervals in brackets.
*ACR was only evaluated on participants who had a positive urine dipstick test (≥1+ protein). **These represent a minimum albuminuria prevalence due to the method of selection for ACR testing.
Table 3: Final model of independent associations with hypertension in participants aged 18-24 years.
Adjusted Odds ratio* (95% confidence interval)
p value
Sex (Male) 4.37 (2.92- 6.54) <0.000 Overweighta 2.46 (1.53 – 3.97) <0.000 Obesitya 4.59 (2.87 – 7.36) <0.000 Triglycerides 2.38 (1.61 – 3.52) <0.000
* Adjusted for all variables for which an estimate is shown a: as compared with normal/underweight participants is supported by the recognition that the
prevalence of diabetes increases rapidly in Indigenous populations after the age of 35 years.35-37 We are limited in our ability to compare these results with other Indigenous community surveys that have focused on the broader adult population, as coverage among adolescents and young adults has been low and they have used either a fasting measure of BSL or glucose tolerance test (GTT).
Limitations
The possible impact of ‘white coat’ hypertension on the results presented here is unclear; however, the interaction between health staff and YPC participants was youth friendly, culturally appropriate, occurred outside of the clinic and excluded the taking of a medical history. This context is likely to have produced less ‘white coat hypertension’ than a traditional western medical setting. While the study may be criticised for relying on a single measure (or two, if the initial result was elevated) of blood pressure as not complying with traditional research methodology, it must be remembered that these data result from a service delivery program. Among the Indigenous population, this age group has traditionally been reticent to participate in research studies, making the findings described here particularly pertinent. While at a clinical level the
method of BP assessment does not allow for reliable categorising of hypertension, it provides useful population level information, particularly in view of the high participation number.
While traditionally lipid profiles are assessed in the fasting state, there is growing evidence that non-fasting lipids are as acceptable a measure.38,39 Similarly, there has been debate about whether different cut-offs for waist circumference are necessary for Aboriginal versus Torres Strait Islander people.40 Given the age of these participants and the substantial proportion of our sample identifying as both Aboriginal and Torres Strait Islander, the same thresholds were applied across all ethnicities.
Problems with the utility of proteinuria as a screening test for renal disease have been identified41 although Hoy et al. report it to be reasonably robust.42 The prevalence of albuminuria, representing – as it does here – a minimum prevalence, suggests that the risk of renal disease is high in both Aboriginal and Torres Strait Islander young people.
Strengths of the study
Selection bias is likely to have been minimised in this study by the high target group coverage achieved consistently across screen locations.Implications
directed only at overweight or obese young adults, is not appropriate. The significant association between overweight, obesity and hypertension emphasises the need to address the obesogenic environment in which remote Indigenous youth live.
The finding of a greater burden of hypertension and pre-hypertension among males is not explained and requires further investigation and specific preventive action. It may be that the prevalence of other risk factors not assessed in the YPC, such as cigarette smoking and alcohol intake, may contribute to this differential.
Conclusion
The prevalence of overweight and obesity, pre-hypertension, hypertension and impaired renal function observed in this study suggest that many remote-living Indigenous young adults are already on a trajectory towards diabetes and cardiovascular diseases. Preventive health action that aims to address the burden of cardiovascular disease in Indigenous communities must have an impact prior to adolescence to prevent the development of risk factors already clearly apparent in Indigenous young people. As well as primary prevention, the detection of chronic disease risk among Indigenous youth and management of individuals found to be at risk must take priority.
Although there are some differences in the prevalence of specific risk factors among Aboriginal and Torres Strait Islander participants (such as the statistically significant difference in the prevalence of hypertension across genders), the unifying theme of high chronic disease risk factor prevalence supports a screening program directed at all Indigenous youth. Within resource constraints, chronic disease risk factor screening for both Aboriginal and Torres Strait Islander people should commence early, by age 15 years at the latest. Within an international context, this study highlights the importance of exploring the hypertension and cardiovascular disease risk experienced by disadvantaged subgroups living within developed nations, in particular Indigenous populations.
References
1. Ibrahim M, Damasceno A. Hypertension in developing countries. Lancet. 2012;380 (9841):611–19. 2. The World Bank. How We Classify Countries [Internet].
Washington (DC): World Bank; 2012 [cited 2012 Dec 6]. Available from: http://data.worldbank.org/about/ country-classifications
3. Australian Bureau of Statistics. 4714.0 - National Aboriginal and Torres Strait Islander Social Survey. Canberra (AUST): ABS; 2008.
4. Australian Institute of Health and Welfare. 4704.0 - The Health and Welfare of Australia’s Aboriginal and Torres Strait Islander Peoples. Canberra (AUST): ABS; 2010. 5. Awofeso N. Racism: A major impediment to optimal
Indigenous health and health care in Australia. Aust Indig HealthBull. 2011;11(3).
6. Australian Institute of Health and Welfare. Access to Health Services for Aboriginal and Torres Strait Islander People. Catalogue No.: IHW 46. Canberra (AUST): AIHW; 2011.
7. Department of Health and Aged Care and Australian Institute of Health and Welfare. National Health Priority Areas Report on Cardiovascular Health 1998: A Report on Heart, Stroke and Vascular Disease. AIHW Catalogue No.: PHE9. Canberra (AUST): AIHW; 1999.
8. Condon J, Warman G, Arnold L. The Health and Welfare of Territorians. Darwin (AUST): Territory Health Services Epidemiology Branch; 2001.
9. Brown ADH. A Comparative Analysis of Cardiovascular and all Cause Mortality in Australia and New Zealand 1984-1996: Is There Evidence of Widening Indigenous/ Non Indigenous Differentials? Jerusalem (ISR): Hebrew University School of Public Health and Community Medicine; 1999.
10. Wang Z, Knight S, Wilson A, Rowley KG, Best JD, McDermott R, et al. Blood pressure and hypertension for Australian Aboriginal and Torres Strait Islander people. Eur J Cardiovasc Prev Rehabil. 2006;13:438-43. 11. Miller G, McDermott R, McCulloch B, Leonard D,
Arabena K, Muller R. The Well Person’s Health Check: A population screening program in Indigenous communities in north Queensland. Aust Health Rev. 2002;25(6):136-47.
12. Haysom L, Williams R, Hodson EM, Lopez-Vargas PA, Roy LP, Lyle DM, et al. Natural history of chronic kidney disease in Australian Indigenous and non-Indigenous children: A 4-year population-based follow-up study. Med J Aust. 2009;190 (6):303-6.
13. Abbot RA, MacDonald D, Mackinnon L, et al. Healthy Kids Queensland Survey 2006 – Summary Report. Brisbane (AUST): Queensland Health; 2007. 14. Shultz R. Prevalences of overweight and obesity among
children in remote Aboriginal communities in central Australia. Rural Remote Health [Internet]. 2012 [cited 2014 Dec 10];12 1872. Available from: http://www.rrh. org.au
15. O’Dea K. Westernisation, insulin resistance and diabetes in Australian Aborigines. Med J Aust. 1991;155:258-64. 16. Andreasyan K, How WE, Kondalsamy-Chennakesavan S.
Indigenous mortality in remote Queensland, Australia. Aust N Z J Public Health. 2007;3(5): 422-6.
17. Leonard D, McDermott R, O’Dea K, Rowley KG, Pensio P, Sambo E, et al. Obesity, diabetes and associated cardiovascular risk factors among Torres Strait Islander People. Aust N Z J Public Health. 2002;26(2):144-9. 18. Australian Bureau of Statistics. 4715.0 - National
Aboriginal and Torres Strait Islander Health Survey 2004-2005. Canberra (AUST): ABS; 2006.
19. Chobanian AV, Bakris GL, Black HR, Cushman WC, Green LA, Izzo JL Jr, et al. The Seventh Report of the Joint National Committee on Prevention, Detection, Evaluation, and Treatment of High Blood Pressure: The JNC 7 Report. JAMA. 2003;289(19):2560-72. 20. Fagan P, Cannon F, Crouch A. The Young Person Check:
Enhancing intensive population screening strategies for sexually transmitted infection (STI) and selected chronic disease risk in remote Aboriginal and Torres Strait Islander North Queensland youth. Aust N Z J Public Health. 2013;37(4):316-21.
21. National High Blood Pressure Education Program Working Group on High Blood Pressure in Children and Adolescents. National Institute of Health. Fourth Report on the Diagnosis, Evaluation, and Treatment of High Blood Pressure in Children and Adolescents. Pediatrics. 2004;114(2 Suppl 4th Report):555-76. 22. Kuczmarski RJ, Ogden CL, Guo SS, et al. 2000 CDC
Growth Charts for the United States: Methods and Development. Vital Health Statistics Series No.: 11. Hyattsville (MD): National Center for Health Statistics; 2002.
23. National Health and Medical Research Council. Clinical Practice Guidelines for the Management of Overweight and Obesity in Adults, Adolescents and Children in Australia. Canberra (AUST): NHMRC; 2013.
24. Diabetes Australia, Royal College of General Practitioners. Diabetes Management in General Practice. Guidelines for Type II Diabetes. 17th ed. Canberra (AUST): Diabetes Australia; 2011.
25. Queensland Health, Royal Flying Doctor Service of Australia (Queensland Section) and Apunipima Cape York Health Council. Chronic Disease Guidelines. 3rd ed. Brisbane (AUST): State Government of Queensland; 2010.
26. Kidney Health Australia. Chronic Kidney Disease (CKD) Management in General Practice. 2nd ed. Melbourne (AUST): KHA; 2012.
27. Australian Bureau of Statistics. 4364.0.55.003 - Australian Health Survey: Updated Results, 2011-2012. Canberra (AUST): ABS: 2013.
28. Australian Bureau of Statistics. 4727.0.55.006 - Australian Aboriginal and Torres Strait Islander Health Survey: Updated Results, 2012-13. Canberra (AUST): ABS; 2014. 29. Queensland Health. The Health of Queenslanders 2010. Third Report of the Chief Health Officer Queensland. Brisbane (AUST): State Government of Queensland; 2010.
30. Drukteinis J, Roman M, Fabsitz R, Lee E, Best L, Russell Marie, et al. Cardiac and systemic hemodynamic characteristics of hypertension and prehypertension in adolescents and young adults. The Strong Heart Study. Circulation. 2007;115:221-7.
31. McDermott R, McCulloch B, Campbell S, Young D. Diabetes in the Torres Strait Islands of Australia: Better clinical systems but significant increase in weight and other risk conditions among adults 1999-2005. Med J Aust. 2007;186(10);505-8.
32. Dunstan D, Cameron A, deCourten M, Coyne T, D’Embden M, Welborn T, et al. The Australian Diabetes Obesity and Lifestyle study (AusDiab) Data Report. Melbourne (AUST): Baker IDI Heart and Diabetes Institute; 2004.
33. Atkins RC, Polkinghorne KR, Briganti EM, Shaw JE, Zimmet PZ, Chadban SJ. Prevalence of albuminuria in Australia: The AusDiab Kidney Study. Kidney Int. 2004:66 Suppl 92:22-4.
34. Hoy W, McDonald SP. Albuminuria: Marker or target in indigenous populations. Kidney Int. 2004;66 Suppl 92:25-31.
35. O’Dea K, Patel M, Kubisch D, Hopper J, Traianedes K. Obesity, diabetes, and hyperlipidemia in a Central Australian Aboriginal community with a long history of acculturation. Diabetes Care. 1993;16(7):1004-10. 36. McDermot R, Li M, Campbell SR. Incidence of diabetes
in two Indigenous populations. A 6 year follow up study. Med J Aust. 2010;192(10):562-5.
37. Dea K, Cunningham J, Maple-Brown L, Weeramanthri T, Shaw J, Dunbar T, et al. Diabetes and cardiovascular risk factors in urban Indigenous adults: Results from the DRUID study. Diabetes Res Clin Pract. 2008;80(3):483-9.
38. Langsted A, Freiberg JJ, Nordestgaard BG. Fasting and non-fasting lipid levels. Influence of normal food intake on lipids, lipoproteins, apolipoproteins, and cardiovascular risk prediction. Circulation. 2008;118:2047-56.
39. Nordestgaard BG, Benn M, Schnohr P, Tybjaerg-Hansen A. Non-fasting triglycerides and risk of myocardial infarction, ischemic heart disease, and death in men and women. JAMA. 2007;298:299-308.
40. Wang Z, Rowley K, Wang Zhiquiang, Piers L, O’Dea K. Anthropometric indices and their relationship with diabetes, hypertension and dyslipidemia in Australian Aboriginal people and Torres Strait islanders. Eur J Cardiovasc Prev Rehabil. 2007;14:172-8.
41. Methven S, MacGregor MS, Traynor JP, Hair M, O’Reilly D, Deighan CJ. Comparison of urinary albumin and urinary total protein as predictors of patient outcomes in CKD. Am J Kidney Dis. 2011;57(1):21-8.