The safety and efficacy of nitrate N supplementation to Bos indicus cattle
141
0
0
Full text
(2) THE SAFETY AND EFFICACY OF NITRATE N SUPPLEMENTATION TO BOS INDICUS CATTLE. Thesis submitted by Imanuel BENU, S.Pt. In April 2017. For the degree of Doctor of Philosophy in the College of Public Health, Medical and Veterinary Sciences at James Cook University.
(3) STATEMENT OF ACCESS. I, the undersigned, author of this work, understand that James Cook University will make this thesis available for use within the University Library and, via the Australian Digital Theses network, for use elsewhere. I understand that, as an unpublished work, a thesis has significant protection under the Copyright Act and: I do not wish to place any further restriction on access to this work.. Imanuel Benu April 2017. i.
(4) DECLARATION. I declare that this thesis is my own work and has not been submitted in any form for another degree or diploma at any university or other institution of tertiary education. Information derived from the published or unpublished work of others has been acknowledged in the text and a list of references is given.. Imanuel Benu April 2017. ii.
(5) ELECTRONIC COPY. I, the undersigned, the author of this work, declare that the electronic copy of this thesis provided to the James Cook University Library is an accurate copy of the print thesis submitted, within the limit of technology available.. Imanuel Benu April 2017. iii.
(6) ACKNOWLEDGEMENTS I would like to state my sincere gratitude to these amazing people. Firstly, my supervisor A/Prof Anthony Parker; this work could not have been completed without his incredible support, encouragement, guidance, criticism, and great patience during my study at James Cook University. I also wish to thank my co-supervisors Prof. Lee Fitzpatrick, Dr. Donna Martin, and Dr. Donna Rudd for their help advices and encouragement. I wish to extend my appreciation to my external supervisor, Dr. Richard Copland for his kindness and support before arriving in Australia and during my study at James Cook University. Sincerest thanks to the Australian Centre for International Agricultural Research for providing the scholarship during my study. Without this financial support, it would have been impossible to pursue this degree. I am grateful to the Head of College of Public Health, Medical and Veterinary Sciences (CPHVS) for all facilities provided during my studies. I wish to extend my gratitude to all staff members at the CPHVS for their assistance. I wish to thank JCU liaison officers, Alex Salvador and team, for their support and help since arriving, and during my study. My sincere thanks are also extended to Jeff Warner, Jo Penny and Virginia Simpson for their support. Special thanks also for technical support offered by Chris, Scott, Geoff, Rob and Nigel. I would also like to thank Martin, the manager at the Fletcher View Research Station. Without all your support and help, I would not have finished this research. Many thanks to my best mate, Santiago Pena, and family for the friendship and support. I also want to acknowledge the support from my fellow post-graduate and office mates. I acknowledge the statistical support from A/Prof. Graham Hepworth at University of Melbourne Statistical consulting centre for his advice and help with analysing my data. Thanks also to Matthew Callaghan and Nigel Tomkins for their assistance. I also. iv.
(7) acknowledge Dr. Jennifer Atherton for the assistance in editing this thesis. I wish to thank my workplace Undana, Kupang for the support and encouragement during my absence. My family, sister and mom, who passed away before and during early stage of my candidature, thank you for your endless love. Thanks to my dad, brothers and sisters for your support and prayers. To my parents in law, sister in law and her husband, I am grateful for their prayers, help and support, and especially for taking care of the children during my study. Finally, I dedicate this thesis to my lovely wife, Meity, and our children, Aditya and Bella. These studies could not have been completed without your endless prayers, support, encouragement, and thoughts. I do know and understand how hard it is for me to be away from you, particularly when things are not going well back home, and I cannot even do anything to help you physically. I am coming home soon.. v.
(8) STATEMENT OF THE CONTRIBUTION OF OTHERS I, the author, wish to recognize that this thesis could not have been completed without the grateful assistance of the below mentioned individuals and organizations. Nature of Assistance. Contributions. Name and Affiliation of Co-contributors. Intellectual support. Statistical support and data. A/Prof. G. Hepworth, The. analysis. University of Melbourne, Statistical Consulting Centre. A/Prof Anthony Parker, Prof. Assistance with experimental design and editing. Lee Fitzpatrick, Dr Donna Rudd and Dr Donna Martin, James Cook University; Matthew Callaghan, Ridley AgriProducts Pty.Ltd, Brisbane; N Tomkins, Meat & Livestock Australia, Queensland. vi.
(9) Financial support. John Allwright Fellowship. Australian Centre for. (JAF). International Agricultural Research (ACIAR). For the completion of the experiments, this project is part of the National Livestock Methane Program. James Cook University, Ridley AgriProducts Pty Ltd, the Australian Government Department of Agriculture, Carbon farming Futures Filing the Research Gap Program and Meat and Livestock Australia. Data Collection. Research assistance. Chris Coleman, Scott Blyth, Rob Jack, Geoffrey Palpratt, Nigel Breen, Martin, Josephine Penny, Virginia Simpson; College of Public Health, Medical and Veterinary Sciences, James Cook University.. vii.
(10) ABSTRACT. The aims of this study were to determine if nitrate (NO3) can safely replace urea as a source of nitrogen (N) and deliver an effective dose to reduce the enteric methane emissions of cattle consuming low quality forages typically in northern Australia without any negative impact on growth rates and grazing activity. A series of four experimental studies were conducted to test the safety of nitrate supplementation in Bos indicus steers. The first experimental study was designed to compare two methods used for the analysis of methaemoglobin (MetHb). These methods were compared to each other for use with three different species of ruminant. The accuracy, precision and correlation of a co-oximetry method for measuring MetHb concentrations in whole blood was compared to the gold standard, Evelyn and Malloy (1938) method. This study indicated that the values obtained using co-oximetry for MetHb were in good agreement with the MetHb values obtained from the Evelyn and Malloy (1938) method. Therefore, the co-oximetry method was a safer and more robust method, and could be utilised for MetHb measurement in further studies. The second experiment examined daily nitrate dose and feeding frequency on MetHb, carboxyhaemoglobin, oxyhaemoglobin, total haemoglobin, and haematocrit concentrations in the blood of twelve Bos indicus steers. This was also correlated with the dry matter intake (DMI) of the cattle to assess feeding preference for supplemented cattle. Indwelling venous jugular catheters were fitted to the animals and blood samples were collected at two hour intervals, over a period of seven days. Increasing dose rate of nitrate increased MetHb concentration in the blood of steers. For once a day nitrate feeding, the dose rates of 40 and 50 g nitrate/day had greater impact on MetHb values compared to 0 or 30 g nitrate/day.. viii.
(11) Increasing dose rates of nitrate also affected the daily peak MetHb values in the blood of cattle. However, no significant effects of increasing dose rate of nitrate were observed in haemoglobin, deoxyhaemoglobin, carboxyhaemoglobin, haematocrit concentrations or DMI. Twice a day feeding of nitrate decreased the formation of MetHb in the blood of Bos indicus steers. Therefore, caution should be exercised when feeding nitrate, as an NPN source to cattle grazing on low quality pastures in northern Australia. The animals were penned individually under low physiological stress in the second experiment and this, therefore, led to the question of would happen if exercise was imposed on the animals when feeding nitrate. Twelve Bos indicus steers were used in the third study to investigate the effects of nitrate dose rates on arterial blood gas, MetHb, carboxyhaemoglobin, oxyhaemoglobin, total haemoglobin, haematocrit, heart rate, and respiration rate after exercise. Increasing dose rate of nitrate decreased pO2 in the blood of cattle. Steers treated with 50 g nitrate/day had a decrease in oxyhaemoglobin and a concomitant increase in MetHb and carboxyhaemoglobin compared with steers treated with 0 or 30 nitrate/day. Steers dosed with 50 g nitrate/day exhibited greater increases in heart rate immediately after the exercise regimen compared to those animals dosed with 0 or 30 g nitrate/day. However, no difference was detected in respiration rate, or rectal temperature between treatments, after the exercise regimen. Therefore, feeding nitrate to Bos indicus cattle resulted in a decrease in the oxygen carrying capacity of their blood. In the last fourth experiment, ten Bos indicus steers were used to determine the effect of nitrate, or no nitrate, supplementation on MetHb, carboxyhaemoglobin, total haemoglobin, oxyhaemoglobin concentrations, DMI and body weight (BW) in cattle over a 70 day period. Blood samples were collected from the jugular vein of the animals before and at two hours intervals after treatments dosages were applied at three times (1100, 1300 and 1500h), on days 10, 30, 50 and 70. Nitrate treatment caused a greater increase of mean MetHb, peak ix.
(12) MetHb and carboxyhaemoglobin concentrations in the blood compared to the other group which received no nitrate. Nitrate supplementation at a rate of 7.1 g/kg DMI produced a consistent MetHb profile that appeared to return to normal concentrations within 24 h. These results suggest that there was no apparent adaptation to nitrate feeding by rumen microbes. However, there was no significant effect of nitrate on the total haemoglobin, oxyhaemoglobin concentrations, DMI and BW of cattle. Consequently, there was no production advantage to feeding nitrate compared with feeding an equivalent amount of urea to steers. Overall findings, suggest that nitrate supplementation at the rate of 50 g/day to Bos indicus cattle, consuming low quality forage in northern Australia, increased MetHb concentration in the blood and could have detrimental effects on their health. These studies found that another dosage regime could be implemented of twice daily dosing that would reduce toxicity of nitrate supplementation.. x.
(13) TABLE OF CONTENTS STATEMENT OF ACCESS .................................................................................................... i DECLARATION......................................................................................................................ii ELECTRONIC COPY .......................................................................................................... iii ACKNOWLEDGEMENTS ................................................................................................... iv STATEMENT OF THE CONTRIBUTION OF OTHERS ................................................ vi ABSTRACT .......................................................................................................................... viii TABLE OF CONTENTS ....................................................................................................... xi LIST OF TABLES ................................................................................................................ xiv LIST OF FIGURES ............................................................................................................... xv LIST OF ABBREVIATIONS .............................................................................................xvii LIST OF PUBLICATIONS .................................................................................................. xx LIST OF CONFERENCE POSTER PRESENTATIONS ................................................. xx CHAPTER 1 GENERAL INTRODUCTION ....................................................................... 1 1.1 Background ....................................................................................................................... 1 1.2 Hypothesis......................................................................................................................... 3 1.3 Aims and objectives .......................................................................................................... 3 CHAPTER 2 LITERATURE REVIEW ................................................................................ 5 2.1 2.2 2.3 2.4 2.5 2.6 2.7. Effect of digestive system in ruminant and methane production ...................................... 5 Seasonal rainfall and pasture grass production on methane yield from ruminants........... 7 Strategies of methane mitigation and its application ........................................................ 9 Effect of nitrate supplementation and methane reduction expectation from ruminants . 10 Effect of nitrogen metabolism in the rumen by ruminal microorganisms ...................... 11 Effect of nitrate intake and mechanism of nitrate toxicity in animals ............................ 13 Effect of basal diet and nitrate supplementation on methaemoglobin formation in ruminants......................................................................................................................... 14 2.8 Methaemoglobin ............................................................................................................. 17 2.9 Conclusion ...................................................................................................................... 18. CHAPTER 3 A COMPARISON BETWEEN METHAEMOGLOBIN METHODS IN CATTLE, SHEEP, AND GOATS ........................................................................................ 19 3.1 Introduction ..................................................................................................................... 20 3.2 Materials and methods .................................................................................................... 21 3.2.1 Methaemoglobin measurement ........................................................................ 22 3.2.2. Methaemoglobin measurement using co-oximetry .......................................... 23. 3.2.3. Precision ........................................................................................................... 23. 3.2.4. Statistical analysis ............................................................................................ 23. 3.3 Results ............................................................................................................................. 24 3.4 Discussion ....................................................................................................................... 29. xi.
(14) CHAPTER 4 THE EFFECT OF FEEDING FREQUENCY AND DOSE RATE OF NITRATE SUPPLEMENTS ON BOS INDICUS CATTLE FED FLINDERS GRASS (ISEILEMA SPP.) HAY ........................................................................................................ 31 4.1 Introduction ..................................................................................................................... 32 4.2 Materials and methods .................................................................................................... 33 4.2.1 Animals and management ................................................................................ 33 4.2.2. Experimental design ......................................................................................... 35. 4.2.3. Measurement and sampling .............................................................................. 36. 4.2.4. Statistical analysis ............................................................................................ 36. 4.3 Results ............................................................................................................................. 37 4.3.1 Total methaemoglobin...................................................................................... 37 4.3.2. Methaemoglobin peaks .................................................................................... 40. 4.3.3. Methaemoglobin rate of incline ....................................................................... 42. 4.3.4. Oxyhaemoglobin .............................................................................................. 42. 4.3.5. Total haemoglobin............................................................................................ 43. 4.3.6. Deoxyhaemoglobin .......................................................................................... 44. 4.3.7. Carboxyhaemoglobin ....................................................................................... 44. 4.3.8. Haematocrit ...................................................................................................... 45. 4.3.9. Dry matter intake .............................................................................................. 45. 4.4 Discussion ....................................................................................................................... 45 4.5 Conclusion ...................................................................................................................... 48 CHAPTER 5 THE EFFECT OF NITRATE SUPPLEMENTATION ON ARTERIAL BLOOD GASES, HAEMOGLOBIN FRACTIONS AND HEART RATE IN BOS INDICUS CATTLE AFTER EXERCISE ........................................................................... 49 5.1 Introduction ..................................................................................................................... 50 5.2 Materials and methods .................................................................................................... 51 5.2.1 Animals and management ................................................................................ 51 5.2.2. Data analysis .................................................................................................... 54. 5.3 Results ............................................................................................................................. 55 5.4 Discussion ....................................................................................................................... 58 5.5 Conclusion ...................................................................................................................... 61 CHAPTER 6 BOS INDICUS STEERS FED FLINDERS GRASS (ISEILEMA SPP.) HAY FOR 70 DAYS RESPOND TO NITRATE SUPPLEMENTATION IN A CONSISTENT AND PREDICTABLE PATTERN ............................................................ 62 6.1 Introduction ..................................................................................................................... 63 6.2 Materials and methods .................................................................................................... 64 6.2.1 Animals and management ................................................................................ 64 6.2.2. Statistical analysis ............................................................................................ 65 xii.
(15) 6.3 Results ............................................................................................................................. 67 6.3.1 Methaemoglobin............................................................................................... 67 6.3.2. Peak methaemoglobin ...................................................................................... 67. 6.3.3. Carboxyhaemoglobin ....................................................................................... 69. 6.3.4. Total haemoglobin............................................................................................ 70. 6.3.5. Oxyhaemoglobin .............................................................................................. 71. 6.3.6. Dry matter intake and body weight .................................................................. 72. 6.4 Discussion ....................................................................................................................... 74 6.5 Conclusion ...................................................................................................................... 76 CHAPTER 7 GENERAL DISCUSSION ............................................................................. 77 REFERENCES ....................................................................................................................... 83 APPENDICES ........................................................................................................................ 89 CHAPTER 3. ANOVA TABLES ......................................................................................... 89 CHAPTER 4. REML VARIANCE TABLES...................................................................... 97 CHAPTER 5. ANOVA TABLES ....................................................................................... 109 CHAPTER 6. ANOVA TABLES ....................................................................................... 112. xiii.
(16) LIST OF TABLES Table 3.1. Composition of untreated or treated blood samples with sodium nitrate and phosphate buffer to produce a MetHb standard curve for the in vitro determination of MetHb concentration by two methods. ...................................... 22 Table 3.2. Pearson correlation of log10 MetHb values produced from cattle, sheep and goat blood samples using the Evelyn-Malloy (1938) and co-oximetry methods. ................................................................................................................. 25 Table 3.3. Bland and Altman analysis of log10 MetHb values for the Evelyn and Malloy (1938) and co-oximetry methods with bias and 95% limits of agreement. ........... 25 Table 3.4. Lin’s concordance correlation coefficient (Rc) for the log10 MetHb values produced from cattle, sheep and goat blood samples and measured with the Evelyn-Malloy (1938) and co-oximetry methods. ................................................. 29 Table 4.1. Composition of bulked Flinders grass (Iseilema spp.) hay throughout the experiment.............................................................................................................. 34 Table 4.2. Composition of raw materials and formulated analysis of N, NO3, P, Na and S in supplement treatments. ...................................................................................... 35 Table 5.1. Composition of bulked Flinders grass (Iseilema spp.) hay throughout the experiment.............................................................................................................. 53 Table 5.2. Composition of raw materials and formulated analysis of N, NO3, P, Na and S of supplement treatments. ...................................................................................... 54 Table 5.3. Least squares means ± SD for arterial blood pH, partial pressure of oxygen (pO2), partial pressure of carbon dioxide (pCO2), bicarbonate (HCO3) and base excess (BE) for Bos indicus steers treated with 0, 30 or 50 g of nitrate per day for seven days and walked three kilometres. ............................................ 56 Table 5.4. Least squares means ± SD for total haemoglobin (tHb), deoxyhaemoglobin (FHHb), Oxyhaemoglobin (FO2Hb), MetHb (FMetHb), carboxyhaemoglobin (FCO2Hb) and hematocrit for Bos indicus steers treated with 0, 30 or 50 g of nitrate per day for 7 days and walked 3 kilometres. .............................................. 56 Table 5.5. Least squares means ± SD for heart rate before and immediately after walking, and respiration rate, and rectal temperature after walking 3 kilometres from Bos indicus steers treated with 0, 30 or 50 g of nitrate per day for 7 days. ........... 57 Table 6.1. Compositiona of bulked Flinders grass (Iseilema spp.) hay throughout the experiment.............................................................................................................. 66 Table 6.2. Composition of raw materials and formulated analysis of N, NO3, P, Na and S in supplement treatments. ...................................................................................... 66. xiv.
(17) LIST OF FIGURES. Figure 2.1. The process of feed fermentation in the rumen by the microbes to volatile fatty acids (VFAs: acetate, propionate, and butyric acids), hydrogen and carbon dioxide. (Buddle et al, 2011). ............................................................... 7 Figure 2.2. Nitrate supplementation provides an alternative hydrogen sink (Yang et al, 2016). .............................................................................................................. 11 Figure 2.3. Nitrate pathway in ruminants (Yaremcio, 1991). ........................................... 14 Figure 2.4. The effect of feeding 7.5 g nitrate/kg DM, fed as calcium nitrate once daily to two steers with different rates of consumption; either consuming the dose within 5 min (Fast) or 45 min (Slow) on the formation of methaemoglobin in the blood (Taken from Callaghan et al, (2014); A. J. Parker, unpubl. data). . 17 Figure 2.5. Blood methaemoglobin between normal (1.1%) as a control and (15%) treated with calcium nitrate (Photo credit: Matthew Callaghan). ................... 18 Figure 3.1. (a) Comparison of log10 methaemoglobin values for cattle produced by the Evelyn-Malloy and co-oximetry methods (P < 0.0001; R2= 0.8311; Y=1.080*X-0.2199). ....................................................................................... 26 Figure 3.2. (b) Bland-Altman plot agreement between log10 methaemoglobin values from cattle blood. The lower and upper agreement limits (bias ± 2 SD) are 0.62 and 0.34%, respectively. ......................................................................... 26 Figure 3.3. (a) Comparison of the of log10 methaemoglobin values for sheep produced by the Evelyn-Malloy and co-oximetry methods (P < 0.0001; R2= 0.9850; Y=0.9192*X + 0.05227). ................................................................................ 27 Figure 3.4. (b) Bland-Altman plot agreement between log10 methaemoglobin values from sheep blood. The lower and upper agreement limits (bias ± 2 SD) are 0.25 and 0.18%, respectively. ......................................................................... 27 Figure 3.5. (a) Comparison of the of log10 methaemoglobin values for goat produced by the Evelyn-Malloy and co-oximetry methods (P < 0.0001; R2 = 0.9812; Y= 0.9427*X + 0.04077). ..................................................................................... 28 Figure 3.6. (b) Bland-Altman plot agreement between log10 methaemoglobin values from goat blood. The lower and upper agreement limits (bias ± 2 SD) are 0.22 and 0.16%, respectively. ......................................................................... 28 Figure 4.1. Actual mean ± SEM methaemoglobin concentration (%) from venous blood of Bos indicus steers treated with 0 (―), 30 (―), 40 (―) or 50 (―) g of nitrate as a non-protein nitrogen supplement once a day in a single dose at 0700 h for seven days. .................................................................................... 39 Figure 4.2. Actual mean ± SEM methaemoglobin concentration (%) from venous blood of Bos indicus steers treated with 0 (―), 30 (―), 40 (―) or 50 (―) g of nitrate as a non-protein nitrogen supplement divided into two equal portions and given at 0700 and 1700 h for seven days. ................................................ 39 Figure 4.3. Back transformed adjusted means for methaemoglobin (%) in venous blood of Bos indicus steers dosed with 0 (―○―), 30 (―□―), 40 (―∆―) or 50 xv.
(18) (―◊―) g of nitrate once a day at 0700 hours or dosed with 0 (--○--), 30 (--□-), 40 (--∆--) or 50 (--◊--) g of nitrate divided into equal portions and administered at 0700 hours and 1700 h for seven days. ........................................ 40 Figure 4.4. Adjusted means for daily peak methaemoglobin (%) in venous blood of Bos indicus steers dosed with 0 (―○―), 30 (―□―), 40 (―∆―) or 50 (―◊―) g of nitrate once a day at 0700 h (mean SED = 12.5) or dosed 0 (--○--), 30 (--□-), 40 (--∆--) or 50 (--◊--) g of nitrate..................................................................... 41 Figure 4.5. Adjusted means for daily oxyhaemoglobin (%) in venous blood of Bos indicus steers treated with 0 (―○―), 30 (―□―) 40 (―∆―) or 50 (―◊―) g of nitrate as a non-protein nitrogen supplement once a day in a single dose at 0700 h for seven days (mean SED = 5.5). ............................................................. 43 Figure 6.1. Mean methaemoglobin concentration (%) from venous blood of Bos indicus steers sampled at 0, 2, 4 and 6 hours after treatment with 50 g of nitrate (─) or no nitrate (-■-) as a non-protein-nitrogen supplement on day 10 (○), day 30 (□), day 50 (∆) and day 70 (◊). .............................................................................. 68 Figure 6.2. Adjusted mean peak methaemoglobin concentration (%) from venous blood of Bos indicus steers treated with 50 g of nitrate (─∆─) or no nitrate (--●--) as a non-protein-nitrogen supplement for a 70 day period (l.s.d. = 4.867). ............... 69 Figure 6.3. Adjusted back transformed mean carboxyhaemoglobin concentration (%) from venous blood of Bos indicus steers sampled at 0, 2, 4 and 6 hours after treatment with 50 g of nitrate (─□─) or no nitrate (--●--) as a non-proteinnitrogen supplement for a 70 day period. .............................................................. 70 Figure 6.4. Mean oxyhaemoglobin concentration (%) from venous blood of Bos indicus steers treated with 50 g of nitrate (─□─) or no nitrate (--●--) as a non-proteinnitrogen supplement for a 70 day period. .............................................................. 72 Figure 6.5. Means dry matter intake of Flinders grass hay by steers given no nitrate (--●-) or 50 g of nitrate (─□─) for 70 days.................................................................... 73 Figure 6.6. Mean ± SEM body weight of steers given no nitrate (--●--) or 50 g of nitrate (─□─) for 70 days. ................................................................................................. 73. xvi.
(19) LIST OF ABBREVIATIONS. ANOVA. analysis of variance. BE. base excess. BGA. blood gas analyser. BW. body weight. CaNO3. calcium nitrate. CI. coefficient interval. CO. carbon monoxide. CV. coefficient variation. CSIRO. the commonwealth scientific and industrial research organisation. DOM. digestible organic matter. DM. dry matter. DMI. dry matter intake. eMCP. efficiency of microbial protein. FHHB. fractions of deoxyhaemoglobin. FO2HB. fractions of oxyhaemoglobin. FCO2HB. fractions of carbon dioxide haemoglobin. FMetHb. fractions of Methamoglobin. g. gram. GPS. global positioning system. h. hour. Hb. haemoglobin xvii.
(20) HCO3. bicarbonate. Hct. hematocrit. kg. kilogram. L. liter. LOA. limits of agreement. LSD. least significant difference. LW. life weight. MDCP. mono-dicalcium phosphate. MetHb. MetHb. MetHbCN. cyanMetHb. m. meter. mL. milliliter. µL. microliter. N. nitrogen. NPN. non-protein-nitrogen. Na. sodium. NO2. nitrite. NO3. nitrate. NH3-N. ammonia nitrogen. NRC. national research council. OMD. organic matter digestibility. OXYHB. oxyhaemoglobin. P. phosphate xviii.
(21) pH. power of hydrogen. pO2. partial pressure of oxygen. pCO2. partial pressure of carbon dioxide. Rc. coefficient values. RDN. rumen degradable nitrogen. REML. restricted estimated mixed linear. S. sulphur. SD. standard deviation. SED. standard error difference. SEM. standard error mean. tHb. total haemoglobin. xix.
(22) LIST OF PUBLICATIONS. Benu I, Callaghan MJ, Tomkins N, Hepworth L, Fitzpatrick LA and Parker AJ (2015). The effect of feeding frequency and dose rate of nitrate supplements on blood haemoglobin fractions in Bos indicus cattle fed Flinders grass (Iseilemia spp.) hay. Animal Production Science. http://dx.doi.org/10.1071/AN14886 Benu I, Callaghan MJ, Tomkins N, Hepworth L, Fitzpatrick LA and Parker AJ (2016). The effect of nitrate supplementation on arterial blood gases, haemoglobin fractions and heart rate in Bos indicus cattle after exercise challenge. Animal Production Science. https://doi.org/10.1071/AN16162 Callaghan MJ, Tomkins NW, Benu I and Parker AJ (2014). How feasible is to replace urea with nitrates to mitigate greenhouse gas emissions from extensively managed beef cattle? Animal Production Science. 54, 1300-1304. http://dx.doi.org/10.1071/AN14270. LIST OF CONFERENCE POSTER PRESENTATIONS. Benu I, D. M. Rudd, M. J. Callaghan and A. J. Parker (2016). Co-oximetry demonstrates good agreement with a standard method for measuring MetHb concentrations in sheep blood. Poster presented on 12 September 2016 at Townsville Research Week. The Townsville Hospital, Townsville, Qld, Australia.. XX.
(23) CHAPTER 1 GENERAL INTRODUCTION 1.1 Background Livestock animals are considered to be the largest contributor to greenhouse gas emissions, accounting for 15% of total global methane emissions, due to their enteric methane production (Bruinsma, 2003). In Australia, methane accounts for about 11% of greenhouse gas emissions (Commonwealth of Australia, 2014), and beef cattle are the largest emitters. It has been recorded that about 60 % of Australia’s national beef herd is located in northern Australia, which is predominately based in tropical pastures (Callaghan et al., 2014). In addition, cattle consuming dry season pastures produce greater amounts of methane than intensively fed cattle (Charmley et al., 2008). Despite the large contribution of cattle to global methane emission, global demand of total animal products is projected to be more than doubled by 2030, particularly in developing countries, causing methane production to be as high as 60% of global methane emission (Bruinsma, 2003) The low quality and quantity of nutrients from tropical pastures in the dry season are believed to be limiting factors in animal production in the tropics, including northern Australia. Under these circumstances, the major diet management intervention most commonly practiced is to provide the animal with nitrogen supplementation, which accounted for more than 90% of total nitrogen consumed (Bortolussi et al., 2005). Provision of nitrogen in the diet of an animal is mainly via urea, which is offered in the form of free choice, low-intake loose licks and lick blocks, using molasses as a carrier to minimize live weight losses and reduce mortality (Callaghan et al., 2014). A previous study reported that body weight of cattle was increased from 0.14, 0.19 and 0.23 kg/day for the low, medium and high levels of urea, respectively, compared with control animals that lost 0.01 kg/day when urea mixed molasses was provided to the animal (Winks et al., 1972). In addition, provision of urea 1.
(24) supplementation on Bos indicus cattle has been reported to significantly reduce live weight loss during dry seasons (Coates and Dixon, 2008). Nitrate has been proposed as a means of mitigating methane production from ruminants (Leng, 2008). This has led to the Australian Government advocating for the feeding of nitrate to ruminants in a bid to decrease methane production. Nitrate compounds, however, can be toxic to the animal. Nitrate is reduced by the rumen microflora to nitrite and then to ammonia. In some feeding scenarios, rumen nitrate may increase to concentrations that exceed the conversion of nitrate to ammonia. In this situation, nitrite level in the blood can increase to a point where it oxidises haemoglobin to form methaemoglobin (MetHb). Methaemoglobin is unable to carry and transport oxygen around the body and tissues and can cause hypoxia induced fatality in the animal (Holtenius, 1957). The Australian Government’s confidence in nitrate to reduce methane is shadowed by the compound’s toxicity. Most studies investigating the ability of nitrate compounds to reduce methane emissions from ruminants are based on high digestibility diets of grain and temperate forages (Nolan et al., 2010, Li et al., 2012). Highly digestible diets provide a degree of protection against nitrate toxicity (Burrows et al., 1987). Such a diet does not reflect the forages and supplements found in tropical regions. In addition, supplement delivery systems in northern Australia provide for ad libitum with minimal human control over the supplement consumption resulting in variable intakes of the supplement by the animal (Eggington et al.1990; Dixon et al. 2003). Furthermore, a single feeding event could result in the prescribed consumption of the daily dose of nitrogen. Consequently, the supplement delivery systems in northern Australia increase the risk of nitrite toxicity in beef cattle if nitrate salts make up the dominant supply of NPN to cattle (Benu et al. 2017). However, the risk of toxicity can be controlled with a dose of < 7.5 g NO3/kg DMI over a 7 day period (Benu et al. 2017). Recent study reported that dose rate and feeding frequency of 2.
(25) nitrate affected the development of nitrate toxicity in Bos indicus steers consuming low quality native pasture hay over seven days (Benu et al., 2015). The exercise tolerance of beef cattle is also compromised when nitrate has been fed as a supplement (Benu et al, 2017). If exercise tolerance of cattle is compromised, then the animals may not graze out from watering points, resulting in a decrease in DMI over time. This, in itself would also decrease production by loss of live weight and milk yield. Therefore, further studies on the long-term use of nitrate salts as an NPN supplement are required (Lee and Beauchemin, 2014). 1.2 Hypothesis The hypothesis tested in this research project was that nitrate feeding will affect the development of MetHb in the blood of cattle consuming low quality pasture grass. 1.3 Aims and objectives The aims and objectives of this study were: •. To determine intra species and inter assay variability using two MetHb assays Evelyn and Malloy (1938) and blood co-oximetry from cattle, goats and sheep.. •. To assess the effect of dose rate and frequency of nitrate feeding (once or twice a day) on MetHb in the blood of Bos indicus steers consuming low quality hay.. •. To determine the exercise tolerance of Bos indicus steers supplemented with nitrate, compared to no nitrate supplementation.. •. To assess long term forage intake and growth rates when Bos indicus steers consume low quality forage and are supplemented with either nitrate or no nitrate.. The ultimate completion of these aims will help improve our understanding of the issue of feeding nitrate salts to beef cattle grazing on low quality forages in northern Australia. This. 3.
(26) thesis provides a literature review, four separate experiments, which have a common theme, and a general discussion and conclusion. This literature review discusses the impact of nitrate feeding on cattle based on grazing pastures in relation to mitigating greenhouse gas emissions. It focusses on methane production from cattle, the ability of nitrate compounds to reduce methane emissions from cattle, and nitrate feeding and its constraints. Initially, it was important to determine the most appropriate and efficient method of measuring MetHb concentrations in the blood of ruminants. In the first experimental chapter (Chapter three), two MetHb assay methods were compared; the results provided the basis for future MetHb sampling methods used throughout the subsequent studies presented in the thesis. The remaining three experimental chapters (Chapters four to six) relate to the safety threshold and feeding frequency, exercise tolerance, and production responses of cattle when supplemented with nitrate salts and fed low quality pasture grass. Each chapter consists of an abstract, an introduction, material and methods, results, discussion, and conclusion. The general discussion chapter provides a summary of the main findings and conclusions obtained from each experimental study. Finally, at the end of the main part of the thesis appendices are provided, which support the data presented in the thesis.. 4.
(27) CHAPTER 2 LITERATURE REVIEW Much of enteric methane production from livestock animals that contributed to global greenhouse gases have been well studied (Moss et al., 2000, Boadi et al., 2004, Johnson et al., 2007, Beauchemin et al., 2009, Grainger and Beauchemin, 2011). Yet, there is an increased requirement for protein production to feed an ever-growing global population (Bruinsma, 2003). In recognition of this, and in order to reduce the economic burden on cattle producers, the Australian Government recently released guidelines on the use of supplemental nitrate feeding for cattle. While this recommendation was based on evidence provided by a number of studies (Alaboudi and Jones, 1985, Nolan et al.2010, van Zijderveld et al., 2010, Li et al., 2012), this work was undertaken under limited environmental conditions, in which a total mixed ration comprising concentrates are often offered to the animals and may not reflect the actual conditions under which the bulk of Australian meat production is undertaken. The purpose of this literature review was, therefore, to examine the impact of nitrate feeding on cattle based on grazing pastures in relation to mitigating greenhouse gas emissions. The following will be discussed: the digestive system in ruminants; cattle and methane production; the ability of nitrate compounds to reduce methane emissions; nitrate feeding and its constraints; and frequency and dose of nitrate intake involved in cattle supplementation. 2.1 Effect of digestive system in ruminant and methane production Ruminant animals have a unique digestive system for utilizing low-quality forage, or plant materials containing high cellulose, hemicellulose and non-protein-nitrogen (Van Nevel and Demeyer, 1996), as sources of energy. This has benefits for the animal’s’ survival but more importantly, this forage is converted into products, such as milk, meat, wool and labour. Forage is high in fiber and requires energy to be digested and converted into energy. The subsequent process, known as anaerobic fermentation, is mainly carried out by the microbes 5.
(28) present in the rumen (bacteria, fungi and protozoa) and produces short-chain fatty acids (VFAs), including acetate, propionate and butyrate (Buddle et al., 2011). These VFAs provide as much as 80% of metabolized energy (Krehbiel, 2014) absorbed by the host animal through the rumen wall into the blood stream (Callaghan et al., 2014). In addition, the components of VFAs also control hydrogen availability in the rumen for use by methane producing microbes (Alemu et al., 2011). Moreover, this microbial activity is also responsible for the conversion of protein and NPN to amino acids, oligopeptides, and ammonia secretions. This serves as a source of nitrogen for microbial protein production, which can then be utilized by the animal (Janssen, 2010). Figure 2.1 shows some of the rumen processes and highlights the process of feed fermentation by the microbes to produce VFAs (acetate, propionate, and butyric acids), hydrogen and carbon dioxide. The main end-product of fermentation is VFAs, however other products such as formate, ethanol, lactate, succinate, branched-chain VFAs, as well as ammonia, carbon dioxide and hydrogen are also formed (Janssen, 2010, Krehbiel, 2014). Although, hydrogen is not stored in the rumen, it is one of the main end-products of fermentation, and instead it is utilized by methanogen bacteria (Boadi et al., 2004). In addition, hydrogen is the most important energy source for methanogen bacteria in the rumen (Buddle et al, 2011) as its utilized to reduce CO2 to CH4, resulting in maintaining low hydrogen pressure in the rumen (Boadi et al., 2004). Methanogenic archaea are responsible for enteric methane production by utilizing carbon dioxide and hydrogen (Eckard et al., 2010). These bacteria do not have peptidoglycan polymers in their cell walls and also have a different composition of intracellular lipids compared to other bacteria (Moss et al., 2000). Both methane and carbon dioxide are released into the atmosphere through eructation and respiration of ruminants, resulting in greenhouse gas emissions. Both the rate and the amount of hydrogen that passes through the 6.
(29) pool determines the rate of methane formation and the amount of methane generated, respectively (4H2 + CO2 → CH4 + 2H2O; Janssen, 2010). In addition, methane production also represents a loss of energy from cattle of about 6% of feed consumed through eructation (Johnson and Johnson, 1995). Recently, a study recorded the energy lost as methane from cattle accounted for 6.1%, 6.7% and 5.4% of gross energy (GE) intake of early grass silage, late grass silage and maize silage, respectively (Brask et al., 2013). It has been noted that methane emissions from cattle are affected by several factors, such as the level of feed intake, type of carbohydrate in the diet, feed processing, supplementation of lipids or ionophores, alteration in the ruminal microflora (Johnson and Johnson, 1995), and ambient temperature (McAllister et al., 1996). Therefore, manipulation of these factors, ultimately, can reduce methane emission from cattle.. Figure 2.1. The process of feed fermentation in the rumen by the microbes to volatile fatty acids (VFAs: acetate, propionate, and butyric acids), hydrogen and carbon dioxide. (Buddle et al, 2011).. 2.2 Seasonal rainfall and pasture grass production on methane yield from ruminants It is well documented that fluctuations of seasonal rainfall affect tropical grass production across tropical countries, including Australia. Dixon and Coates (2010) indicated that quality and quantity of grass is higher during the wet season, but then declines rapidly as it reaches. 7.
(30) maturity, coupled with the dry season. This eventually, results in higher fibrous contents and lower nitrogen, as well as metabolizable energy contents and, thus, causes low growth and productivity of cattle when cattle are fed the grass. Under these circumstances, the major management intervention commonly practiced is to supplement the animal with urea in the form of free choice, low-intake loose licks and lick blocks, and use molasses as a carrier to minimize live weight losses and reduce mortality (Callaghan et al., 2014). It has been recorded that most of the supplementation to beef cattle across the northern region was nitrogen, which accounted for more than 90% of nitrogen (Bortolussi et al., 2005). The use of urea as non-protein-nitrogen supplementation, with molasses as a carrier, has been reported to increase body weight of cattle by about 0.14, 0.19 and 0.23 kg/day for the low, medium and high levels of urea, respectively, compared with control animals that lost 0.01 kg/day (Winks et al., 1972). Provision of urea supplementation in Bos indicus cattle has been reported to significantly reduce live weight loss during dry seasons (Coates and Dixon, 2008). Evidence from studies concerned with methane mitigation suggests that the type of diet offered to the animal is potentially associated with high methane production. However, cattle consuming pastures in the dry season, produce greater amounts of methane than those fed intensively (Charmley et al., 2008). In addition, ruminants fed forages high in fibrous material tended to produce more methane than those fed a high quality diet, such as concentrates (Beauchemin et al, 2008), due to the related alteration in substrate derived fermentation from fibre to starch and the decrease in ruminal pH. Furthermore, high cell wall components, such as cellulose and hemicellulose, in forages, which are less degradable than grains also contributed to methane production (Johnson and Johnson, 1995). In contrast, supplementation of readily fermentable carbohydrate degraded in the rumen, results in low methane production per unit feed (Moss et al., 2000), which is perhaps due to a higher rumen turnover resulting in a lower diet digestibility (Buddle et al., 2011). 8.
(31) 2.3 Strategies of methane mitigation and its application Since methane emission represents energy losses from animals, as well as contributing to greenhouse gas emission, any strategy of mitigating methane yield in the rumen aims to increase utilization of feed efficiency and results in animal production. Several strategies regarding methane mitigation have been considered (McAllister et al., 1996, Moss et al., 2000, Beauchemin et al., 2008). Although there are some promising strategies in dietary supplementation with plant secondary compounds (Chung et al., 2013), such as yeast cultures and enzymes, extensive research is still required (Beauchemin et al., 2008). Recently, an in vitro study evaluated the combination of several essential oils in mitigating methane and recorded that a combination of essential oils significantly reduced archaea, protozoa and select species of rumen bacteria, to different extents (Cobellis et al., 2016). The use of nitrate as a feed additive and its ability to suppress methane production from ruminants has been reported from a number of in vivo studies (Nolan et al., 2010, van Zijderveld et al., 2011, Li et al., 2012). However, most data supporting the capability of nitrate to lessen methane yield without any adverse effect to the animals, have been from studies with cattle fed total mixed rations (TMR) comprising of concentrates, forage and nitrate (Callaghan et al., 2014). Such methods of feeding a diet as TMR (concentrates and forage) or even nitrate that are mixed in solution and presented to the animals often result in low MetHb concentrations in the blood of ruminants (Benu et al., 2015). This is in contrast with the northern Australia grazing system, where cattle are consuming low quality pasture grass during the dry season, therefore, these strategies are unlikely to be adopted in extensively grazed livestock in northern Australia. This is, perhaps largely due to how extensive the beef production system is, with minimal labour input, low levels of infrastructure, large paddock sizes, and expensive energy supplementation (Callaghan et al.,. 9.
(32) 2014). Alternatively, intensification of grazing management, can be achieved by allowing cattle to graze pastures at early stages of maturity, which in turn can improve feed intake and digestibility, and, consequently, lower methane yield per unit of dry matter (DM) (Hegarty et al., 2010). Another consideration for methane reduction strategies is genotype manipulation, by selecting animals with higher production performance but lower methane yields. For example, Chagunda et al. (2009) demonstrated that genotype and feeding system type were associated with a decline of methane emission per liter of milk. 2.4 Effect of nitrate supplementation and methane reduction expectation from ruminants It has been proposed that nitrate can potentially replace urea as a source of NPN supplementation (Nolan et al., 2010), as well as provide a means to reduce enteric methane emission (Leng, 2008). Addition of nitrate in the diet of ruminants, to mitigate ruminal methane yield (McAllister et al., 1996), is promising due to the characteristic of nitrate as alternate electron acceptor in the rumen against methanogenesis (Figure 2.2) and its tendency to function effectively and persistently over time (van Zijderveld et al., 2011). Furthermore, consideration of the ability of nitrate to suppress methane production through the hydrogen sink mechanism invites future studies to be developed, in order to ensure that the perceived mechanism is accurate (Yang et al., 2016). When residence time of feed in the rumen is reduced, there would be the expectation that there will be a decrease in methane yield, due to a decline of ruminal digestion and the inability of methanogenic bacteria to compete in such circumstances (Moss et al., 2000). In addition, the expected methane reduction from nitrate supplementation can be calculated by using stoichiometry, where one mole of nitrate (100 g) produces ammonia with four moles of hydrogen, and reduces methane by one mole (26 g) (Lee and Beauchemin, 2014).. 10.
(33) Measurement of methane reduction, in relation to nitrate supplementation is often achieved by utilising a calorimetry. For example, Hulshof et al. (2012) reported that daily methane yield of steers was reduced by 32% when cattle were fed 85 g/d of calcium nitrate. Li et al. (2012) also reported a reduction of 35.4% methane yield from sheep treated with 3% calcium nitrate in their diet. Another study reported a 23% reduction of methane production when sheep were fed 4% potassium nitrate (Nolan et al., 2010).. Figure 2.2. Nitrate supplementation provides an alternative hydrogen sink (Yang et al, 2016).. 2.5 Effect of nitrogen metabolism in the rumen by ruminal microorganisms It is well established that microorganisms reside in the rumen of ruminants can assimilate nitrogen not only from dietary protein and nucleic acids, but also from non-protein-nitrogen (NPN) (Walt, 1993). About 15-20% of dietary nitrogen comes from NPN sources such as free amino acids, nucleic acids, purine and pyrimidine bases, ammonia, ammonium salts, urea, nitrates, and nitrites as well as urea from saliva (Rossi et al, 2013). In addition, protein play an important role in providing nitrogen requirement for ruminant as well as providing skeletons for energy metabolism (Walt, 1993). The quality of protein consumed by ruminants and their amino acids profile may or may not beneficial for the ruminal microbial (Valente et. 11.
(34) al, 2016). Attempt to increase the nitrogen balances in livestock fed protein-rich forages is still constrained by the imbalance between the degradative and biosynthetic activities of the rumen microbiota (Morrison and Mackie, 1996). Urea nitrogen (N) in ruminants is physiologically produced by the liver and recycled to the gastrointestinal tract (GIT) as a source of N for microbial growth (Eisemann and Tedeschi, 2016). The synthesized urea in the liver is functioning to detoxify ammonia due to the catabolism of endogenous or exogenous amino acids, where the excess ammonia is excreted through the urine (Lobley and Milano, 2007; Rossi et al, 2013). Ammonia is essential metabolite in rumen N metabolism (Walker et al, 2005; Rossi et al, 2013), particularly for the growth of rumen microorganisms. One of the main source for ammonia which can be provided to the ruminants is urea. However, the problem with urea feeding is that rumen microbial does not effectively utilize it due to its rapidly release to ammonia, and therefore loss of nitrogen available for microbial protein synthesis (Chalupa, 1969). An increase in microbial protein synthesis is important in both improved efficiency of carbohydrate degradation and ensure and increased intake of amino acids (Rossi et al, 2013). Because microbial growth and carbohydrate fermentation affect the extent of NH3 absorption and urea recycling and excretion (Reynolds et al, 2008). Ruminal NH3-N is reported as a crude predictor for the efficient conversion of dietary N into microbial N, however when the concentration is below 5 mg/dL, blood urea N transfer into the rumen provides an increasing buffer against excessively low NH3-N concentration (Firkins et al, 2007). Huntington et al (2006) reported that plasma concentrations of ammonia N in steers was reduced when ureacalcium diets fed to steers, and tended to reduce arterial glucose concentrations compare to urea alone. The researcher concluded that urea-calcium was effective in reducing rapid ammonia release in the rumen and subsequent effects on glucose and lactate metabolism.. 12.
(35) 2.6 Effect of nitrate intake and mechanism of nitrate toxicity in animals Despite the ability of nitrate to reduce methane yield from ruminants, elevated levels of nitrate in the diet of the animal are associated with nitrate poisoning. Nitrate (NO3) poisoning mainly occurs as a result of nitrite (NO2) oxidation in the blood, where nitrite binds to red blood cells and changes ferrous ions (Fe2+) to ferric (Fe3+) ions, overwhelming the protective ferri-reductase system and inducing methaemoglobinemia (Haymond et al., 2005). Methaemoglobinemia is a condition where blood is unable to carry and transfer oxygen to active tissues of the animal, resulting in hypoxemia (Holtenius, 1957, Vermunt and Visser, 1987). However, under some circumstances, the amount of nitrite formed might be overwhelmed by the amount of nitrite reduction to ammonia, when nitrite levels are increased (Marais et al., 1988). Ruminants have been reported to be more susceptible to NO3 toxicity when compared to monogastric animals (Yaremcio, 1991), since the microbes present in the rumen readily break down NO3 to NO2 (Leng, 2008). There are several factors that contribute to NO3 toxicity, such as the amount of NO3 consumption, the type of feed, the amount of carbohydrate in the feed, and the stage of adaptation to NO3 in the diet (Vermunt and Visser, 1987). Figure 2.3 demonstrates how nitrate is utilised by rumen microorganisms. Clinical signs of NO3 toxicity generally appear within four hours of the animal ingesting NO3 (Hixon, 1991). The symptoms appear when levels of MetHb reach 30%, and it may cause fatality in the animal when the MetHb reaches up to 80%, of total haemoglobin. The characteristics of symptoms are generally related to anoxia (lack of oxygen), such as a rapid pulse, difficulty in breathing, shivering, and brown discoloration of the mucous membrane of the vulva, vagina, and conjunctive tissue (Hixon, 1991, Al-Qudah et al., 2009). In addition, dark brown carcasses and non-clotted blood in the dilated vessels were reported in postmortem examinations (Al-Qudah et al., 2009). Treatment with methylene blue solution is. 13.
(36) recommended for animals suffering from NO3 intoxication (Burrows et al., 1987). Methylene blue is applied through intravenous injection and it acts as an elector carrier via which MetHb is converted to haemoglobin (Zijlstra and Buursma, 1997). Although there is variability in dose application, Vermunt and Visser (1987) recommended 6-7 mg/kg body weight as a safe dosage of methylene blue.. Figure 2.3. Nitrate pathway in ruminants (Yaremcio, 1991).. 2.7 Effect of basal diet and nitrate supplementation on methaemoglobin formation in ruminants Accumulation of NO3 in the rumen appears to be positively correlated with the feed compositions offered to the animal in relation to methaemoglobin formation in the blood. For example, early work confirmed that sheep under adequate feed (0.5 kg hay, 200 g crushed oats, 50 g molasses and free access to oat straw) were more capable of breaking down NO3 in the rumen, than those groups offered inadequate feed (0.2 kg hay and free access to oat straw) (Holtenius, 1957). Other studies in which sheep were fed with high concentrates of feed (total. 14.
(37) mixed ration) or pellets, and offered small meals of NO3 within a day, demonstrated low levels of MetHb production in the blood (Alaboudi and Jones, 1985, van Zijderveld et al., 2010, Li et al., 2012), with MetHb levels of < 2%, ≤ 7% and < 2.8%, respectively. Furthermore, when a 4% solution of potassium nitrate was sprayed onto oaten hay every hour, Nolan et al. (2010) found that blood MetHb of sheep was less than 2.8%. Low concentrations of MetHb formation in the blood is mainly due to highly digestible diets being offered to the animal, which provide a degree of protection against nitrate toxicity (Burrows et al., 1987). In contrast, when cattle are fed low quality rangeland hay, the production of MetHb in the blood was reported to be greater over seven days (Benu et al., 2015). Interestingly, most studies reporting low MetHb concentration in the blood of ruminants which were fed NO3 did not quantify the amount of NO3 consumed before the blood was sampled (Alaboudi and Jones, 1985, van Zijderveld et al., 2010, Li et al., 2012). Therefore, the timing of blood sampling may or may not align with the peak MetHb concentration for the day, as peak MetHb concentration determines the amount of time the animal is placed in a hypoxic state (Benu et al., 2015). The dose of nitrate feeding offered to the animal may also contribute to NO3 poisoning; therefore, seeking management strategies, in terms of NO3 feeding in animals is crucial. Callaghan et al. (2014) reviewed the strategy of NO3 being used in mitigating greenhouse gas emission in northern Australia. The researchers speculated that NO3 could be safely applied as a replacement for urea. However, the cost of NO3 can be as much as twice the price of urea. There is an argument that feeding NO3 to the animal in a single dose results in greater toxicity than a similar level divided and offered several times a day (Parkinson et al. 2010, A.J. Parker, pers. comm). The main reason behind this is that the concentration of MetHb formation, resulting from NO3 intake, is apparently higher in a single dose than from feeding two or three times a day. Figure 2.4 shows the formation of MetHb in the blood of two steers 15.
(38) consuming 30 g of nitrate daily (~ 7.5 g NO3/kg DM) on low quality Flinders grass hay. Recently, a study by Benu et al. (2015) demonstrated that increasing the dose rate of nitrate increased the proportion of MetHb in the blood when steers consumed low quality pasture hay and were treated with 40 or 50 g of nitrate per day, in once a day feeding, than for 0 or 30 g. In contrast, twice a day feeding decreased MetHb development in the blood of steers (Benu et al., 2015). The animals being introduced to nitrate feeding are often required to undergo a certain adaptation period to ensure that the rumen microorganisms are acclimated to the nitrate diet (Lee and Beauchemin, 2014). It has been claimed that microorganisms can maximise the activity of nitrate reductase in the rumen by about three to five times higher than the normal levels, as long as the animal is allowed an adaptation period of three to five days (Yaremcio, 1991). Moreover, Yaremcio, (1991) indicated that, for the first three days of nitrate introduction, activity of rumen microorganisms will remain normal. However, this digestion ability will level off between days four and seven, particularly if the animals are on a forage diet and the blood MetHb levels are found to be between 20 and 30%. Feeding nitrate to ruminants is often associated with negative impacts on animal performance, such as low feed intake, weight gain, or milk production (Lee and Beauchemin, 2014). Nevertheless, some studies have reported no negative effects of nitrate feeding on animal performance. For example, Nolan et al. (2010) and Li et al. (2012) showed that feed intake and weight gain of sheep were not affected by nitrate treatment. In addition, Benu et al. (2015) also reported that DMI by Bos indicus steers was not influenced by nitrate dose. However, all of these studies were conducted over a short period of time in laboratory setting and under human control. Therefore, if nitrate feeding has to be applied to cattle in grazing systems, such as those in northern Australia, where variability of individual consumption of. 16.
(39) nitrogen supplementation is huge, then some animals will likely be placed at a high risk due to MetHb formation in their blood (Callaghan et al., 2014).. Figure 2.4. The effect of feeding 7.5 g nitrate/kg DM, fed as calcium nitrate once daily to two steers with different rates of consumption; either consuming the dose within 5 min (Fast) or 45 min (Slow) on the formation of methaemoglobin in the blood (Taken from Callaghan et al, (2014); A. J. Parker, unpubl. data).. 2.8 Methaemoglobin Increasing MetHb levels in the blood of the animal is an indication of nitrate presence. In the blood of a normal animal, the MetHb level is usually found to be less than 2% of total haemoglobin. Therefore, consideration should be taken to avoid nitrate toxicity in animals particularly when the MetHb is above the normal levels. Figure 2.5 shows blood MetHb from a cow treated with no nitrate (control) and an animal treated with calcium nitrate. Despite the fact that feed composition is playing a crucial role in MetHb accumulation in the blood, the amount and rate of nitrate consumed by the animal also largely determines the severity of nitrate poisoning (Jainudeen et al., 1964, Vermunt and Visser, 1987). For example, studies by van Zijderveld et al. (2010) and Li et al. (2012) demonstrated that sheep produce low MetHb in the blood; ≤7% and <2.8%, respectively. In both of these experiments, the animals were offered high quality protein comprising of concentrates. However, the 17.
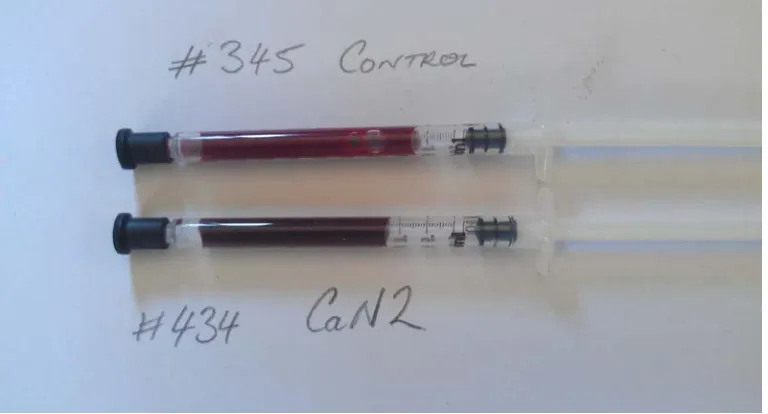
(40) researchers did not describe the amount of nitrate that the animal consumed during the 24 hours prior to blood sampling. The peak of MetHb is an important consideration in nitrate feeding for ruminant animals. An early study by Holtenius (1957) demonstrated that the peak of MetHb usually occurs between three and five hours after the animal has consumed nitrate.. Figure 2.5. Blood methaemoglobin between normal (1.1%) as a control and (15%) treated with calcium nitrate (Photo credit: Matthew Callaghan).. 2.9 Conclusion In an effort to the offset of greenhouse gas emissions from cattle, the Australian Government recently published guidelines which recommend nitrate supplementation for cattle. However, nitrate supplementation to cattle based on low quality forages and grass resulting in nitrate toxicity. Therefore, if nitrate supplementation has to be applied in northern Australia, where beef cattle are grazing on low quality pastures, then some of the animals are more likely to be challenged by greater MetHb formation in their blood.. 18.
(41) CHAPTER 3 A COMPARISON BETWEEN METHAEMOGLOBIN METHODS IN CATTLE, SHEEP, AND GOATS This chapter is in preparation for submission to Veterinary Clinical Pathology Authors: I. Benu, D.M. Rudd, M.J. Callaghan, and A.J. Parker. Abstract Methaemoglobin concentrations in the blood of ruminants are measured with a standard method (Evelyn-Malloy, 1938). However, the use of cyanide placed a number of safety constraints in this method. In particular, the need for a permit which took up to six months to attain. Co-oximetry is used in human medicine as a care diagnostic aid; however, it has not been validated in ruminant species. Due to the improved utility of the co-oximetry method, there is a need to compare the methods for agreement. Blood samples were collected from the jugular vein of 10 cattle (n =14), 9 sheep (n =22) and 10 goats (n = 21) at the College of Public Health, Medicine and Veterinary Sciences of James Cook University. The EvelynMalloy and co-oximetry methods were used to determine MetHb concentrations. There was no difference in MetHb concentrations between the two methods for cattle, sheep and goat samples (P = 0.059, P = 0.122, P = 0.206), respectively. A highly significant Pearson correlation coefficient between methods for the log10 MetHb concentrations was demonstrated in the blood samples from cattle (P < 0.0001; r2 = 0.8311), sheep (P < 0.0001; r2 = 0.9850) and goats (P < 0.0001; r2 = 0.9812). The Bland-Altman analysis of log10 MetHb concentrations showed a good agreement in cattle (LOA: 0.239 – 2.511), sheep (LOA: 0.338 – 3.019) and goats (LOA: 0.524 – 1.621) respectively. The Lin’s concordance coefficient values were demonstrated for the cattle (rc > 0.870 are regarded as poor); however, for sheep (rc > 0.988;) and goats (rc > 0.988) the values are regarded as substantial and, therefore,. 19.
(42) represents a very close agreement between the two methods. The co-oximetry values for MetHb agree with the MetHb values obtained from the Evelyn-Malloy (1938) method. 3.1 Introduction Methaemoglobin is produced via the oxidation of ferrous ions (Fe2+) to a ferric (Fe3+) state in the haem group of the hemoglobin molecule, rendering it unable to bind, carry and transfer oxygen to tissue, which may lead to hypoxia and death (Holtenius, 1957, Shihana et al., 2011). The presence of MetHb shifts the oxygen dissociation curve to the left and interferes with oxygen delivery to the tissues, resulting in tissue hypoxia in the absence of cyanosis. Causes of increased MetHb may be hereditary, idiopathic, or drug or toxin induced. Nitrates and nitrites are well-documented causes of elevation of MetHb in ruminants (Holtenius, 1957, Vermunt and Visser, 1987, Takahashi et al., 1998, Sar et al., 2004). Methaemoglobinemia, caused by nitrate toxicosis, can develop rapidly in cattle and sheep resulting in death. Detection of MetHb in emergency wards is critical as patients may succumb to MetHb disruption of cellular oxidative respiration (Olson et al., 1997). Therefore, human medicine has seen the advent of co-oximetry methods for the rapid and point of care detection of abnormal haemoglobins in critical care wards. Advances in the detection of MetHb in animals affected by nitrate poisoning are also critical to prevent death, particularly in the presence of effective treatments (Holtenius, 1957, Shihana et al., 2011). To date, the standard method for the analysis of MetHb levels in the blood is using the spectrophotometric assay of Evelyn-Malloy (Evelyn and Malloy, 1938). This method is characterised by measurement of the absorbance of the maximum MetHb peak at 630 nm, where the MetHb disappears upon the addition of sodium cyanide. However, this standard method has some limitations, such as: the cyanide used to convert MetHb to cyanmethaemoglobin (MetHbCN) is dangerous; the sample must be analyzed immediately to prevent pre-analytical error; and. 20.
(43) lab error in handling samples, such as pipetting, may cause inaccuracy of results. The Evelyn and Malloy (1938) method is also a labor intensive and time consuming procedure. The cooximetry method, on the other hand, offers a rapid process for measuring MetHb concentrations in the whole blood; it is pre-calibrated, multiple-wavelengths are measured simultaneously, and it has internal reference standard. However, co-oximetry has not been validated for measurement of MetHb in ruminants. In the present study, MetHb levels of cattle, sheep and goats were compared using the Evelyn and Malloy (1938) method with co-oximetry determination was performed using the cooximetry chamber on a point of care blood gas analyser. We hypothesised that the two different methods would show good correlation. 3.2 Materials and methods Fourteen blood samples were collected from 10 two-year-old Bos indicus steers, 22 blood samples from 9 two-year-old Merino rams and 21 blood samples from 10 mature female Boer goats. All animals were from healthy resident cattle, sheep and goat populations at the College of Public Health, Medicine and Veterinary Sciences of James Cook University, Townsville, Queensland. The blood samples were taken from the jugular vein following restraint, either in a cattle chute for the steers, or by an attendant in the case of sheep or goats. For each species, a 21 gauge, one inch vacutainer needle was used for the collection of 10 mL of blood into a lithium heparin containing vacutainer (Becton Dickinson). Blood samples were immediately placed on ice and transferred to the laboratory for subsequent analysis. All analyses were performed within 4 h. Samples of pooled blood from each different species (cattle, sheep and goats) were used in each method for determination of MetHb concentrations. Ethics approval was obtained from the Animal Ethics Committee of James Cook University (No.A1929). 21.
(44) 3.2.1 Methaemoglobin measurement In order to assess the agreement between the spectrophotometric method of Evelyn and Malloy (1938), which was undertaken on a spectrophotometer (Thermo scientific, Genesys 10S UV-VIS), and co-oximetry from a blood gas analyser (Siemens, Rapid Lab 1265, Sydney, NSW) for measuring MetHb concentration, blood samples were pooled and then gently mixed for each species. Each pooled blood sample was divided into replicate aliquots before analysis with either method (cattle 2 replicates, 7 concentrations; goats 3 replicates, 7 concentrations; and sheep 4 replicates, 5 concentrations). Aliquots of the pooled blood (2.5 mL) were treated with 0, 10, 20, 40, 60, 80 or 100 µL of 1% sodium nitrite, dissolved in isotonic saline to produce seven concentrations of MetHb. A buffer was added to the samples to maintain a constant final volume, as outlined in Table 3.1. Untreated and treated samples were analysed in triplicate and the mean of the replicates was taken as the value of MetHb for that sample. The average of the replicates was then used for further calculation against cooximetry results. Table 3.1. Composition of untreated or treated blood samples with sodium nitrate and phosphate buffer to produce a MetHb standard curve for the in vitro determination of MetHb concentration by two methods.. Sample no. Blood (mL). 1% NaNO2 (μL). Phosphate Buffer (μL). 1. 2.5. 0. 400. 2. 2.5. 10. 390. 3. 2.5. 20. 380. 4. 2.5. 40. 360. 5. 2.5. 60. 340. 6. 2.5. 80. 320. 7. 2.5. 100. 300. 22.
(45) 3.2.2 Methaemoglobin measurement using co-oximetry The untreated and nitrite treated blood samples were aspirated into 1 mL blood gas syringes for immediate measurement of MetHb on a blood gas analyser (BGA) with co-oximetry chamber (Siemens, Rapid Lab 1265, Sydney, NSW). At the same time, the Evelyn and Malloy (1938) method was commenced. 3.2.3 Precision Calculation of coefficient variation (CV) between triplicates of MetHb measurements was undertaken in order to assess the precision of each method. 3.2.4 Statistical analysis Data obtained from this study were log transformed to stabilize the variance and allow determination of limits of agreement, since the variability of the differences was not constant. Data were analysed using Graphpad Prism Version 6.04 for Windows (GraphPad Software, La Jolla California USA). For each species, mean values for the replicates at each MetHb concentration were calculated for those analysed using the Evelyn and Malloy (1938) and the co-oximetry methods, and were compared using a paired Student’s t-test. Linear relationships between MetHb concentrations from the Evelyn and Malloy (1938) and the co-oximetry methods were determined from Pearson correlation coefficients by linear regression analysis. To examine how close the values for MetHb % from both methods were, a Bland-Altman scatterplot of the mean values of the two methods, versus the difference between the two methods, was produced (Bland and Altman, 1986). Lin’s concordance correlation coefficient was calculated as an index of agreement between the two methods. Lin’s concordance coefficient (http://gjyp.nl/marta/) was performed using SPSS (IBM SPSS Statistics 22). The strength of agreement for Lin’s concordance coefficient was interpreted using the following 23.
Figure


+7


Related documents
No obstante, el posicionamiento de individuos en este último nivel, apunta la buena recuperación de estas formaciones IVF = 0.20 La composición florística de los sectores quemados
The conflict of interest triggered by incongruence between trustees’ personal goals and organizational ones is the core discussion of agency theory. One of the main instruments used
After comparing the ionic concentrations in the Bardenas Canal, the Riguel river at Sádaba and the Arba at Ejea with the Arba at Tauste which collects all the effluents from
Start- ing from the first general approaches of Armstrong (2006), Caillaud and Jullien (2003) and Rochet and Tirole (2003, 2006), this theory has been applied in several markets
We discuss how molluscan eyes can be applied to the study of evolution by examining patterns of convergent and parallel evolution and provide several examples, such as the
- Leadership Principals and Ethics - School Finance and Management - Advanced Educational Psychology - Leadership and Supervision in Education - Supervision of Instruction.. -
Teachers also shared video clips of their own instruction in their study groups to gain suggestions and insights from their colleagues and to facilitate self-reflection. To
There is no significant difference among customers of different age groups, nativity and income levels as far as their level of satisfaction towards facilities and amenities offered
