R E V I E W
Open Access
Comparison of psychometric properties
between usual-week and past-week
self-reported physical activity questionnaires: a
systematic review
Kenji Doma
1*, Renée Speyer
1,2, Anthony S. Leicht
1and Reinie Cordier
3Abstract
The aim was to critically appraise the methodological quality of studies and determine the psychometric qualities of Past-week and Usual-week Physical Activity Questionnaires (PAQs). Data sources were obtained from Pubmed and Embase. The eligibility criteria for selecting studies included: 1) at least one psychometric property of PAQs was examined in adults; 2) the PAQs either had a recall period of usual 7-days (Usual-week PAQs) within the past 12 months or during the past 7-days (Past-week PAQs); and 3) PAQs were self-administered. Study quality was evaluated using the COSMIN taxonomy and the overall psychometric qualities evaluated using pre-established psychometric criteria. Overall, 45 studies were reviewed to assess the psychometric properties of 21 PAQs with the methodological quality of most studies showing good to excellent ratings. When the relationship between PAQs and other instruments (i.e., convergent validity) were compared between recall methods, Past-week PAQs appeared to have stronger correlations than Usual-week PAQs. For the overall psychometric quality, the Incidental and Planned Exercise Questionnaire for the Usual-week (IPEQ-WA) and for the Past-week (IPEQ-W) had the greatest number of positive ratings. For all included PAQs, very few psychometric properties were assessed with poor ratings for the majority of the overall qualities of psychometric properties indicating the limitation of current PAQs. More research that covers a greater spectrum of psychometric properties is required to gain a better understanding of the qualities of current PAQs.
Keywords:Physical activity questionnaires, Recall methods, Psychometrics, Validity, Reliability
Background
Increasing the level of physical activity (PA) is para-mount for improving physical and psycho-social health across a wide range of populations [1]. In fact, physical inactivity is now considered to be one of the four leading risk factors for developing chronic disease and global mortality [2]. Subsequently, measuring the level of PA is important to ascertain at-risk populations and monitor interventions aimed at reducing chronic disease develop-ment. However, PA determination is only viable when implementing valid and reliable measures that: a) deter-mine frequency, intensity and type of PA; b) identify
individuals that meet health recommendations; and c) evaluate the effectiveness of various PA modalities on specific outcome measures [3].
Several objective measures of PA have been developed including accelerometers, pedometers and heart rate monitors [4]. Whilst these methods are considered valid and reliable for determining PA level [4], they are often too costly and/or cumbersome to use. Furthermore, the validity of accelerometer-based estimates of PA has also been called into question [5]. Prior to these objective measuring devices, subjective measures such as PA questionnaires (PAQs) were used to determine PA level and still remain the preferred method as they can be self-administered and convenient and cost-effective, par-ticularly in large-scale clinical trials [6]. However, misre-porting of PA is common with PAQs, particularly due to
* Correspondence:kenji.doma@jcu.edu.au
1College of Healthcare Sciences, James Cook University, Townsville, QLD, Australia
Full list of author information is available at the end of the article
difficulties recalling the intensity and type of PA per-formed previously [7]. Subsequently, greater attention is needed to determine the quality of psychometric proper-ties of a range of PAQs.
Currently, there are two main recall methods that deter-mine previous PA level. The first method identifies recent PA level over the past 7 days (i.e., Past-week PAQs) [8]. The second method assesses average week PA level within the past 1–12 months (i.e., Usual-week PAQs) [9]. Both types of PAQs have several advantages and disadvantages. For example, Usual-week PAQs can provide habitual PA patterns minimising the inherent weekly variation in PA [10]. However, respondents may experience difficulty in recalling their PA patterns over a longer period of time, particularly at light-moderate intensities [11]. Conversely, Past-week PAQs result in more accurate recall of recent PA patterns and therefore may better represent objective measures [12]. However, Past-week PAQs do not account for week-to-week variability in PA level and thus may mis-classify individuals as physically active/inactive. Therefore, Past-week and Usual-week PAQs provide distinct charac-teristics of PA which researchers need to consider when selecting PAQs for their intervention. Delbaere et al. [13] compared different recall versions (i.e., Past-Week [W] vs. Average Weekly PA over the past three months [WA]) of the Incidental and Planned Exercise Questionnaire (IPEQ) in older people noting that IPEQ-WA had better psycho-metric properties overall, with better internal consistency and higher test-retest reliability than the IPEQ-W. How-ever, examination of convergent validity against objective measures (e.g., accelerometers, pedometers) was not con-ducted for each recall method of IPEQ, despite using ob-jective measures considered as the best approach for establishing PAQ validity [14]. Furthermore, whilst [13] measured test-retest reliability, convergent validity, struc-tural validity and internal consistency, they did not compare measurement error between W and IPEQ-WA and content validity was not addressed. In order to identify the delimitations of PAQs due to different recall methods, and to assist practitioners and researchers with the best selection of robust PAQs, all psychometric properties of PAQs should be evaluated.
The Consensus-based Standards for the selection of health Measurement Instrument (COSMIN) group devel-oped a critical appraisal tool to evaluate the methodo-logical quality of studies that examined the psychometric properties of health measurement instruments [15]. This appraisal tool, known as the COSMIN checklist, allows for determination of the quality of study design and statis-tical analyses on validity, reliability and responsiveness of questionnaires [15]. Silsbury et al. [16] recently examined the methodological quality of studies examining the psy-chometric properties of ten selected self-reported PAQs using the COSMIN checklist. The authors reported
fair-to-good test-retest reliability of PAQs and variable conver-gent validity against other objective measures. Whilst these findings provide insight on the usability of the 10 se-lected PAQs, the authors did not provide a clear descrip-tion of the inclusion/exclusion criteria used for selecting PAQs nor give consideration for PAQs recall methods which introduces bias. Furthermore, appropriate search strategies for literature database using ‘subject headings’ and‘free texts’were not reported, limiting the replicability of the searches. Moreover, [16] did not interpret the psy-chometric quality of PAQs based on an established quality criterion. Terwee et al. [17] developed a quality criterion to interpret results from studies assessing the psychomet-ric properties of questionnaires based on previously
exist-ing guidelines and consensus amongst experts.
Furthermore, [18] suggested synthesising and combining results from COSMIN rating of study quality and [17] rat-ing of psychometric quality to report the overall quality of psychometric properties of each questionnaire.
Indeed, previous studies have used similar quality cri-teria to review the psychometric quality of self-reported PAQs [19–21]. However, these review papers appeared to have been derived by the same literature search and were separated according to PAQs for youth [20], adults [19] and the elderly [21]. Combining results of studies that have examined the psychometric qualities of PAQs amongst different population groups may provide a more holistic understanding of the usability of existing PAQs. Furthermore, the computerised search for these systematic reviews [19–21] was conducted in May 2009 and thus warrants an update considering the constant growing body of literature in psychometrics. Import-antly, none of the systematic reviews published to date have systematically compared the quality of psychomet-ric properties between PAQs with different recall methods (e.g., usual-week versus past-week PAQs) using previously established quality criteria.
Therefore, the aims of this systematic review were to critically appraise the methodological quality of studies that have examined the psychometric properties of past-week and usual-past-week PAQs in adult and elderly popula-tions using the COSMIN checklist to determine the overall psychometric quality for each PAQ, and to com-pare the quality of measurement properties between past-week and usual-week PAQs. Identification of recall differences would substantially assist practitioners and researchers with their selection and implementation of robust and high quality PAQs.
Methods
The methodology and reporting of this systematic review was based on the PRISMA guidelines which enables
transparent and complete reporting of systematic
Inclusion/exclusion criteria
The following inclusion criteria for studies were adhered to: 1) studies that examined at least one measurement property of PAQs used in adults (i.e., ≥18 years of age); 2) studies that were written in English; 3) studies that examined PAQs with a recall period of 7-days PA within the past 12 months (i.e., Usual-week PAQs) or studies that examined PAQ during the past 7-days (i.e., Past-week PAQs); 4) studies that examined self-administered PAQs; and 5) studies where the PAQ identified the following PA characteristics: duration, intensity and/or type of PA performed. Studies were excluded if: 1) ques-tionnaires were based on physical function measures; 2) PAQs were administered as an interview; and 3) results were published as a conference abstract, review or case report. Studies were excluded if questionnaires were translated into a language other than English.
Search strategy
A systematic literature search was conducted to identify all relevant studies examining the measurement proper-ties of PAQs in adults. Two electronic data bases (Med-line and EMBASE) were used with searches conducted between July 1st 2016 and July 15th 2016, using both free-text words and subject headings (Table 1). All pri-mary sources (i.e., journal articles) up to July 2016 were considered as part of the search.
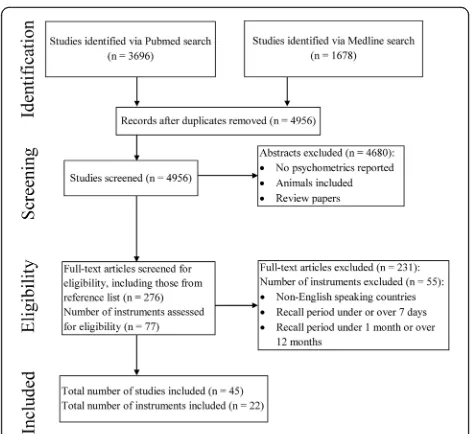
From the search strategy, a total of 4056 abstracts were retrieved including duplicates. Duplicates (n= 75) were removed and which resulted in 3981 abstracts that underwent further screening. The summary of the search process is presented in Fig. 1.
Selection process
Two independent reviewers conducted the stepwise literature search. Firstly, all titles and abstracts that po-tentially met the eligibility criteria were screened as either meeting the eligibility criteria (“yes”), potentially meeting the eligibility criteria (“maybe”) or not meeting the eligibility criteria (“no”). Following abstract screen-ing, a random sample (40%) of the abstracts was reviewed to determine the inter-rater reliability between both reviewers. A Weighted Kappa calculation of 0.76 (95% CI: 0.71–0.82) was obtained and considered as ac-ceptable for inter-rater reliability [23]. Following this confirmation, all corresponding original journal articles (both “yes” and “maybe”) were retrieved and further screening was undertaken based on the inclusion/exclu-sion criteria.
Methodological quality using COSMIN taxonomy
The methodological quality of included studies was assessed using the COSMIN taxonomy of measurement properties with definitions for health-related patient-reported outcomes shown in Table 2. The COSMIN checklist consists of nine domains: internal consistency,
reliability(test-retest reliability, inter-rater reliability and
intra-rate reliability), measurement error(absolute mea-sures), content validity, structural validity, hypothesis
testing, cross-cultural validity, criterion validity and
re-sponsiveness [15]. Of these domains, responsiveness,
cross-cultural validity and criterion validity were not
assessed for the following reasons: responsiveness – de-termination of the instrument’s sensitivity to changes over time was beyond the scope of the current review;
[image:3.595.56.546.507.733.2]cross-cultural validity – questionnaires assessed in
Table 1Search terms and databases
Initial search: Assessment retrieval
Database and Search Terms Limitations
Subject Headings Embase: (Questionnaire/OR Health status/OR“severity of illness index”/) AND (Physical capacity/OR“physical constitution and health”/OR“movement (physiology)”/OR“physical activity, capacity and performance”/OR Exercise/OR Performance/OR Motor performance/) AND (Validation study/OR validity/OR Psychometry/OR Reliability/OR Measurement accuracy/OR measurement error/OR measurement precision/OR measurement repeatability/)
Humans; English; Adult: 18 to 64 years OR Aged: 65+ years
PubMed: (“Physical Conditioning, Human”[Mesh] OR“Physical Fitness”[Mesh] OR
“Physical Therapy Modalities”[Mesh] OR“Physical Endurance”[Mesh] OR“Physical Exertion”[Mesh] OR“Exercise”[Mesh] OR“Motor Activity”[Mesh] OR“Exercise”[Mesh] OR“Exercise Movement Techniques”[Mesh] OR“Exercise Therapy”[Mesh] OR
“Psychomotor Performance”[Mesh] OR“Motor Skills”[Mesh] OR“Motor Activity”[Mesh]) AND (“Questionnaires”[Mesh]) AND (“Psychometrics”[Mesh] OR“Reproducibility of Results”[Mesh] OR“Validation Studies as Topic”[Mesh] OR“Bias (Epidemiology)”[Mesh] OR“Observer Variation”[Mesh])
Humans; English; Adult: 19+ years
Free Text Words Embase:(questionnaire*) AND (physic* OR movement* OR capacit* OR exercise* OR train* OR performance* OR motor) AND (psychometric* OR reliability OR validit* OR reproducibility OR bias)
Publication date from 2013– current; Adult: 18 to 64 years OR Aged: 65+ years
PubMed:As per Embase Free Text Publication date from 2013/05/01
languages other than English were excluded during screening; andcriterion validity –currently, there is no globally-accepted ‘golden standard’ based on consensus for assessing PA level [24, 25]. Interpretability was not examined as this component is not considered as a psy-chometric property. Each domain of the COSMIN checklist was assessed using scales consisting of 5 to 18 items that addressed issues on study design and statis-tical analyses. To determine the overall methodological quality per domain, [15] suggested to report the lowest item rating within the domain using their 4-point rating system (i.e., excellent, good, fair and poor, respectively). However, as this scoring system does not account for subtle differences in the psychometric qualities of each study, a revised version was implemented as previously described [26]. The raw item scores were transformed into a percentage of rating using the following formula:
Total score of each domain¼ ððTotal score obtainedHighest score possibe−−minimum score possibleminimum score possibleÞÞ 100
The final rating percentage for each domain was then qualitatively defined using the following categories: Poor = 0–25.0%, Fair = 25.1–50.0%, Good = 50.1–75.0%, Excellent = 75.1–100.0% [26]. Furthermore, all studies were appraised by two raters, independently with differ-ences in ratings resolved via consensus.
Quality of the psychometric properties
To compare the strength ofreliability(i.e., test-retest re-liability) between Usual-week and Past-week PAQs, we calculated the weighted mean of correlation coefficients (i.e., r-values) using the following formula:
x¼
X i¼1
n
wixi X
i¼1 n
wi
Wherew= r-value of each study andx= sample size of each study
[image:4.595.56.292.85.302.2]The weighted means of the r-values were calculated to account for sample size varying between comparisons within studies or between studies. When the sample size of each comparison was identical, the normal non-weighted r-values were averaged. The mean r-values were also calculated to compare the strength of Fig. 1Flowchart of included studies and physical activity questionnaires
Table 2Definitions for aspects of domains and measurement
properties from the COSMIN checklist by Mokkink et al. (2010)
Reliability
The degree to which the measurement is free from measurement error
Internal consistency
The degree of the interrelatedness among the items
Reliability
The proportion of the total variance in the measurements which is because of“true”differences among patients
Measurement error
The systematic and random error of a patient’s score that is not attributed to true changes in the construct to be measured
Validity
The degree to which an HR-PRO instrument measures the construct(s) it purports to measure
Content validity
The degree to which the content of an HR-PRO instrument is an adequate reflection of the construct to be measured
Face validity
The degree to which an HR-PRO instrument indeed looks as though they are an adequate reflection of the construct to be measured
Construct validity
The degree to which the scores of an HR-PRO instrument are consistent with hypotheses based on the assumption that a HR-PRO measure validly measures the construct to be measured
Structural validity
The degree to which the scores of an HR-PRO measure are an adequate reflection of the dimensionality of the construct to be measured
Hypotheses testing Item construct validity
Cross-cultural validity
The extent to which performance of the items from translated or culturally adapted measures adequately replicates the performance of the items from original versions of the measure
Criterion validity
The degree to which the scores of a measure adequately reflect a
“gold standard” Responsiveness
The measure’s sensitivity to changes in the construct to be measured over time
Interpretabilitya
The extent to which qualitative meaning can be derived from a measure’s quantitative scores or score change
a
[image:4.595.301.539.94.582.2]convergent validitybetween Usual-week and Past-week PAQs and between PAQs compared with direct mea-sures (e.g., accelerometers, pedometers, PA diaries) and PAQs with indirect measures (e.g., maximal oxygen con-sumption test [VO2max]). The strength of the r-values was interpreted based on Cohen’s classifications in the order of 0.10 as weak, those of 0.30 as moderate, and those of 0.50 as strong in terms of magnitude [27].
We also classified the psychometric quality of each measurement property for each study as either “ posi-tive” (+),“conflicting” (±), “indeterminate” (?), “ nega-tive” (−) “not reported” (NR) or “not evaluated” (NE) using quality criteria as previously described (Table 3) [17, 28]. For example, if the reported intra-class cor-relation coefficient (ICC) was 0.9 (≥0.7 classified as acceptable), then the psychometric quality for that particular psychometric property of the study will be classified as “positive”. Conversely, if the reported ICC was 0.6 (not acceptable given that it is less than 0.7), then the psychometric quality of the study will be classified as “negative”. If a number of reliability analyses had ICC values of above (i.e., ≥ 0.7) and below (i.e., < 0.7) acceptable standards within the same study, than the psychometric quality of the study will be classified as “conflicting”. Studies that received a poor COSMIN rating were excluded from
further analysis and were classified as “not
evaluated” (NE).
To determine the overall quality per psychometric property for each PAQ, the methodological quality based on the COSMIN checklist and the psychometric quality based on [17] of each study were combined to determine the Level of Evidence [18], thus generating an overall psychometric quality rating.
Data items and synthesis of results
Relevant items from the COSMIN checklist and from the quality criteria by [17] and [18] were ana-lysed for each included study. Results were assessed and reported using the following sequence: 1) the description of the systematic literature search; 2) the characteristics of the instruments and description of all studies included in this review; 3) the methodo-logical quality of each study reporting on psychomet-ric properties of included PAQs based on the
COSMIN checklist; 4) the psychometric quality
based on the criterion by [17] for each psychometric property per study, including a comparison of the magnitude of weighted r-values of test-retest
reliabil-ity and convergent validity; 5) the overall rating of
[image:5.595.303.536.106.732.2]psychometric properties using the Levels of Evidence by [18] for each PAQ and its comparison between Usual-week and Past-week PAQs.
Table 3Modified criteria of psychometric quality rating based
on Terwee, Bot [15] and Cordier, Chen [26]
Psychometric property Scorea Quality Criteriab
Content validity + A clear description is provided of the measurement aim, the target population, the concepts that are being measured, and the item selection AND target population and (investigators OR experts) were involved in item selection
? A clear description of above-mentioned aspects is lacking OR only target population involved OR doubtful design or method
- No target population involvement
± Conflicting results
NR No information found on target population involvement
NE Not evaluated due to“poor” methodological quality
Structural validity + Factor analysis performed with adequate sample size. Factors should explain at least 50% of the variance
? No factor analysis performed and explained variance not mentioned
- Factors explain <50% of the variance
± Conflicting results
NR No information found on structural validity
NE Not evaluated due to“poor” methodological quality
Hypothesis testing + Specific hypotheses were formulated AND at least 75% of the results are in accordance with these hypotheses; Convergent validity: correlation between similar assessments is at a statistically significant level (p< 0.05) and strength of relationship is≥0.5 which is consistent with the hypothesis; Discriminant validity: uses appropriate statistical analysis (e.g., t-testp< 0.05 or Cohen’s d effect size≥0.5)
? Doubtful design or method (e.g., no hypotheses)
- Less than 75% of hypotheses were confirmed, despite adequate design and methods; Convergent validity: correlation between similar assessments is not at a statistically significant level (p≥0.05) and strength of relationship is <0.5 which is inconsistent with hypothesis
± Conflicting results between studies within the instrument
NR No information found on hypotheses testing
NE Not evaluated due to“poor” methodological quality
Results
Systematic literature search
A total of 3981 abstracts were screened based on the in-clusion criteria after removal of duplicate abstracts from the two databases. Following screening, 255 original arti-cles and their corresponding 76 PAQs were assessed for eligibility. Of these, 21 PAQs met the inclusion criteria, while 55 PAQs were excluded. Reasons for exclusion of PAQs included: recall period of only 24 h; single-item PAQs; no specific recall periods; recall periods of over 7 days; recall periods of less than 7 days; and a
combination of various recall periods. Accordingly, the psychometric properties of 21 PAQs were evaluated using 44 of the corresponding original articles.
Included physical activity questionnaires
The characteristics of the 21 included PAQs and de-scription of studies for the development and validation of PAQs are displayed in Tables 4 and 5, respectively. Seven PAQs assessed 7-days of Usual PA level with a 12-month recall period for three PAQs, a 3-12-month recall period for three PAQs, and a 1-month recall period for one PAQ. Conversely, 14 PAQs assessed PA level over the Past 7-days. The subscales for the majority of PAQs were separated by intensity of PA level (e.g., light, mod-erate and vigorous) although a number of other PAQs were categorised according to mode of activity (e.g., walking, stairs, transportation, occupational and yard activities).
Psychometric properties of PAQs
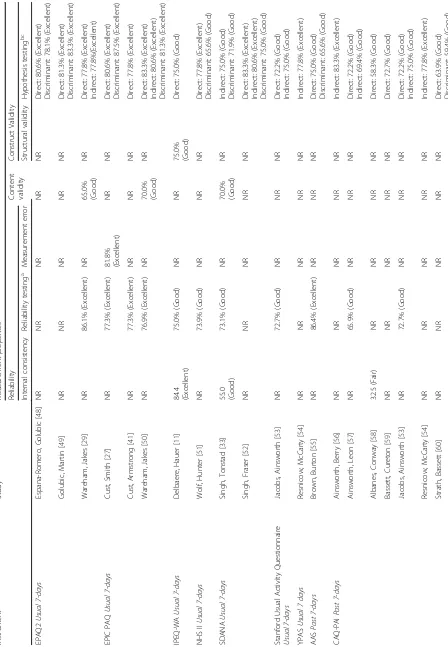
Based on the COSMIN rating method for all included 21 PAQs (Table 6), none of the studies showed “poor” ratings and thus the psychometric qualities of all studies were rated. The most frequently reported psychometric properties were hypothesis testing (all 21 PAQs) which ranged from good to excellent quality. This was followed by reliability testing (18 PAQs), which ranged from fair to excellent quality; content validity (7 PAQs), which ranged from fair to excellent quality; and internal
consistency (6 PAQs), which ranged from fair to
excel-lent quality. The least reported psychometric properties
were structural validity (2 PAQs) with good qualities
and measurement error (2 PAQs) ranging from good to
excellent quality.
Table 7 provides a comparison of the magnitude of the weighted mean of the r-values for test-retest reliability
and convergent validity. The magnitude of the weighted
mean of the r-values of PAQs were compared with direct measures (e.g., other PAQs, diaries or objective mea-sures) or indirect measures (e.g., VO2max test). A fur-ther comparison was done between the magnitude of the weighted mean of the r-values fortest-retest reliabil-ity of Usual-week and Past-week PAQs. The magnitude of the r-values for both Usual-week and Past-week PAQs were comparable (r= 0.62) with similar sample sizes (n = 1071 and 901, respectively). Only one study (Stanford Usual Activity Questionnaire) compared test-retest
reli-ability between both direct (accelerometer) and indirect
[image:6.595.55.290.112.517.2](VO2max test) measures with both objective measures showing higher test-retest reliability (r= 0.67 and 0.68, respectively) than the Stanford Usual Activity Question-naire (Subjective measure; r= 0.46). When comparing convergent validity between recall methods, the magni-tude of the weighted mean of the r-values appeared Table 3Modified criteria of psychometric quality rating based
on Terwee, Bot [15] and Cordier, Chen [26](Continued)
Cronbach’s alpha(s) calculated per dimension AND Cronbach’s alpha(s) between 0.70 and 0.95
? No factor analysis OR doubtful design or method
- Cronbach’s alpha(s) <0.70 or >0.95, despite adequate design and method
± Conflicting results
NR No information found on internal consistency
NE Not evaluated due to“poor” methodological quality
Reliability + ICC or weighted Kappa 0.70
? Doubtful design or method (e.g., time interval not mentioned)
- ICC or weighted Kappa <0.70, despite adequate design and method
± Conflicting results
NR No information found on reliability
NE Not evaluated due to“poor” methodological quality
Measurement errorc + MIC < SDC OR MIC outside the LOA OR convincing arguments that agreement is acceptable
? Doubtful design or method OR (MIC not defined AND no convincing arguments that agreement is acceptable)
- MIC SDC OR MIC equals or inside LOA, despite adequate design and method
± Conflicting results
NR No information found on measurement error
NE Not evaluated due to“poor” methodological quality a
Scores: positive rating (+), indeterminate rating (?), negative rating (−), conflicting data (±), not reported (NR), not evaluated (NE)
b
Doubtful design or method is assigned when a clear description of the design or methods of the study is lacking, sample size smaller than 50 subjects (should be at least 50 in every subgroup analysis), or any important methodological weakness in the design or execution of the study c
Table
4
Characteristics
of
instruments
assessing
level
of
physical
activity
(Continued)
D
ipietro,
Cas
perse
n
[
35
]
Vigoro
usness
of
activ
ity:
•
Frequenc
y/week
or/
mont
h
Leisu
rely
wal
k:
•
Frequenc
y/week
or/
mont
h;
Durat
ion
in
min
utes
Gener
al
move
ment:
•
Hours/day
Standi
ng
and
sitt
ing:
•
Hours/day
Seasonal
chang
es:
•
Compare
current
season
AAS
Past
7-days
Popu
lation
survei
llance
of
phy
sical
activ
ity
in
Australian
adu
lts
Co
mmission
[
36
]
1997
Past
7-d
ays
4
8
Walking
activ
ities:
Vigoro
us
yard
work:
Vigoro
us
activit
ies
othe
r
than
yard
work:
Mod
erate
activ
ities:
•
Frequenc
y/week;
Hours
:
min
utes/week
CAQ-P
AI
Past
7-days
To
measu
re
overa
ll
kilocalorie
s
exp
ended
in
leisu
re-time
phy
sical
activ
ity
Paff
enb
arger,
Wi
ng
[
37
]
1978
Past
7-d
ays
3
4
Walking: •
Blocks/day
Stair
s:
•
Flights/day
Recr
eational
activ
itie
s:
•
Frequenc
y/week;
Hours
:
min
utes/session
Checkli
st
Quest
ionnaire
Past
7-days
Ass
ess
the
frequency
an
d
dur
ation
of
physical
activities
performed
in
the
pre
viou
s
7
days
Mas
se,
Fu
lton
[
38
]
2012
Past
7-d
ays
10
64
Self-re
por
t
Hous
ehold
activ
ities:
Yard
activ
ities:
Famil
y
activit
ies:
Comm
unity/voluntee
r/
church: Transportation: Miscel
laneo
us:
Othe
r
time
:
•
Frequenc
y/week;
Hours
:
min
utes/week
Interview Exercis
e,
sports
an
d
danc
ing:
Empl
oyment
:
Miscel
laneo
us:
•
Frequenc
y/week;
Hours
:
min
utes/week
GPPA
Q
Past
7-days
Ass
esses
the
durati
on
of
phy
sical
activ
itie
s
performed
in
the
pre
vious
7
days
H
ealth
[
39
]
2013
Past
7-d
ays
2
8
Occupational
activit
ies
Gener
al
exerc
ise
Table
4
Characteristics
of
instruments
assessing
level
of
physical
activity
(Continued)
Walking Hous
ewo
rk/Childcare
Gar
dening/
DIY
•
Hours/week
IPAQ-LF
Past
7-days
Ass
esses
physical
activity
level
that
can
be
used
to
obtain
internat
ionall
y
com
parable
dat
a.
Tu
dor-Lock
e,
Ains
wort
h
[
40
]
2002
Past
7-d
ays
As
for
IPAQ-LF
(Te
lephon
e)
As
for
IPA
Q-LF
(Tele
phone)
As
IPA
Q-LF
(Te
lephone)
IPAQ-S
F
Past
7-days
As
for
IPAQ
-LF
Tu
dor-Lock
e,
Ains
wort
h
[
40
]
2002
Past
7-d
ays
4
7
Vigoro
us
activit
ies
Mod
erate
activ
ities
Light
activ
ities
Sitting
time
•
Days/week;
Ho
urs:
min
utes/day
IPAQ-S
F
w/r
ecall
confid
ence
Pa
st
7-days
To
measu
re
self-reported
conf
idenc
e
rati
ngs
in
recall
of
phy
sical
activ
ity
bas
ed
on
IPA
Q-SF
(self-adm
inistere
d)
Cus
t,
Arm
stro
ng
[
41
]
2009
Past
7-d
ays
5
14
Vigoro
us
activit
ies:
Mod
erate
activ
ities:
Light
activ
ities:
Sede
ntary
activ
itie
s:
•
Days/week;
Ho
urs:
min
utes/day
Conf
idenc
e
ratings
:
•
Very
unsure;
quite
unsure;
abou
t
50/5
0;
qui
te
sure;
very
sure
IPEC
-WA
Usual
7-days
To
asses
s
frequ
ency
and
duratio
n
of
se
veral
levels
of
inciden
tal
and
pla
nned
physical
activ
ity
in
older
pe
ople
during
the
past
3
mont
hs
D
elbaere,
H
auer
[
11
]
2010
Past
7-d
ays
3
11
Type
of
activ
ity:
•
Frequenc
y/week;
0
–
4
h/sess
ion
Walking
activ
ities:
•
Frequenc
y/week;
0
–
4
h/da
y
Hous
ehold
activ
ities:
•
0
–
4
h/da
y
OSPAQ
Past
7-days
To
measu
re
occup
ational
sitting,
st
anding,
and
ph
ysical
activ
ity
time
Ch
au,
Van
D
er
Ploeg
[
42
]
2012
Past
7-d
ays
2
6
Time
at
occ
upation:
•
Hours/week
;
Days/
week Occupational
activit
ies:
•
Percent
age
of
total
time
at
work
OSWE
Q
Past
7-days
To
monito
r
PA
via
the
Web
Tayl
or,
Lawt
on
[
43
]
2013
Past
7-d
ays
-Physi
cal
Activity
Scal
e
for
the
Elde
rly
(PASE)
Past
7-days
To
asses
s
leisure,
occup
ation
al
and
hou
sehold
physical
activ
itie
s
among
st
the
el
derly
Was
hburn,
Sm
ith
[
44
]
1991
Past
7-d
ays
3
27
Recr
eational
activ
itie
s:
•
Frequenc
y/week;
<
1h
,
1
–
2h
,
2
–
4
h
or
>4
h
Hous
ehold
activ
ities:
•
Yes
or
no;
Type
of
activ
ities
Occupational
activit
ies:
•
Hours/week
;
Type
of
activ
Table
4
Characteristics
of
instruments
assessing
level
of
physical
activity
(Continued)
PA
Reca
ll
Instrument
Past
7-days
Ass
ess
multiple
domains
of
phy
sical
activ
ity
agai
nst
acce
leromet
er
data
amon
g
overw
eight
an
d
non-ov
erweigh
t
adults
Ti
mperio
,
Sal
mon
[
45
]
2003
Past
7-d
ays
3
3
Light
activ
ities:
Mod
erate
activ
ities:
Vigoro
us
activit
ies:
•
Frequenc
y/week
for
≥
10
min
SPAQ2
Past
7-d
ays
To
measu
re
stage
of
exercise
be
haviou
r
chang
e
and
7
day
recal
l
of
physical
activity
Lo
wther,
Mu
trie
[
46
]
1997
Past
7-d
ays
2
8
Recr
eational
activ
itie
s:
Occupational
activit
ies:
•
Hours/day;
Hours/week
Stanf
ord
7-d
ay
Physi
cal
Activity
Reca
ll
(PAR)
Past
7-days
To
asses
s
slee
p
and
physical
activity
pat
terns
Sal
lis,
Haske
ll
[
34
]
1985
Past
7-d
ays
6
15
Occupational
activit
ies:
•
Yes
or
No;
Frequ
ency
/
week;
Hours/week
;
Days/
week Mod
erate,
Hard
and
Very
Hard
in
the
Morni
ng:
Mod
erate,
Hard
and
Very
Hard
in
the
Af
ternoon
:
Mod
erate,
Hard
and
Very
Hard
in
the
Even
ing:
Stre
ngth:
Flexibi
lity:
•
Minutes
TPAQ
Past
7-days
To
measu
res
physical
activ
itie
s
for
recre
atio
n
an
d
trans
port
Adam
s,
Goad
[
47
]
2014
Past
7-d
ays
3
21
Transport
to
work
;
busine
ss;
sc
hool;
sho
ps;
friend
s:
•
Frequenc
y/week;
Hours
:
min
utes/trave
l;
Distanc
e/travel
(m
iles)
Recr
eational
activ
itie
s
for
wal
king
an
d
cyc
ling:
•
Frequenc
y/week;
Hours
:
min
utes/week
Vigoro
us
and
moderate-vigorous
activ
ities:
•
Frequenc
y/week
•
Hours:
minut
es/wee
k
EPAQ2
EPIC
Physical
Activity
Questionnaire
2,
EPIC
PAQ
EPIC
Physical
Activity
Questionnaire,
IPEC-WA
Incidental
and
Planned
Exercise
Questionnaire
for
the
Usual-week,
IPEC-W
Incidental
and
Planned
Exercise
Questionnaire
for
the
Past-week,
NHS
II
Nurse
’
s
Health
Study,
SDANA
Seven-day
Adventists
and
non-Adventists,
YPAS
Yale
Physical
Activity
Survey,
AAS
Active
Australia
Survey,
CAQ-PAI
College
Alumnus
Questionnaire
Physical
Activity
Index,
GPPAQ
General
practice
physical
activity
questionnaire,
IPAQ-LF
International
Physical
Activity
Questionnaire
–
Long
Form,
IPAQ-SF
International
Physical
Activity
Questionnaire
–
Short
Form,
OSPAQ
Occupational
Sitting
&
Physical
Activity
Questionnaire,
OSWEQ
Online
Self-reported
Walking
and
Exercise
Questionnaire
,
PASE
Physical
Activity
Scale
for
the
Elderly,
SPAQ2
Scottish
Physical
Activity
Questionnaire,
PAR
Stanford
7-day
Physical
Activity
Recall,
TPAQ
Transport
Physical
Activity
Table
6
Overview
of
the
methodological
quality
assessment
of
usual-week
and
pa
st-week
physical
activity
questionnaires
using
the
COSMIN
checklist
(Continued)
Stanf
ord
7-d
ay
Physi
cal
Ac
tivity
Re
call
(PAR
)
Past
7-days
Ains
wort
h,
Jaco
bs
[
76
]
NR
79.5%
(Excellen
t)
NR
NR
NR
Direct:
80
.0%
(Exce
llent)
Ains
wort
h,
Richardson
[
77
]
NR
NR
NR
NR
NR
Direct:
80
.6%
(Exce
llent)
D
ishman
and
Steinh
ardt
[
78
]
54.5 (Good)
63.6%
(Good)
NR
NR
NR
Direct:
72
.2%
(Good)
Indirect
:
72.2%
(Go
od)
Jac
obs,
Ainswort
h
[
53
]
NR
72.7%
(Good)
NR
NR
NR
Direct:
72
.2%
(Good)
Indirect
:
75.0%
(Go
od)
TPAQ
Past
7-days
Adam
s,
Goad
[
47
]
NR
77.1%
(Excellen
t)
NR
70
.0%
(Go
od)
NR
Direct:
77
.8%
(Exce
llent)
Notes.
aAll
test-retest
reliability
tests;
bDirect
comparisons
of
physical
activity
measures
(e.g.,
physical
activity
level
between
PAQ
and
other
PAQs,
diaries
or
objective
measures)
for
conv
ergent
validity;
cIndirect
comparisons
of
physical
activity
measures
(e.g.,
physical
activity
level
between
PAQ
and
physical
fitness,
given
the
assumption
that
individuals
w
ith
greater
level
of
physical
activity
would
have
a
greater
level
of
physical
fitness)
for
construct
validity
EPAQ2
EPIC
Physical
Activity
Questionnaire
2,
EPIC
PAQ
EPIC
Physical
Activity
Questionnaire,
IPEC-WA
Incidental
and
Planned
Exercise
Questionnaire
for
the
Usual-week,
IPEC-W
Incidental
and
Planned
Exercise
Questionnaire
for
the
Past-week,
NHS
II
Nurse
’
s
Health
Study,
SDANA
Seven-day
Adventists
and
non-Adventists,
YPAS
Yale
Physical
Activity
Survey,
AAS
Active
Australia
Survey,
CAQ-PAI
College
Alumnus
Questionnaire
Physical
Activity
Index,
GPPAQ
General
practice
physical
activity
questionnaire,
IPAQ-LF
International
Physical
Activity
Questionnaire
–
Long
Form,
IPAQ-SF
International
Physical
Activity
Questionnaire
–
Short
Form,
OSPAQ
Occupational
Sitting
&
Physical
Activity
Questionnaire,
OSWEQ
Online
Self-reported
Walking
and
Exercise
Questionnaire
,
PASE
Physical
Activity
Scale
for
the
Elderly,
SPAQ2
Scottish
Physical
Activity
Questionnaire,
PAR
Stanford
7-day
Physical
Activity
Recall,
TPAQ
Transport
Physical
Activity
Table 7The weighted mean of the correlation coefficients (r-value) for reliability testing and validity of Past-week and Usual-week PAQs
Reliability Testing
Instrument r-values Sample (n)
EPAQ2 Usual-week
0.66 399
EPIC-PAQK Usual-week
0.65 270
IPEQ-WAI Usual-week
NR NR
NHS II Usual-week
0.51 231
SDANA Usual-week
0.69 112
Stanford Usual-week
0.46 59
YPAS Usual-week
NR NR
AAS Past-week
0.59 159
CAQ-PAI Past-week
0.69 118
Checklist Past-week
NR NR
IPAQ-LF Past-week
NR NR
IPAQ-SFI Past-week
NR NR
IPAQ-SF-R Past-week
0.46 83
IPEQ-WI Past-week
NR NR
OSPAQI
Past-week
NR NR
OSWEQ Past-week
0.74 49
PASE Past-week
0.75 218
PA RecallI Past-week
NR NR
SPAQ Past-week
0.99 34
Stanford Past-week
0.48 240
TPAQI,K Past-week
NR NR
Average for Usual-week PAQs 0.62 1071
Average for Past-week PAQs 0.62 901
Validity testing
EPAQ2 Usual-week
Direct & Indirect 0.18 4386
Direct 0.18 4386
Table 7The weighted mean of the correlation coefficients (r-value) for reliability testing and validity of Past-week and
Usual-week PAQs(Continued)
Indirect 0.03 173
EPIC-PAC Usual-week
Direct & Indirect 0.22 266
Direct 0.21 266
Indirect NR NR
IPEQ-WA Usual-week
Direct & Indirect 0.82 50
Direct 0.05 173
Indirect NR NR
NHS II Usual-week
Direct & Indirect 0.69 233
Direct 0.69 233
Indirect NR NR
SDANA Usual-week
Direct & Indirect 0.20 327
Direct 0.28 138
Indirect 0.16 296
Stanford Usual-week
Direct & Indirect 0.19 69
Direct 0.05 73
Indirect 0.33 64
YPAS Usual-week
Direct & Indirect 0.09 138
Direct 0.43 159
Indirect 0.09 138
AAS Past-week
Direct & Indirect 0.43 159
Direct 0.43 159
Indirect NR NR
CAQ-PAI Past-week
Direct & Indirect 0.14 1178
Direct 0.28 297
Indirect 0.12 1064
Checklist Past-week
Direct & Indirect 0.31 220
Direct 0.31 220
greater for Past-week than Usual-week, particularly when PAQs were compared against direct measures with a moderately strong relationship for the Past-week (r= 0.33) versus a weak relationship for the Usual-week (r= 0.20) PAQs. When examining the weighted mean of the r-values between PAQs compared against direct measures and indirect measures, similar results were found for Usual-week PAQs (r= 0.20 and 0.13, respect-ively) and when Usual-week and Past-week PAQs were combined (r= 0.25 and 0.22, respectively). However, there was a moderate relationship between Past-week PAQs and direct measures (r= 0.33) compared to a weak relationship between Past-week PAQs and indir-ect measures (r= 0.24).
[image:19.595.64.279.122.719.2]Table 8 provides the quality of psychometric properties of Usual-week and Past-week PAQs based on the quality Table 7The weighted mean of the correlation coefficients
(r-value) for reliability testing and validity of Past-week and
Usual-week PAQs(Continued)
IPAQ-LF Past-week
Direct & Indirect NR NR
Direct NR NR
Indirect NR NR
IPAQ-SF Past-week
Direct & Indirect 0.41 113
Direct 0.41 113
Indirect NR NR
IPAQ-SF-R Past-week
Direct & Indirect 0.27 85
Direct 0.27 85
Indirect NR NR
IPEQ-W Past-week
Direct & Indirect 0.82 50
Direct 0.82 50
Indirect NR NR
OSPAQ Past-week
Direct & Indirect 0.49 103
Direct 0.49 103
Indirect NR NR
OSWEQ Past-week
Direct & Indirect 0.42 49
Direct 0.42 49
Indirect NR NR
PASE Past-week
Direct & Indirect 0.32 2477
Direct 0.38 1242
Indirect 0.33 1671
PA Recall Past-week
Direct & Indirect 0.30 178
Direct 0.30 178
Indirect NR NR
SPAQ Past-week
Direct & Indirect 0.13 30
Direct 0.13 30
Indirect NR NR
Stanford Past-week
Table 7The weighted mean of the correlation coefficients (r-value) for reliability testing and validity of Past-week and
Usual-week PAQs(Continued)
Direct & Indirect 0.24 271
Direct 0.23 271
Indirect 0.26 147
TPAQ Past-week
Direct & Indirect 0.72 46
Direct 0.72 46
Indirect NR NR
Average for Usual-week PAQs Direct & Indirect (r= 0.20) Direct (r= 0.20) Indirect (r= 0.13)
Direct & Indirect (n= 5592) Direct (n= 5269) Indirect (n= 671)
Average for Past-week PAQs Direct & Indirect (r= 0.29) Direct (r= 0.33) Indirect (r= 0.24)
Direct & Indirect (n= 4959) Direct (n= 2843) Indirect (n= 2882)
Past-week and Usual-week PAQs
Direct (r= 0.25) Indirect (r= 0.22)
Direct (n= 8112) Indirect (n= 3553)
Direct–direct measures comparisons of physical activity measures (e.g., physical activity level between PAQ and other PAQs, diaries or objective measures) for convergent validity
Indirect - Indirect comparisons of physical activity measures (e.g., physical activity level between PAQ and physical fitness, given the assumption that individuals with greater level of physical activity would have a greater level of physical fitness) for construct validity
NR - did not report r-values I
calculated intraclass correlation coefficient fortest-retest reliability K
calculated kappa fortest-retest reliability
EPAQ2EPIC Physical Activity Questionnaire 2,EPIC PAQEPIC Physical Activity Questionnaire,IPEC-WAIncidental and Planned Exercise Questionnaire for the Usual-week,IPEC-WIncidental and Planned Exercise Questionnaire for the Past-week,NHS IINurse’s Health Study,SDANASeven-day Adventists and non-Adventists,YPASYale Physical Activity Survey,AASActive Australia Survey,
CAQ-PAICollege Alumnus Questionnaire Physical Activity Index,GPPAQ
General practice physical activity questionnaire,IPAQ-LFInternational Physical Activity Questionnaire–Long Form,IPAQ-SFInternational Physical Activity Questionnaire–Short Form,OSPAQOccupational Sitting & Physical Activity Questionnaire,OSWEQOnline Self-reported Walking and Exercise Questionnaire,PASEPhysical Activity Scale for the Elderly,SPAQ2Scottish Physical Activity Questionnaire,PARStanford 7-day Physical Activity Recall,
[image:19.595.304.540.122.337.2]Table
8
Quality
of
psychometric
properties
based
on
the
criteria
by
Terwee
et
al.
(2007)
and
Schellingerhout
et
al.
(2011)
Instrument
St
udy
Measurement
propert
ies
of
que
stionnaires
Reliability
Conte
nt
validity
Construct
Validity
Internal
Con
sistenc
y
Re
liabilit
y
testing
Measureme
nt
Error
Structural
vali
dity
Hypothe
sis
te
sting
EPAQ2
Usual
7-days
Es
pana-Ro
mero,
Gol
ubic
[
48
]
NR
NR
NR
NR
NR
-(Di
rect)
?
(Discriminan
t)
Gol
ubic
,
Marti
n
[
49
]
NR
NR
NR
NR
NR
-(Di
rect)
+
(Discrimin
ant)
War
eham
,
Jake
s
[
29
]
NR
±
NR
?
NR
-(Di
rect)
-(In
direct)
EPIC
PAQ
Usual
7-days
Cus
t,
Smith
[
27
]
NR
-?
NR
NR
-(Di
rect)
+
(Discrimin
ant)
Cus
t,
Armstro
ng
[
41
]
NR
±
NR
NR
NR
-(Di
rect)
War
eham
,
Jake
s
[
50
]
NR
-NR
-NR
?
(Direct)
?
(Indirect)
+
(Discrimin
ant)
IPEQ-W
A
Usua
l
7-days
D
elbaere,
Haue
r
[
11
]
?
±
N
R
N
R
+
+
(Direct)
NHS
II
Usual
7-days
Wol
f,
Hunter
[
51
]
NR
-NR
NR
NR
+
(Direct)
?
(Discriminan
t)
SDA
NA
Usual
7-days
Si
ngh,
Tons
tad
[
33
]
?
±
NR
+
NR
-(In
direct)
+
(Discrimin
ant)
Si
ngh,
Fra
ser
[
52
]
NR
±
NR
NR
NR
±
(Direct)
-(In
direct)
?
(Discriminan
t)
Stanf
ord
Usu
al
Ac
tivity
Que
stionnaire
Usual
7-days
Jac
obs,
Ainswort
h
[
53
]
NR
-NR
NR
NR
-(Di
rect)
-(In
direct)
YPAS
Usua
l
7
days
Re
snicow,
McCarty
[
54
]
NR
NR
NR
NR
NR
-(In
direct)
AAS
Past
7-days
Brow
n,
Burton
[
55
]
NR
-NR
NR
NR
-(Di
rect)
?
(Discriminan
t)
CAQ-P
AI
Past
7-days
Ains
wort
h,
Be
rry
[
56
]
NR
NR
NR
NR
NR
?
(Direct)
Ains
wort
h,
Leon
[
57
]
NR
-NR
NR
NR
±
(Direct)
±
(Indir
ect)
Alb
anes,
Conway
[
58
]
?
NR
NR
NR
NR
-(Di
rect)
Bas
sett,
Cur
eton
[
59
]
NR
NR
NR
NR
NR
-(Di
rect)
Jac
obs,
Ainswort
h
[
53
]
NR
-NR
NR
NR
-(Di
rect)
-(In
[image:20.595.71.479.80.732.2]Table
8
Quality
of
psychometric
properties
based
on
the
criteria
by
Terwee
et
al.
(2007)
and
Schellingerhout
et
al.
(2011)
(Co
ntinued)
Re
snicow,
McCarty
[
54
]
NR
NR
NR
NR
NR
-(In
direct)
St
rath,
Bas
sett
[
60
]
NR
NR
NR
NR
NR
-(Di
rect)
+
(Discrimin
ant)
Was
hburn,
Gol
dfield
[
61
]
NR
NR
NR
NR
NR
-(In
direct)
Checkli
st
Quest
ionnaire
Past
7-days
Mas
se,
Fu
lton
[
38
]
NR
NR
NR
+
NR
-(Di
rect)
GPPA
Q
Past
7-days
Ah
mad,
H
arris
[
62
]
NR
-NR
NR
NR
?
IPAQ-LF
Past
7-days
Mc
Keon,
Slevi
n
[
63
]
NR
NR
NR
NR
NR
?
(Direct)
IPAQ-S
F
Past
7-days
K
aleth,
Ang
[
64
]
NR
-NR
NR
NR
-(Di
rect)
Ti
erney
,
Frase
r
[
65
]
NR
NR
NR
NR
NR
-(Di
rect)
War
ner,
Wol
in
[
66
]
NR
NR
NR
NR
NR
-(Di
rect)
IPAQ-S
F
(recall
conf
idenc
e)
Past
7-days
Cus
t,
Armstro
ng
[
41
]
NR
-NR
NR
NR
-(Di
rect)
IPEQ-W
Pas
t
7-days
D
elbaere,
Haue
r
[
11
]
?
±
N
R
N
R
+
+
(Direct)
OSPAQ
Past
7-days
Ch
au,
Van
Der
Ploeg
[
42
]
NR
+
NR
NR
NR
-(Di
rect)
Janc
ey,
Tye
[
79
]
NR
+
NR
NR
NR
+
(Direct)
OSWE
Q
Past
7-days
Tayl
or,
Lawton
[
43
]
NR
±
NR
+
NR
±
(Direct)
PASE
Pas
t
7-days
All
ison,
Kelle
r
[
67
]
+
-NR
+
NR
NR
D
ePew,
Garofoli
[
28
]N
R
-?
N
R
N
R
N
R
Ew
ald,
McEvoy
[
68
]
NR
NR
NR
NR
NR
-(Di
rect)
Gar
field,
Can
avan
[
69
]
N
R
N
R
N
R
N
R
N
R
+
(Direct)
Gra
nge
r,
Parry
[
70
]
N
R
N
R
N
R
N
R
N
R
+
(Direct)
H
arada,
Chiu
[
71
]
N
R
N
R
N
R
N
R
N
R
+
(Direct)
+
(Indir
ect)
Mar
tin,
Rejeski
[
72
]
NR
NR
NR
NR
NR
-(In
direct)
Was
hburn
and
Fi
cker
[
73
]
NR
NR
NR
NR
NR
-(Di
rect)
Was
hburn,
McAu
ley
[
74
]
NR
NR
NR
NR
NR
-(In
direct)
Was
hburn,
Smit
h
[
44
]
-NR
+
NR
-(In
direct)
Za
lewski,
Smith
[
75
]
NR
NR
NR
NR
NR
-(Di
rect)
-(In
direct)
PA
Reca
ll
Instrument
Ti
mperio
,
Salmon
[
45
]
NR
-NR
NR
NR
-(Di
rect)
SPAQ2
Past
7-d
ays
Lo
wther,
Mu
trie
[
46
]
NR
+
NR
NR
NR
+
(Direct)
+
(Discrimin
Table
8
Quality
of
psychometric
properties
based
on
the
criteria
by
Terwee
et
al.
(2007)
and
Schellingerhout
et
al.
(2011)
(Co
ntinued)
Stanf
ord
7-d
ay
Physi
cal
Ac
tivity
Re
call
(PAR
)
Past
7-days
Ains
wort
h,
Jaco
bs
[
76
]
NR
-NR
NR
NR
-(Di
rect)
Ains
wort
h,
Richardson
[
77
]
NR
NR
NR
NR
NR
-(Di
rect)
D
ishman
and
Steinh
ardt
[
78
]
+
-N
R
N
R
N
R
+
(Direct)
-(In
direct)
Jac
obs,
Ainswort
h
[
53
]
NR
-NR
NR
NR
-(Di
rect)
-(In
direct)
TPAQ
Past
7-days
Adam
s,
Goad
[
47
]
NR
±
NR
+
NR
±
(Direct)
EPAQ2
EPIC
Physical
Activity
Questionnaire
2,
EPIC
PAQ
EPIC
Physical
Activity
Questionnaire,
IPEC-WA
Incidental
and
Planned
Exercise
Questionnaire
for
the
Usual-week,
IPEC-W
Incidental
and
Planned
Exercise
Questionnaire
for
the
Past-week,
NHS
II
Nurse
’
s
Health
Study,
SDANA
Seven-day
Adventists
and
non-Adventists,
YPAS
Yale
Physical
Activity
Survey,
AAS
Active
Australia
Survey,
CAQ-PAI
College
Alumnus
Questionnaire
Physical
Activity
Index,
GPPAQ
General
practice
physical
activity
questionnaire,
IPAQ-LF
International
Physical
Activity
Questionnaire
–
Long
Form,
IPAQ-SF
International
Physical
Activity
Questionnaire
–
Short
Form,
OSPAQ
Occupational
Sitting
&
Physical
Activity
Questionnaire,
OSWEQ
Online
Self-reported
Walking
and
Exercise
Questionnaire
,
PASE
Physical
Activity
Scale
for
the
Elderly,
SPAQ2
Scottish
Physical
Activity
Questionnaire,
PAR
Stanford
7-day
Physical
Activity
Recall,
TPAQ
Transport
Physical
Activity
criteria set out by [17]. Table 9 summarises the overall rating of psychometric properties for each PAQ using the levels of evidence by [18]. Overall, the majority of psychometric properties showed “moderate negative” to “strong negative” ratings for both Usual-week and Past-week PAQs. Of these, IPEQ-WA, SDANA, IPAQ-LF, IPEQ-W, OSPAQ, OSWEQ, SPAQ2 and TPAQ were PAQs that did not include psychometric properties with “negative”ratings. Both IPEQ-WA and IPEQ-W demon-strated “indeterminate” and “conflicting” ratings for
in-ternal consistency and reliability testing, respectively,
with “moderate positive” ratings for structural validity
and hypothesis testing. For SPAQ2, “limited positive” to
“moderate positive” ratings were reported for reliability
testing and hypothesis testing, respectively. When
com-pared between different PAQ recall methods, Past-week PAQs had a greater proportion of “limited positive” to “strong positive” ratings (10 out of 36 ratings = 27.8%) than Usual-week PAQs (4 out of 20 ratings = 20.0%). However, Past-week PAQs had a greater proportion of “moderate negative” to “strong negative”ratings (14 out 36 ratings = 38.9%) than Usual-week PAQs (7 out of 20 ratings = 35.0%). Only few studies reported on internal
consistency, measurement error and structural validity.
When compared between psychometric properties irre-spective of PAQ recall methods,content validityhad the greatest proportion of PAQs with “limited positive” to “strong positive” ratings (5 out of 7 ratings = 71.4%), whereas reliability testing had the greatest proportion of PAQs with“moderate negative”to “strong negative” rat-ings (10 out of 18 ratrat-ings = 55.6%). Overall, only few psy-chometric properties were reported with a majority of ratings having received‘negative’ratings.
Discussion
The current review examined the methodological quality of a large number of studies examining 7-day PAQs and the psychometric quality of included PAQs. We identi-fied 21 PAQs, of which seven were Past-week PAQs and 14 were Usual-week PAQs, which led to the retrieval of 44 corresponding original articles reporting on the psy-chometric properties of the included PAQs. According to the COSMIN taxonomy, reliability and hypothesis
testing were the most commonly reported psychometric
properties, while internal consistency, measurement
error, content validity and structural validity were
sel-dom examined. The methodological quality of the stud-ies for PAQs was good to excellent although the overall quality of a majority of psychometric properties of PAQs showed “negative” ratings. According to the magnitude of the weighted mean r-values, Past-week PAQs ap-peared to have better convergent validity compared to Usual-week PAQs, although the overall psychometric qualities of both Past-week PAQs and Usual-week PAQs
were weak. Despite weak overall psychometric qualities, IPEQ-WA had the greatest number of “moderate posi-tive” ratings with no “negative” ratings for Usual-week PAQ. For the Past-week PAQs, IPEQ-W had the greatest number of“moderate positive”ratings with no“negative” ratings and SPAQ2 had “limited positive” to “moderate positive” ratings with no“negative” ratings. The overall finding, however, is that a substantial number of psycho-metric properties were either not reported or showed “moderate negative” to “strong negative” ratings irre-spective of PAQ type.
Quality of studies using the COSMIN taxonomy
According to the COSMIN taxonomy, the reliability do-main consists of internal consistency, reliability testing
and measurement error [15]. Of these psychometric
properties, reliability testing was reported in a majority of PAQs, in the form of test-retest reliability, with the exception of three PAQs (YPAS, Checklist Questionnaire and IPAQ-LF). Internal consistency was only detailed in six PAQs (IPEQ-WA, SDANA, CAQ-PAI, IPEQ-W, PASE and PAR). Most of these PAQs showed moderate to excellent methodological quality for reliability testing, which are in line with previously published systematic reviews that have examined the methodological quality of self-reported PAQs in the adults [19] and elderly [21]. However, our current findings are in contrast to those reported by [16], where half of their ratings for the methodological quality oftest-retest reliabilitywere‘fair’. These discrepancies could be due to the current review incorporating a modified COSMIN criteria by [26] which accounts for subtle differences in the psychomet-ric quality of each study. Given that only few studies re-ported on internal consistencywith 4 out of 7 COSMIN ratings scored as“indeterminate”, determining the qual-ity of this psychometric property for Usual-week and Past-week PAQs is at present not possible in the current review.
Undoubtedly, the greatest deficiency for the reliability domain was the lack of examination of measurement
error, which was only reported in two PAQs (EPIC PAQ
and PASE) based on two studies[29, 30]. Not knowing
the measurement error of a PAQ means that we cannot
say with confidence that the reported PA level of a per-son is indeed accurate (i.e., a true reflection of the con-struct being measured). A framework to improve accuracy of PAQs has been published [10], although fur-ther studies are needed to determine the measurement
errors of popular PAQs to provide practitioners and
re-searchers with robust measures.

![Table 3 Modified criteria of psychometric quality rating basedon Terwee, Bot [15] and Cordier, Chen [26]](https://thumb-us.123doks.com/thumbv2/123dok_us/146899.24043/5.595.303.536.106.732/table-modified-criteria-psychometric-quality-basedon-terwee-cordier.webp)
![Table 3 Modified criteria of psychometric quality rating basedon Terwee, Bot [15] and Cordier, Chen [26] (Continued)](https://thumb-us.123doks.com/thumbv2/123dok_us/146899.24043/6.595.55.290.112.517/modified-criteria-psychometric-quality-basedon-terwee-cordier-continued.webp)