According to Hepatitis C Virus (HCV) Infection Stage,
Interleukin-7 Plus 4-1BB Triggering Alone or Combined with
PD-1 Blockade Increases TRAF1
low
HCV-Specific CD8
ⴙ
Cell
Reactivity
Elia Moreno-Cubero,a,bDolores Subirá,cEduardo Sanz-de-Villalobos,aTrinidad Parra-Cid,dAntonio Madejón,e
Joaquín Miquel,aAntonio Olveira,eAlejandro González-Praetorius,fJavier García-Samaniego,e Juan-Ramón Larrubiaa,g
aTranslational Hepatology Unit, Section of Digestive Diseases, Hospital Universitario de Guadalajara,
Guadalajara, Spain
bDepartment of Biology of Systems, University of Alcalá, Madrid, Spain cService of Hematology, Hospital Universitario de Guadalajara, Guadalajara, Spain dService of Biochemistry, Hospital Universitario de Guadalajara, Guadalajara, Spain eLiver Unit, Hospital Universitario La Paz, CIBERehd, IdiPaz, Madrid, Spain fService of Microbiology, Hospital Universitario de Guadalajara, Guadalajara, Spain gDepartment of Medicine and Medical Specialties, University of Alcalá, Madrid, Spain
ABSTRACT Hepatitis C virus (HCV)-specific CD8⫹T cells suffer a progressive
exhaus-tion during persistent infecexhaus-tion (PI) with HCV. This process could involve the positive immune checkpoint 4-1BB/4-1BBL through the loss of its signal transducer, TRAF1. To address this issue, peripheral HCV-specific CD8⫹ T cells (pentamer-positive
[pen-tamer⫹]/CD8⫹T cells) from patients with PI and resolved infection (RI) after treat-ment were studied. The duration of HCV infection and the liver fibrosis progression rate inversely correlated with the likelihood of detection of peripheral pentamer⫹/ CD8⫹cells. In PI, pentamer⫹/CD8⫹cells had impaired antigen-specific reactivity that
worsened when these cells were not detectable ex vivo. Short/midduration PI was
characterized by detectable peripheral PD-1⫹CD127lowTRAF1lowcells. After
trigger-ing of T cell receptors (TCR), the TRAF1 level positively correlated with the levels of CD127, Mcl-1, and CD107a expression and proliferation intensity but negatively with PD-1 expression, linking TRAF1lowto exhaustion.In vitrotreatment with interleukin-7
(IL-7) upregulated TRAF1 expression, while treatment with transforming growth factor-1 (TGF-1) did the opposite, suggesting that the IL-7/TGF-1 balance, be-sides TCR stimulation, could be involved in TRAF1 regulation. In fact, the serum TGF-1 concentration was higher in patients with PI than in patients with RI, and it negatively correlated with TRAF1 expression. In line with IL-7 increasing the level of TRAF1 expression, IL-7 plus 4-1BBL treatmentin vitroenhanced T cell reactivity in patients with short/midduration infection. However, in patients with long-lasting PI, anti-PD-L1, in addition to the combination of IL-7 and 4-1BBL, was necessary to rees-tablish T cell proliferation in individuals with slowly progressing liver fibrosis (slow fi-brosers) but had no effect in rapid fibrosers. In conclusion, a peripheral hyporeactive TRAF1low HCV-specific CD8⫹ T cell response, restorable by IL-7 plus 4-1BBL
treat-ment, characterizes short/midduration PI. In long-lasting disease, HCV-specific CD8⫹ T cells are rarely detectableex vivo, but treatment with IL-7, 4-1BBL, and anti-PD-L1 recovers their reactivityin vitroin slow fibrosers.
IMPORTANCE Hepatitis C virus (HCV) infects 71 million people worldwide.
Two-thirds develop a chronic disease that can lead to cirrhosis and hepatocellular carci-noma. Direct-acting antivirals clear the infection, but there are still patients who re-lapse. In these cases, additional immunotherapy could play a vital role. A successful
Received28 August 2017Accepted23 October 2017
Accepted manuscript posted online1 November 2017
CitationMoreno-Cubero E, Subirá D, Sanz-de-Villalobos E, Parra-Cid T, Madejón A, Miquel J, Olveira A, González-Praetorius A, García-Samaniego J, Larrubia J-R. 2018. According to hepatitis C virus (HCV) infection stage, interleukin-7 plus 4-1BB triggering alone or combined with PD-1 blockade increases TRAF1lowHCV-specific CD8+cell reactivity. J
Virol 92:e01443-17.https://doi.org/10.1128/JVI .01443-17.
EditorMichael S. Diamond, Washington University School of Medicine
Copyright© 2018 American Society for Microbiology.All Rights Reserved. Address correspondence to Juan-Ramón Larrubia, [email protected].
crossm
on November 6, 2019 by guest
http://jvi.asm.org/
anti-HCV immune response depends on virus-specific CD8⫹ T cells. During chronic
infection, these cells are functionally impaired, which could be due to the failure of costimulation. This study describes exhausted specific T cells, characterized by low levels of expression of the signal transducer TRAF1 of the positive costimulatory pathway 4-1BB/4-1BBL. IL-7 upregulated TRAF1 expression and improved T cell reac-tivity in patients with short/midduration disease, while in patients with long-lasting infection, it was also necessary to block the negative PD-1/PD-L1 checkpoint. When the results are taken together, this work supports novel ways of restoring the
spe-cific CD8⫹ T cell response, shedding light on the importance of TRAF1 signaling.
This could be a promising target for future immunotherapy.
KEYWORDS 4-1BB, CD8 T cell response, IL-7, PD-1, T cell exhaustion, TGF-1, TRAF1,
hepatitis C virus, immune checkpoint, immunotherapy
H
epatitis C virus (HCV)-specific CD8⫹T cells are vital for the clearance of HCV (1) and might play a role in the avoidance of relapses because of the temporary presence of trace levels of occult virus after the treatment-induced control of HCV infection (2–7). Nevertheless, during persistent infection (PI) with HCV, this response either is exhausted or is even deleted (8–11). Several strategies have focused on the modulation of immune checkpoints to restorein vitroT cell reactivity and have had variable success (8, 12, 13). The progenitor T cell pool could be a sound candidate as a subset responsive to immunotherapeutic approaches (14, 15). However, it has been shown that this popu-lation can develop a gradient of functional impairment according to the infection stage (16, 17). During PI, the presence of peripheral HCV-specific CD8⫹T cells at a frequency below the detection threshold of conventional methods (18) might suggest deletion of the terminal effector memory population and an intense impairment of the progenitor subset, while the presence of detectable cells could be linked to less severe exhaustion (9, 15, 16). Therefore, an immunomodulatory strategy to restore T cell numbers could yield different results, according to whether the detection of peripheral HCV-specific T cellsex vivois possible or not.The triggering of the immune checkpoint tumor necrosis factor (TNF) receptor superfamily member 9 (4-1BB)/4-1BB ligand (4-1BBL) (19) to improve the HCV-specific CD8⫹T cell response has already been tested, but unfortunately, it was shown to have weak efficacy (13). This failure could be due to the impairment of signal transduction. TNF receptor-associated factor 1 (TRAF1) is the key transducer of this pathway (20). TRAF1 levels are low in resting cells but are upregulated via NF-B after T cell activation (21, 22). TRAF1 loss is observed during some chronic viral infections, such as those with murine lymphocytic choriomeningitis virus (LCMV) (23). Of note, besides triggering T cell receptors (TCR), interleukin-7 (IL-7) upregulates TRAF1 expression during LCMV infection, while triggering of transforming growth factor-1 (TGF-1) does the opposite
(23). Several mechanisms could be involved in inducing TGF-1 secretion during
chronic HCV infection (24–26), and consequently, the induction of TGF-1 secretion could affect TRAF1 expression. Thus, IL-7 could potentially be utilized (27) to restore TRAF1 levels by counteracting the effect of TGF-1 in those exhausted T cells not able to upregulate TRAF1 after TCR stimulation. The role of IL-7 in TRAF1 expression in HCV-specific CD8⫹T cells during PI has not been studied before. Our work shows that during short/midduration infection, exhausted TRAF1low-expressing HCV-specific CD8 T
cells are generally detectable in the peripheral compartment and are amenable to IL-7 plus 4-1BB triggering. On the contrary, during long-lasting disease, these cells are
commonly present at levels below the direct detection threshold ex vivo and the
additional blockade of the programmed cell death protein 1 (PD-1) checkpoint is necessary to restore their reactivity. These findings provide novel insight into the role of TRAF1 in the functional impairment of HCV-specific CD8⫹T cells, which could open
new opportunities for those patients not responding to direct-acting antivirals (DAA) (28) as well as patients with other chronic viral infections and cancer.
on November 6, 2019 by guest
http://jvi.asm.org/
RESULTS
Ex vivopentamer-positive (pentamerⴙ)/CD8ⴙcell detection correlates with the duration of HCV infection and the liver fibrosis progression rate.The groups with RI and PI displayed comparable demographic and clinical features (Table 1). In both groups, peripheral blood lymphocytes (PBL) were tested for the presence of CD8⫹T
cells specific for two human leukocyte antigen (HLA)-A2-restricted HCV genotype 1 NS3 epitopes. Sequencing of the epitope consisting of HCV NS3 from positions 1073 to 1081 (NS31073–1081; also referred to here as the NS31073epitope) and the epitope consisting
of HCV NS3 from positions 1406 to 1415 (NS31406 –1415; also referred to here as the
NS31406epitope) could be performed for 66% of the patients with PI. Remarkably, the
sequences of 100% of the NS31073epitopes and 70% of the NS31406epitopes tested
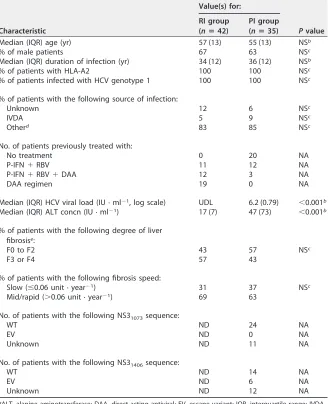
[image:3.585.43.371.84.488.2]were similar to those of the peptides loaded into the pentamers (Table 2). As HCV isolates from patients with RI were not available for sequencing, due to a lack of pretreatment serum samples, in order not to bias the analysis, all samples were TABLE 1Features of the patients enrolled in the studya
Characteristic
Value(s) for:
Pvalue RI group
(nⴝ42)
PI group (nⴝ35)
Median (IQR) age (yr) 57 (13) 55 (13) NSb
% of male patients 67 63 NSc
Median (IQR) duration of infection (yr) 34 (12) 36 (12) NSb
% of patients with HLA-A2 100 100 NSc
% of patients infected with HCV genotype 1 100 100 NSc
% of patients with the following source of infection:
Unknown 12 6 NSc
IVDA 5 9 NSc
Otherd 83 85 NSc
No. of patients previously treated with:
No treatment 0 20 NA
P-IFN⫹RBV 11 12 NA
P-IFN⫹RBV⫹DAA 12 3 NA
DAA regimen 19 0 NA
Median (IQR) HCV viral load (IU · ml⫺1, log scale) UDL 6.2 (0.79) ⬍0.001b
Median (IQR) ALT concn (IU · ml⫺1) 17 (7) 47 (73) ⬍0.001b
% of patients with the following degree of liver fibrosise:
F0 to F2 43 57 NSc
F3 or F4 57 43
% of patients with the following fibrosis speed:
Slow (ⱕ0.06 unit · year⫺1) 31 37 NSc
Mid/rapid (⬎0.06 unit · year⫺1) 69 63
No. of patients with the following NS31073sequence:
WT ND 24 NA
EV ND 0 NA
Unknown ND 11 NA
No. of patients with the following NS31406sequence:
WT ND 14 NA
EV ND 6 NA
Unknown ND 12 NA
aALT, alanine aminotransferase; DAA, direct-acting antiviral; EV, escape variant; IQR, interquartile range; IVDA,
intravenous drug abuse; NA, not applicable; NS, nonsignificant; ND, not done; P-IFN, pegylated alpha2 interferon; PI, persistent infection; RBV, ribavirin; RI, resolved infection; UDL, under the detection limit; WT, wild type.
bDetermined by the Mann-Whitney U test. cDetermined by the chi-square test.
dParenteral nonintravenous drug abuse or sexual transmission.
eThe degree of liver fibrosis was estimated by transient elastography or liver biopsy.
on November 6, 2019 by guest
http://jvi.asm.org/
TABLE 2 NS3 epitope sequence in selected patients with persistent genotype 1 infection and its correlation with ex vivo detection and the reactivity of HCV-specific CD8 ⫹ cells according to liver fibrosis and disease duration a Duration of infection and degree of liver fibrosis ID Degree of liver fibrosis Duration (yr) Genotype Results for HCV NS3 1073 peptide Results for HCV NS3 1406 peptide NS3 1073 sequence compared to that in Pent (CINGVCWTV) b Ex vivo detection of cells c Ag-specific proliferation with: NS3 1406 sequence compared to that in Pent (KLVALGINAV) b Ex vivo detection of cells c Ag-specific proliferation with: No treatment 4-1BBL ⴙ IL-7 treatment No treatment 4-1BBL ⴙ IL-7 treatment ⱕ 40 yr F0 to F2 272P F2 40 1a --S---0.02 0.6 0.17 ---V---0.04 8.6 3.7 273P F1 32 1a ND ---Neg Neg Neg 316P F1 35 1a ---0.02 Neg 0.29 ---Neg Neg 0.12 376P F1 40 1b ---0.02 0.08 ND ND 635P F1 30 1a ---0.02 ND ND ----M-V---0.03 Neg 5.05 684P F2 28 1a ---Neg Neg Neg ---Neg Neg Neg 1090P F2 21 1b ---Neg Neg Neg ND 1208P F2 35 1a ---Neg 4.6 0.45 ---Neg Neg 0.48 1245P F1 34 1a ---0.05 0.6 1.8 ---Neg 0.1 0.2 1270P F2 28 1a ---Neg Neg Neg ---V---Neg Neg Neg F3 or F4 442P F3 28 1a ---0.02 1.8 1.1 ---G--L---Neg 0.7 0.3 516P F3 33 1a ---0.04 2.3 3.35 ---G--L---Neg Neg Neg 1024P F4 40 1a ---Neg 0.32 ND ---V---Neg Neg 0.78 1045P F4 34 1a ---Neg --AG--M---Neg ND ND 1058P F3 30 1a ---0.04 2.89 1.14 ----M-V---0.14 6.5 4.4 1094P F3 32 1b -V---Neg Neg 0.17 ND 1165P F4 28 1a ---0.02 Neg ND ---V---0.03 Neg ND No. positive/total no. (%) d 9/16 (56%) 8/14 (57%) 8/11 (73%) 2/9 (22%) 2/9 (22%) 5/8 (63%) ⬎ 40 yr F0 to F2 450P F2 41 1b ---Neg Neg Neg ND 1064P F1 42 1a ---Neg Neg ND ---G---Neg 0.18 ND F3 or F4 33P F3 41 1a -V---Neg Neg Neg ---Neg Neg Neg 380P F4 49 1a ---Neg Neg ND ---Neg Neg ND 969P F3 41 1a ---Neg Neg Neg ---Neg Neg Neg 727P F3 63 1a ---Neg Neg Neg ---V---Neg Neg Neg 1200P F3 48 1a ---Neg Neg Neg ---V---Neg Neg 1.3 No. positive/total no. (%) d 0/7 (0%) 0/7 (0%) 0/5 (0%) 0/5 (0%) 0/5 (0%) 1/4 (25%) aAg-specific proliferation (%), proliferation after 10 days of specific in vitro challenge in the presence of 4-1BBL plus IL-7 treatment (4-1BBL ⫹ IL-7) and in the absence of 4-1BBL plus IL-7 treatment (no treatment); Duration, duration of HCV infection; ID, patient identification; ND, not done; Neg, negative; Pent, HLA-I/pentameric peptide complexes. Shading indicates th e escape variants not cross-recognized by wild-type-primed T cells. The underlined data highlight the cases with increased proliferation after IL-7 plus 4-1BBL treatment. bA hyphen indicates that the sequences is the same as that in the pentamer. cThe frequency of NS3 pentamer-binding CD8 ⫹ cells out of the number of total CD8 ⫹ cells (in percent; data are highlighted in bold when the value is higher than the detection threshold). dThe data represent the number of patients with positive data/total number of patients (percent), but only those patients infected with HCV isolates w ith sequences similar to the peptide sequence loaded in the pentamers are included in the calculation.
on November 6, 2019 by guest
http://jvi.asm.org/
included for comparisons of patients with PI and RI and also when TRAF1 was the independent variable. In other tests carried out in the PI group, those cases with known HCV escape variants were excluded when TRAF1 was the dependent variable.
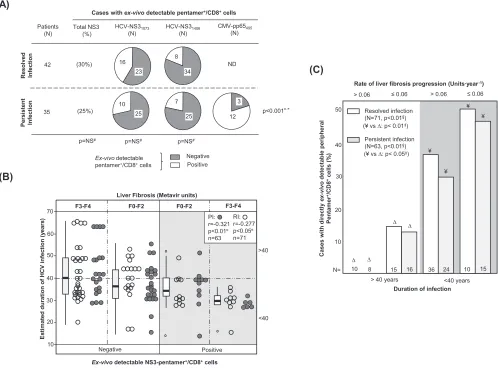
The frequency of cases with peripheral HCV-specific pentamer⫹/CD8⫹cells
detect-able ex vivowas similar between the RI and PI groups (Fig. 1A). In patients with PI,
cytomegalovirus (CMV) pentamer⫹/CD8⫹ cells were more frequently detected than
HCV pentamer⫹/CD8⫹cells (Fig. 1A), probably due to persistent antigen stimulation in
both pools without exhaustion of the CMV-specific T cell population. Interestingly, the predictive factors associated with the detection of peripheral HCV pentamer⫹/CD8⫹
cells were both the duration of HCV infection and the degree of liver fibrosis. A negative correlation between the HCV infection span and the detection of peripheral HCV pentamer⫹/CD8⫹cells was observed in both patients with PI and patients with RI (Fig.
1B; Table 2). In particular, among those patients who had been infected for less than 40
years, pentamer-binding CD8⫹ cells were observed in 52% of slow fibrosers (liver
fibrosis progression rate,ⱕ0.06 units · year⫺1) and 32% of mid-rapid-fibrosing cases
(liver fibrosis progression rate, ⬎0.06 units · year⫺1). In contrast, among cases with
more than 40 years of disease progression, these cells were detected in only 15% of slow fibrosers and 0% of mid-rapid fibrosers (Fig. 1C).
(A)
(30%)
(25%)
HCV-NS31406
(N) HCV-NS31073
(N) Patients
(N)
42
35
Positive Negative
Ex-vivodetectable
pentamer+/CD8+cells
R
eso
lv
ed
In
fe
c
tio
n
Cases with ex-vivodetectable pentamer+/CD8+cells
CMV-pp65495
(N)
p=NS#
23 16
34 8
25 7
ND
12 3
p=NS# p=NS#
P
e
rs
is
te
nt
In
fe
c
tio
n
Total NS3 (%)
25 10
(B)
(C)
)
sr
a
e
y(
n
oi
t
c
ef
ni
V
C
H
f
o
n
oi
t
ar
u
d
d
et
a
mi
t
s
E
70
60
50
40
30
20
10
F3-F4 F0-F2
F3-F4 F0-F2
Ex-vivodetectable NS3-pentamer+/CD8+cells Positive Negative
PI: r=-0.321 p<0.01¤
n=63 RI: r=-0.277 p<0.05¤
n=71 Liver Fibrosis (Metavir units)
<40 >40
> 0.06 ≤ 0.06
50
40
30
20
10
N=
<40 years > 40 years
Ca
s
e
s
w
it
h
d
ir
e
c
tl
y
ex
-v
iv
o
det
e
c
ta
b
le
per
iphera
l
Pe
n
ta
m
e
r
+/C
D
8
+
c
e
lls
(
%
)
Persistent infection (N=63, p<0.01§)
Resolved infection (N=71, p<0.01§)
10 8 15 16 36 24 10 15
Rate of liver fibrosis progression (Units·year-1)
> 0.06 ≤ 0.06
Duration of infection ¥
∆
¥
∆
¥
¥
∆
∆
(¥ vs ∆: p< 0.01‡)
(¥ vs ∆: p< 0.05‡)
p<0.001#,*
FIG 1Ex vivodetection of pentamer⫹/CD8⫹cells. (A) Frequency of patients with resolved and persistent infections and HCV NS3
1073-, HCV NS31406-, and CMV
pp65495-specific pentamer⫹/CD8⫹cells detectableex vivo. (B) Correlation between HCV infection length and detection of peripheral HCV pentamer⫹/CD8⫹cells
ex vivo, unbundled according to liver fibrosis stage. Box plots represent the distribution of the infection duration in each category when the data for patients with persistent infection and resolved infection after treatment are taken together. (C) Frequency of cases with peripheral pentamer⫹/CD8⫹cells detectable
ex vivoin relation to the duration of HCV infection (short/midduration,ⱕ40 years; long lasting,⬎40 years) and the rate of liver fibrosis progression. #, chi-square test;¤, Spearman correlation test;‡, Mann-Whitney U test; §, linear trend test; F, Metavir fibrosis stage; ND, not done; NS, nonsignificant; PI, persistent infection;
RI, resolved infection after treatment;*, comparison between HCV-pentamer⫹/CD8⫹and CMV-pentamer⫹/CD8⫹cells in PI.
on November 6, 2019 by guest
http://jvi.asm.org/
[image:5.585.46.544.74.442.2]Therefore, the duration of infection and the rate of liver fibrosis progression emerged as key factors determining the presence of detectable peripheral HCV-specific CD8⫹T cells by standard pentamer staining.
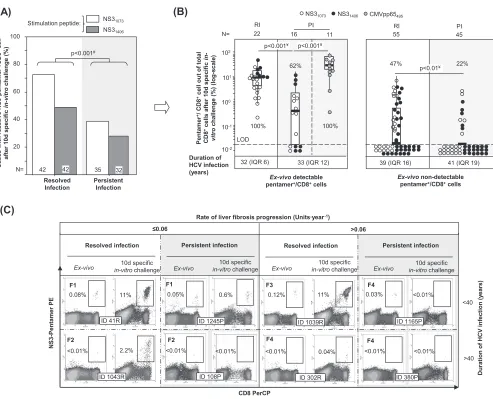
Impairment of HCV pentamerⴙ/CD8ⴙcell reactivity during PI.PBL from patients with RI and PI were challengedin vitrofor 10 days with HCV-specific peptides (NS31406
and NS31073) and in parallel with the CMV pp65 peptide from positions 495 to 504
(pp65495–504; also referred to here as the pp65495peptide) as an internal control for
patients with PI. In patients with RI, we observed an expansion of 72% of NS31073
-specific pentamer⫹/CD8⫹ cells and 49% of NS3
1406-specific pentamer⫹/CD8⫹ cells,
while only 39% of NS31073-specific pentamer⫹/CD8⫹cells and 27% of NS31406-specific
pentamer⫹/CD8⫹cells from the PI group expanded (Fig. 2A). In cases with detectable
cells ex vivo, 100% of NS31406-specific pentamer⫹/CD8⫹ cells and NS31073-specific
pentamer⫹/CD8⫹cells from patients with RI proliferated, whereas 77% of NS3 1073
-specific pentamer⫹/CD8⫹ cells and 43% of NS3
1406-specific pentamer⫹/CD8⫹ cells
(A)
(C)
3
S
N
e
vi
t
c
a
er
hti
w
s
e
s
a
C-r
e
m
at
n
e
p
+/C
D
8
+c
e
ll
ci
fi
c
e
p
s
d
0
1
r
et
f
a
in
-v
itr
o
)
%(
e
g
n
ell
a
h
c
100
80
60
40
20
N=
NS31406
NS31073
42 42 35 32
p<0.001#
Stimulation peptide:
Resolved Infection
Persistent Infection
(B)
CD8 PerCP
>0.06
<40 ≤0.06
NS
3
-Pe
n
ta
m
e
r PE
D
u
ra
ti
o
n
o
f
H
C
V
i
n
fect
io
n
(
y
ear
s
)
Resolved infection Persistent infection Resolved infection Persistent infection
0.08% 0.05% 0.12%
ID 1039R
0.03%
11% 11%
Ex-vivo in-vitro10d specificchallenge Ex-vivo
10d specific
in-vitrochallenge Ex-vivo
10d specific
in-vitrochallenge Ex-vivo
10d specific
in-vitrochallenge
ID 41R ID 1245P
0.6% <0.01%
<0.01% <0.01% <0.01% <0.01% <0.01%
ID 1043R ID 108P ID 302R
ID 1165P
Rate of liver fibrosis progression (Units·year-1)
0.04% 2.2%
>40 <0.01%
ID 380P F1
F2
F1
F2
F3
F4
F4
F4
102
101
100
10-1
10-2
p<0.001¥
Ex-vivodetectable
pentamer+/CD8+cells
Pe
n
ta
m
e
r
+/ CD8
+
c
e
ll o
u
t
o
f
to
ta
l
CD8
+c
e
lls
a
ft
e
r
1
0
d
s
p
e
c
if
ic
in
-vi
tr
o
c
h
a
ll
e
n
g
e
(%)
(l
o
g
-s
c
a
le
)
p<0.001¥
p<0.01¥
LOD
Duration of HCV infection (years)
32 (IQR 6) 33 (IQR 12) 39 (IQR 16) 41 (IQR 19)
PI RI
NS31073 NS31406 CMVpp65495
Ex-vivonon-detectable
pentamer+/CD8+cells
PI RI
100%
62% 47% 22%
100%
N= 22 16 11 55 45
FIG 2Antigen-specific reactivity of pentamer⫹/CD8⫹cells. (A) Global frequency of cases with pentamer⫹/CD8⫹cell expansion after 10 days (d) of specific
stimulation. (B) Intensity of pentamer⫹/CD8⫹cell proliferation in patients with resolved infection (RI) after treatment and persistent infection (PI), according to
the presence of pentamer⫹/CD8⫹cells detectableex vivo. The percentages of cases with positive expansion are indicated. The duration of infection (in years)
is described as the median plus interquartile range (IQR). Box plots summarize the distribution of pentamer⫹/CD8⫹cell frequency after expansion after pooling
of all samples tested in each category. (C) Representative dot plots showing pentamer⫹/CD8⫹cells in the upper right quadrant, according to the duration of
infection and the rate of liver fibrosis progression bothex vivoand after 10 days of specificin vitrochallenge. The Metavir score is displayed in bold in the upper left corner. The percentage of pentamer⫹/CD8⫹cells is in reference to the number of total CD8⫹cells. d, day; #, chi-square test; ¥, Mann-Whitney U test; ID,
patient identification; LOD, limit of detection.
on November 6, 2019 by guest
http://jvi.asm.org/
[image:6.585.46.539.67.466.2]from patients with PI proliferated (Fig. 2B and C). Moreover, after pooling of the data for both epitopes, the intensity of the proliferation, measured as the percentage of pentamer⫹/CD8⫹ cells out of the total CD8⫹ cells, was higher in patients with RI (11.4%) than in patients with PI (0.58%) (Fig. 2B and C). In those cases with no pentamer⫹/CD8⫹cells detectableex vivo, the proliferation was globally lower but still different between the two groups. When the results for the two NS3 epitopes were combined, 47% of pentamer⫹/CD8⫹cells proliferated for the RI group but only 22% proliferated for the PI group (Fig. 2B and C). The proliferation impairment in patients with PI was HCV specific, since 100% of paired CMV pp65495pentamer⫹/CD8⫹cells
from those patients expanded after specificin vitrochallenge (Fig. 2B).
These data showed a weakening of the peripheral HCV-specific CD8⫹cell reactivity during chronic infection that was deeper in patients with long-lasting infection, which could suggest the presence of different subsets of target cells according to the duration of HCV infection.
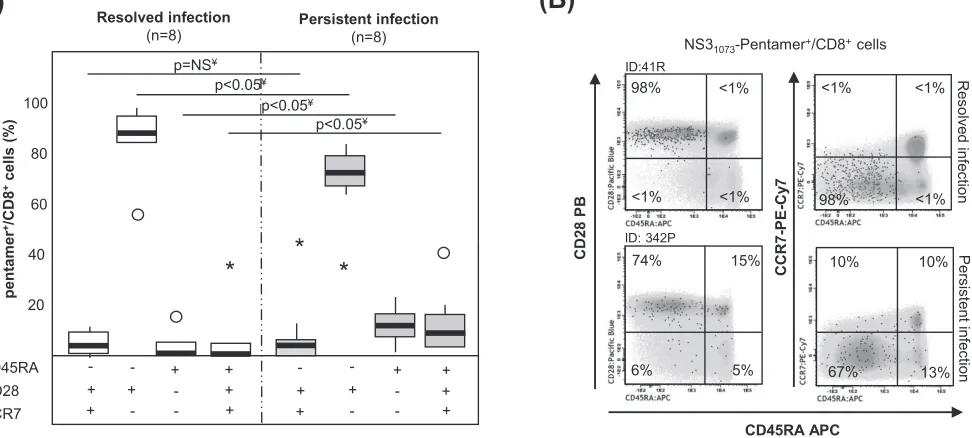
Different HCV pentamerⴙ/CD8ⴙcell differentiation between PI and RI.In 16
selected samples in which cells were detectableex vivo, we performed an extended
analysis of the memory phenotype to describe better the baseline features of specific T cells. In the RI group, ⬎85% of HCV pentamer⫹/CD8⫹cells displayed an effector
memory phenotype (CD45RA⫺, CD28⫹, CCR7⫺). In contrast, the patients with PI
showed a different memory phenotype distribution, defined by minor subsets of RA-positive (RA⫹) effector memory T cells (TEMRA; CD45RA⫹, CD28⫺, CCR7⫺) and
naive-like cells (CD45RA⫹, CD28⫹, CCR7⫹) and a major pool of CD28-expressing
effector memory cells (Fig. 3). The central memory subset (CD45RA⫺, CD28⫹, CCR7⫹)
was a minor population in both groups, probably because most of the patients with RI were studied shortly after the sustained viral response. Therefore, a heterogeneous population of peripheral HCV-specific CD8⫹T cells but with a significant subset of
CD28⫹cells, which have previously been considered the source for a positive response
to immune modulation, was detected in patients with PI (29).
TRAF1lowexpression in pentamerⴙ/CD8ⴙcells after triggering of TCR during PI.A pilot analysis of TRAF1 expression in HCV pentamer-binding CD8⫹cells performed directlyex vivoshowed a slightly higher nonsignificant TRAF1 level in patients with RI
(B)
98%
<1% <1%
<1% 98% <1%
<1% <1%
74% 15%
5%
6% 67% 13%
10% 10%
CD45RA APC
NS31073-Pentamer+/CD8+cells
CD2
8
P
B
CCR7
-P
E
-C
y
7
P
e
rs
is
te
n
t inf
e
c
tion
R
e
s
o
lv
e
d
inf
e
c
tion
ID:41R
ID: 342P
(A)
Resolved infection
(n=8)
Persistent infection
(n=8)
Di
re
c
tl
y
ex
-v
iv
o
m
e
m
o
ry
phenot
y
p
e
on
pent
a
m
e
r
+/C
D
8
+
c
e
lls
(
%
)
CD45RA
CD28
CCR7 20 40 60 80 100
p<0.05¥
p<0.05¥
+ + - + +
-- + + - +
+
- + - - +
-p<0.05¥
*
*
*
-+ +
-+ +
p=NS¥
FIG 3Memory phenotype of pentamer⫹/CD8⫹cellsex vivo. (A) Frequency of peripheral central memory effector memory, effector memory RA⫹(TEMRA), and
naive-like pentamer⫹/CD8⫹cells in cases with resolved and persistent infections.Œ, outlier value;*, extreme value. (B) Representative dot plots showing the memory phenotype of pentamer⫹/CD8⫹ cells. Black dots, pentamer⫹/CD8⫹ cells; gray scale, total CD8⫹ cells. The data represent the percentage of
pentamer⫹/CD8⫹cells in each quadrant in reference to the number of total pentamer⫹/CD8⫹cells. ID, patient identification; ¥, Mann-Whitney U test.
on November 6, 2019 by guest
http://jvi.asm.org/
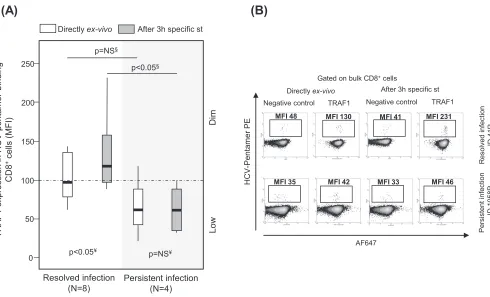
[image:7.585.57.543.80.299.2]than in patients with PI (Fig. 4). PBL were challenged in vitro for 3 h with specific peptides in order to increase the levels of protein expression in both groups, since TRAF1 is an NF-B-inducible protein with low levels of expression in resting cells (21, 22). TRAF1 was upregulated in patients with RI but not in patients with PI after 3 h of specific triggering of TCR (Fig. 4). According to this strategy and after pooling of the data for the two HCV epitopes tested, the induction of TRAF1 expression in HCV pentamer⫹/CD8⫹cells after 3 h of specific stimulation was higher in patients with RI
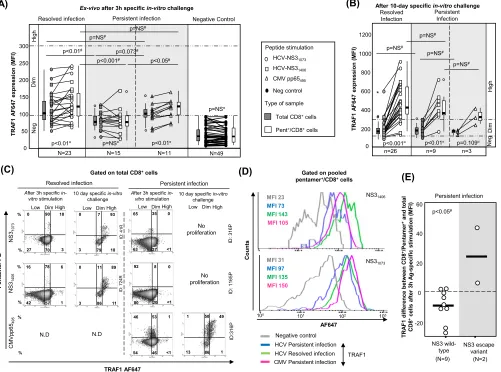
(mean fluorescence intensity [MFI], 120; interquartile range [IQR], 70) than in patients with PI (MFI, 80; IQR, 37) (Fig. 5A, C, and D). HCV pentamer⫹/CD8⫹cells from patients
with RI and CMV pentamer⫹/CD8⫹cells from patients with PI displayed similar levels
of TRAF1 induction, both of which were higher than those displayed by HCV penta-mer⫹/CD8⫹cells from patients with PI (Fig. 5A and C). The level of TRAF1 expression
by bulk CD8⫹cells from patients with RI and PI stimulated with HCV and CMV peptides,
respectively, was also higher than that by total CD8⫹ cells from patients with PI
stimulated with HCV peptides, although it was significantly lower than that by their paired pentamer⫹/CD8⫹cells (Fig. 5A and C). This fact could be due to CD8⫹ cell
bystander activation during the 3-h PBL-specific stimulation in those cultures with a nonexhausted specific CD8⫹T cell response to the cognate antigen (30).
According to the level of Alexa Fluor 647 (AF647) MFI expression in the negative controls, three different levels of TRAF1 expression were defined in pentamer⫹/CD8⫹
cells. TRAF1lowexpression was considered a value lower than the median for the
negative control (34 MFI) plus 1.5 the IQR value, which was 45 (TRAF1lowMFI,ⱕ100).
TRAF1dim expression was defined as a value lower than 3 times the upper limit of
TRAF1lowexpression (TRAF1dimMFI, 100 to 300). TRAF1highexpression was defined as
a value higher than the upper limit of TRAF1dim expression (TRAF1high MFI, ⬎300).
(B)
R
e
s
o
lv
e
d
inf
e
c
tion
ID
4
1
R
P
e
rs
is
te
n
t inf
e
c
tion
ID
1058P
Resolved infection (N=8)
Persistent infection (N=4)
V
C
H
ni
n
oi
s
s
er
p
x
e
1
F
A
R
T
-pe
nta
m
er
-bi
n
d
ing
CD8
+c
e
lls
(
M
FI)
Low
D
im
Directly ex-vivo
(A)
p<0.05¥
p=NS¥
p<0.05§
p=NS§
0 50 100 150 200 250
After 3h specific st
TRAF1
HCV
-Pe
n
ta
m
e
r PE
Directly ex-vivo After 3h specific st
Gated on bulk CD8+cells
AF647
Negative control
MFI 130 MFI 231
MFI 42 MFI 46
MFI 48 MFI 41
MFI 35 MFI 33
Negative control TRAF1
FIG 4Pilot analysis of TRAF1 expression in pentamer⫹/CD8⫹cells from patients with resolved and persistent infections performed directlyex vivoand after
3 h of specific stimulation. Box plots (A) and representative dot plots (B) from a preliminary analysis show the level of TRAF1 expression in HCV pentamer-binding CD8⫹cells determined directlyex vivoand after 3 h of specific stimulation in patients with a resolved infection after treatment and patients
with persistent infection. Negative control, T cell labeling with the secondary antibody only; MFI, mean fluorescence intensity; NS, nonsignificant; st, stimulation; §, Mann-Whitney U test; ¥, Wilcoxon test.
on November 6, 2019 by guest
http://jvi.asm.org/
[image:8.585.48.538.69.366.2]Using these values as cutoffs, in the RI group, 70% of tested samples showed TRAF1dim
expression after 3 h of specific stimulation, while only 20% of samples from the PI group showed TRAF1dimexpression (Fig. 5A) (P⫽0.003). Moreover, in 11 out of 15 patients
with PI in whom TRAF1 expression was analyzed, sequencing of the HCV epitope was performed. The difference in the level of TRAF1 induction between pentamer-binding and total CD8⫹cells after antigen-specific triggering was lower in samples from wild-type
HCV-infected cases than in the two samples harboring escape variants with the already described impaired cross-recognition by wild-type HCV-primed T cells (NS31406, L1410M)
(32) (Fig. 5E).
In 26 patients with RI and 9 patients with PI with a preserved pentamer⫹/CD8⫹cell
expansion ability, TRAF1 expression was tested after a 10-day specificin vitrochallenge. The level of TRAF1 expression was higher than that obtained directlyex vivoand higher than that by paired total CD8⫹cells (Fig. 5B and C). In fact, in 85% of the experiments
with positive pentamer⫹/CD8⫹cell expansion, a TRAF1high phenotype was reached
after specific proliferation.
(C) (D) (E) (B) TRAF1 AF647 E P r e m at n e P
Gated on total CD8+cells
NS
31406
NS
31073
After 3h specific
in-vitro stimulation
5 6 p p V M C 495
10 day specific in-vitro
challenge
Resolved infection Persistent infection
N.D
Low Dim High
N.D
Low Dim High Low Dim High
No proliferation
No proliferation
Low Dim High 10 day specific in-vitro
challenge ID : 41R ID : 316P ID: 7 2 4 R ID : 1 1 6 5 P ID :316P
0 90 10
27 70 3
0 7 93
3 79 18
65 35 0
63 <1
16 78 6
42 1
0 11 89
3 86 11
92 8 0
80 20 <1
46 53 1
54 46 <1
1 50 49
13 86 1
After 3h specific
in-vitro stimulation
37 57 % % % % % % (A) Peptide stimulation HCV-NS31073 HCV-NS31406
CMV pp65495
Total CD8+cells
Pent+/CD8+cells
Neg control
Type of sample
(N=2) (N=9) NS3 escape variant NS3 wild-type T R A F 1 d if fe re n ce bet w e e n C D 8 +/P en tam e r +a nd t o ta l CD8 +c e lls after 3 h A g -s p e c if ic s timu la tio n (M F I) 60 40 20 0 p<0.05# -20 Persistent infection Persistent Infection n=26 n=9 0 200 400 600 800 1000 1200 * T R A F 1 A F 6 4 7 exp ressi o n ( M F I)
p<0.001¤ p<0.01¤
p=NS# p=NS# Hi g h Di m Resolved Infection n=3 p=0.109¤ p=NS# p=NS# Ne g
After 10-day specificin-vitro challenge
Gated on pooled pentamer+/CD8+cells
AF647
CMV Persistent infection HCV Resolved infection Negative control
100 101 102 103
C
ounts
HCV Persistent infection
NS31406 TRAF1 NS31073 MFI 23 MFI 73 MFI 143 MFI 105 MFI 31 MFI 97 MFI 135 MFI 150 0 50 100 150 200 250 300 p<0.001# p<0.01# N=23 p<0.01¤ p=NS# p<0.05# p=0.073# p<0.01¤ N=11 Ne g H igh 7 4 6 F A 1 F A R T exp re ssi o n (M F I)
Resolved infection Persistent infection Negative Control
p=NS#
Di
m
Ex-vivoafter 3h specificin-vitrochallenge
N=15
p=NS¤
N=49
p=NS¤
FIG 5TRAF1 expression in pentamer⫹/CD8⫹cells. (A and B) MFI of TRAF1 in peripheral total CD8⫹and pentamer⫹/CD8⫹cells after 3 h (A) and after 10 days
(B) of specificin vitrochallenge, depending on the viral control. According to the MFI, TRAF1 expression was categorized as negative (Neg), dim, and high. The box plots summarize the distribution of the TRAF1 MFI in total and pentamer-binding CD8⫹cells in each category. (C) Representative dot plots showing TRAF1
expression in pentamer⫹/CD8⫹cells after 3 h and 10 days of specificin vitrochallenge in patients with resolved and persistent infections. The data represent
the percentage of cells in each area in reference to the number of total CD8⫹and pentamer⫹/CD8⫹cells. (D) Histograms of TRAF1 expression by pooled HCV
and CMV specific pentamer⫹/CD8⫹cells from all patients with resolved infection after treatment and persistent infection after 3 h of specific stimulation. (E)
Difference in TRAF1 expression according to the MFI between NS3 pentamer⫹/CD8⫹and total CD8⫹cells from patients with PI infected by wild-type HCV NS3
or an escape variant. Bold lines, median values of the distribution; #, Mann-Whitney U test;¤, Wilcoxon test.Œ, outlier value;*, extreme value; Ag, antigen; MFI,
mean fluorescence intensity; ND, not done; Negative Control, T cell labeling with the secondary antibody only; NS, nonsignificant; Pent, pentamer.
on November 6, 2019 by guest
http://jvi.asm.org/
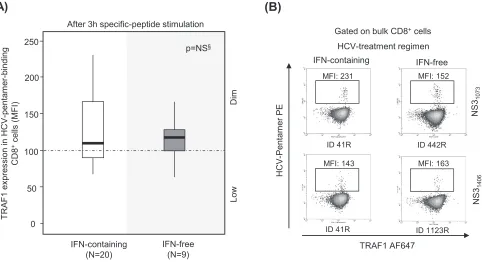
[image:9.585.47.548.75.447.2]In patients with RI, the induction of TRAF1 expression was comparable in patients treated with interferon (IFN)-free and IFN-containing regimens (Fig. 6). Two patients with PI could be longitudinally studied during anti-HCV treatment with DAA for 12 weeks. In these cases, TRAF1 expression was upregulated in pentamer⫹/CD8⫹cells at the end of treatment and 12 weeks after the cessation of treatment, and this correlated with an improvement in both the frequency of peripheral pentamer-binding CD8⫹cells ex vivoand the proliferation intensity of pentamer-binding CD8⫹cells. After treatment, these cells acquired a PD-1dimCD127dimphenotype, suggesting that they could belong
to the T cell factor 1 (TCF1)-positive (TCF1⫹) PD-1⫹CD127⫹progenitor pool recently described (17) (Fig. 7).
Thus, persistent HCV infection could induce the low level of expression of TRAF1 in peripheral HCV-specific CD8⫹T cells; however, in cases in which these cells are not severely exhausted and still maintain their proliferative potential, they are able to
acquire a TRAF1highphenotype.
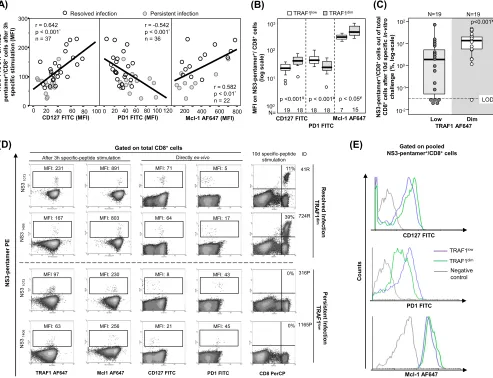
Correlation between TRAF1lowexpression and exhaustion phenotype.When all
cases with HCV pentamer-binding CD8⫹cells directly detectableex vivowere taken
together, induction of TRAF1 expression in pentamer⫹/CD8⫹cells after 3 h of specific
stimulation positively correlated with CD127 and Mcl-1 expression but negatively correlated with PD-1 expression (Fig. 8A and D). After 3 h of specific triggering of TCR, TRAF1dimpentamer⫹/CD8⫹cells showed higher levels of CD127 and Mcl-1 expression
but lower levels of PD-1 expression than TRAF1low-expressing cells (Fig. 8B and E).
TRAF1dimcells also had a higher intensity of proliferation than TRAF1lowpentamer⫹/
CD8⫹cells (Fig. 8C and D). Moreover, the percentage of CD107a-positive cells
detect-ableex vivowas higher in the TRAF1dimcell population (41%) than in the TRAF1lowcell
population (3%) (Fig. 9). In contrast, the level of gamma interferon (IFN-␥) secretionex
vivo was similarly low between the TRAF1dim and TRAF1low groups. However, after
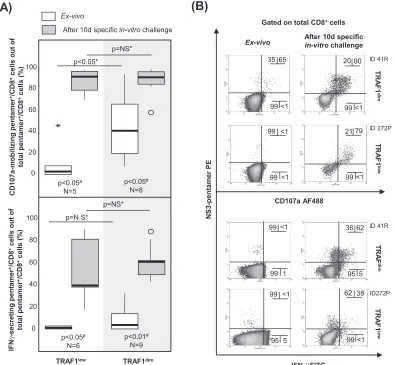
specificin vitroexpansion, IFN-␥and CD107a were upregulated in cells of both groups with a preserved expansion ability (Fig. 9). The clinical features of the patients with the TRAF1dimand TRAF1lowgroups are summarized in Table 3.
0 50 100 150 250
200
IFN-containing (N=20)
IFN-free (N=9)
V
C
H
ni
n
oi
s
s
er
p
x
e
1
F
A
R
T
-p
en
tam
e
r-b
in
di
n
g
CD8
+c
e
lls
(
M
FI)
p=NS§
Low
D
im
After 3h specific-peptide stimulation
(A)
(B)
IFN-free HCV-treatment regimen
IFN-containing
Gated on bulk CD8+cells
NS
31073
NS
31406 ID 41R
ID 41R
ID 442R
ID 1123R
TRAF1 AF647
H
C
V-Pe
n
ta
m
e
r PE
MFI: 231 MFI: 152
MFI: 143 MFI: 163
FIG 6TRAF1 expression in pentamer⫹/CD8⫹cells from resolved infection cases after interferon-free and interferon-containing regimens. Box plots (A) and
representative dot plots (B) showing the level of TRAF1 expression after 3 h of antigen-specific stimulation in HCV pentamer-binding CD8⫹cells from
sustained virologic responders to interferon (IFN)-containing and -free regimens. MFI, mean fluorescence intensity; NS, nonsignificant; §, Mann-Whitney U test.
on November 6, 2019 by guest
http://jvi.asm.org/
[image:10.585.50.532.73.335.2]Hence, after specific triggering of the TCR the existence of the TRAF1lowphenotype
could point to T cell exhaustion and TRAF1 upregulation could be considered a potential tool to enhance T cell reactivity.
IL-7 upregulates TRAF1 expression, while TGF-1 does the opposite. After describing a significant positive correlation between IL-7 receptor and TRAF1 expres-sion, we analyzed whether treatment with IL-7in vitrocould upregulate TRAF1 expres-sion in pentamer⫹/CD8⫹cells. In 8 out of 9 samples, TRAF1 expression in pentamer⫹/
MFI 84 MFI 91 MFI 153
MFI 38 MFI 17 MFI 25
P
en
tam
er
N
S
31073
PE
ALT (IU·ml-1)
HCV RNA (IU·ml-1)
Pre-treatment EOT 12 wk post treatment
G
a
te
d on t
o
ta
l C
D
8
+
ce
lls
G
a
ted on P
B
L
49
6.6 log10 Negative Negative
8 11
Genotype
Transient elastography (kPa)
1a
9.1 (F2)
Fibrosis rate (Units·year-1) 0.05
NS31073sequence CISGVCWTV
Ex-vivo
0.02% 0.05% 0.05%
After 10d specificin-vitrochallenge
CD8 PerCP
0.6% 6.9%
ND
Ex-vivo
PD-1 FITC
CD127 FITC
MFI 68 MFI 32 MFI 37
MFI 3 MFI 58 MFI 30
After 3h specificin-vitrochallenge
TRAF1 AF647
MFI 30 MFI 105 MFI 75
MFI 13 MFI 27 MFI 25
12% 10%
1.8%
0.08% 0.05%
0.02%
Pre-treatment EOT 12 wk post treatment
100
6.3 log10 Negative Negative
19 13
1b
12 (F3)
0.11 CINGVCWTV
Treatment OMB-PARI/rt/DAS+RBV x 12 weeks
Patient’s ID 442P
SOF-LED x 12 weeks 272P
FIG 7TRAF1 kinetics in pentamer⫹/CD8⫹cells during treatment with direct-acting antivirals. Longitudinal dot plots show the peripheralex vivofrequency, the
proliferation intensity after specificin vitrochallenge, the PD-1/CD127 level obtained directlyex vivo, and the level of TRAF1 expression after 3 h of specific stimulation in pentamer⫹/CD8⫹cells from two HCV genotype 1-infected patients during treatment with direct-acting antivirals. ALT, alanine aminotransferase;
EOT, end of treatment; OMB-PAR/rt/DAS⫹RBV, ombitasvir-paritaprevir-ritonavir-dasabuvir plus ribavirin; MFI, mean fluorescence intensity; PBL, peripheral blood lymphocyte; SOF-LED, sofosbuvir plus ledipasvir.
on November 6, 2019 by guest
http://jvi.asm.org/
[image:11.585.45.539.70.577.2]CD8⫹cells was upregulated after 6 days of treatment with IL-7 (20 ng · ml⫺1)in vitro
(Fig. 10A and B). Since Bim is upregulated on activated HCV-specific CD8⫹T cells during
chronic infection (9) and is known to be linked to both TGF-1 secretion (23, 33) and
TRAF1 downregulation (34, 35), we also addressed whether TGF-1 could
downmodu-late TRAF1 expression in pentamer⫹/CD8⫹cells. In 7 out of 7 pentamer⫹/CD8⫹cell
assays, TRAF1 expression was downregulated after 48 h of treatment with TGF-1
(5 ng · ml⫺1)in vitro(Fig. 10A and B).
Interestingly, the culture supernatant of PBL from patients with PI, which achieved a positive expansion after NS3-specific challenge in vitro, showed a higher relative decrease in TGF-1 levels at day 9 that at day 2 of culture than PBL without expansion (Fig. 10C, top). In addition, the absolute negative difference in the supernatant TGF-1 concentration was higher in samples with positive expansion than in samples without proliferation (Fig. 10C, bottom).
Considering the ability of TGF-1 to downregulate TRAF1 expressionin vitroand the fact that the same mechanism could influence the TRAF1 levelin vivo, we compared the
(C) (A) 80 40 0 300 200 100 0 100 60
20 200 400 600 800
3 S N n o 7 4 6 F A 1 F A R T-r e m at n e p +/CD8 + h 3 r et f a sll e c )I F M( n oi t al u mi t s ci fi c e p s
PD1 FITC (MFI)
CD127 FITC (MFI) Mcl-1 AF647 (MFI)
r = 0.642
p < 0.001*
n = 37
r = -0.542
p < 0.001*
n = 36
r = 0.582
p < 0.01*
n = 22 Persistent infection Resolved infection
20 60 1000 40 80 120
(E) CD127 FITC PD1 FITC Mcl-1 AF647 Co u n ts
Gated on pooled NS3-pentamer+/CD8+cells (B) (D) NS 3 -E P r e m at n e p NS 31073 NS 31406 TRAF1 AF647
Gated on total CD8+cells
CD127 FITC PD1 FITC
Mcl1 AF647 NS 31073 NS 31406 R e so lv ed I n fect io n TR A F 1 dim
After 3h specific-peptide stimulation Directly ex-vivo
CD8 PerCP 10d specific-peptide stimulation ID 41R 724R 316P 1165P 11% 39% 0% 0% P e rs is te n t In fe c tio n TR A F 1 lo w
MFI: 231 MFI: 891 MFI: 71 MFI: 5
MFI: 167 MFI: 803 MFI: 64 MFI: 17
MFI 97 MFI: 230 MFI: 8 MFI: 43
MFI: 63 MFI: 256 MFI: 21 MFI: 45
10-2 10-1 100 102 TRAF1 AF647 Dim Low NS 3 -pent a m e r +/CD8 +cel ls out of to ta l CD8 +cel ls a fte r 1 0 d s p e c if ic in -vi tr o ch a ll en g e (% , l o g -scal e ) p<0.001¥ N=19 N=19 101 * 100 Mcl-1 AF647 101 102 103 M F I on N S 3-pent a m e r
+/ C
D 8 +cel ls (l o g scal e) 7 15 N= CD127 FITC 19 18
p <0.001¥ p < 0.05¥
TRAF1dim
TRAF1low
PD1 FITC
18 18
p < 0.001¥ LOD
TRAF1low
Negative control
TRAF1dim
FIG 8Correlation between TRAF1 expression, exhaustion phenotype, and reactivity of HCV pentamer⫹/CD8⫹cells. Tests for TRAF1 and Mcl-1 were performed
after 3 h of specific peptide stimulation, while PD-1 and CD127 were assessed directlyex vivo. (A) Correlation between TRAF1 level and CD127, PD-1, and Mcl-1 expression on pentamer⫹/CD8⫹ cells pooled from patients with persistent and resolved infections. (B) PD-1, CD127, and Mcl-1 expression on HCV
pentamer⫹/CD8⫹cells from HCV patients, according to the TRAF1 level. (C) Rates of HCV pentamer⫹/CD8⫹cell proliferation after 10 days of specificin vitro
challenge, depending on the level of TRAF1 expression. (D) Representative dot plots showing the PD-1, CD127, and Mcl-1 phenotype (as the MFI) and the expansion ability (as the percentage of pentamer-binding CD8⫹cells out of the number of total CD8⫹cells) according to the TRAF1 level in pentamer⫹/CD8⫹
cells. (E) Histograms of PD-1, CD127, and Mcl-1 expression on pooled pentamer⫹/CD8⫹cells in relation to the TRAF1 level.*, Spearman correlation test; ¥, Mann-Whitney U test; negative control, T cell labeling with the nonspecific isotype antibody;Œ, outlier values; LOD, limit of detection; MFI, mean fluorescence intensity.
on November 6, 2019 by guest
http://jvi.asm.org/
[image:12.585.47.540.74.452.2]serum TGF-1 concentration in patients with RI and those with PI. Serum samples from patients with PI showed a slightly higher TGF-1 level than those from patients with RI (Fig. 10D, left). This difference translated into a negative correlation between the serum TGF-1 concentration and TRAF1 induction in HCV pentamer⫹/CD8⫹cells (Fig. 10D, right). Furthermore, we found that TRAF1dimHCV pentamer⫹/CD8⫹cells were
associ-ated with lower serum TGF-1 levels than TRAF1lowcells (Fig. 10E).
Our data suggest that IL-7 treatment could be a potential strategy to upregulate
TRAF1 by counteracting the TGF-1-mediated downregulation of TRAF1 in exhausted
T cells, in which triggering of TCR alone would not be enough to increase the TRAF1 level.
IL-7 plus 4-1BBL improves HCV pentamer-binding CD8ⴙcell reactivity.Since a lack of TRAF1 induction in pentamer⫹/CD8⫹cells correlated with impaired reactivity
and an exhausted phenotype and because we realized that IL-7 treatment in vitro
induced TRAF1 upregulation, we analyzed whether IL-7 plus 4-1BBL treatment could improve T cell reactivity in patients with PI. We first performed a pilot study in which we recruited 17 consecutive patients with PI with and without cells detectableex vivo to check if the IL-7 plus 4-1BBL combination could potentially be useful to restore the
(A)
(B)
IFN- FITC
N
S
3
-p
e
n
tam
er
P
E
CD107a AF488
TR
A
F
1
dim
TR
A
F
1
lo
w
TR
A
F
dim
TR
A
F
1
lo
w
After 10d specific
in-vitrochallenge
5
95 99<1
<1
<1 99
99
38 62 <1
99
79
<1 21
99
Gated on total CD8+cells
Ex-vivo
80 20 65
35
<1 99 <1
99
62 38 <1
99
5 95 1
99
ID 272P
ID272P ID 41R
ID 41R Ex-vivo
After 10d specific in-vitrochallenge
100
80
60
40
20
0
C
D
107a
-m
o
b
il
iz
in
g
p
e
n
tam
er
+/CD8 +c
e
lls
o
u
t
o
f
to
ta
l pent
a
m
e
r
+/C
D
8
+c
e
lls
(%
) p<0.05*
p=NS*
p<0.05#
N=5
p<0.05#
N=8
TRAF1low TRAF1dim
100
80
60
40
20
0
p=N.S*
p=NS*
p<0.05#
N=6
p<0.01#
N=9
IF
N
-s
e
c
re
ti
ng pent
a
m
e
r
+/C
D
8
+c
e
ll
s
out
of
to
ta
l pent
a
m
e
r
+/C
D
8
+c
e
lls
(
%
)
γ
γ
FIG 9CD107a-mobilizing and gamma interferon (IFN-␥)-secreting HCV pentamer⫹/CD8⫹cells according to the level of TRAF1
expression. Box plots (A) and representative dot plots (B) show the percentage of IFN-␥-secreting and CD107a-mobilizing pentamer⫹/CD8⫹cellsex vivoand after 10 days of specificin vitrochallenge, according to the TRAF1 level, among cells with
a preserved expansion ability.Œ, outlier value;*, extreme value. The data in each dot plot represent the percentage of positive cells out of the number of either total CD8⫹ cells or pentamer⫹/CD8⫹ cells. NS, nonsignificant; #, Wilcoxon test; *, Mann-Whitney U test.
on November 6, 2019 by guest
http://jvi.asm.org/
[image:13.585.46.441.74.439.2]T cell expansion ability. PBL from these cases were challengedin vitrowith the NS31406
peptide and then received one of the following different treatments: 4-1BBL, IL-7, IL-7 plus 4-1BBL, or -galactosidase as a negative control. The number of samples with positive expansion increased from 35% in the control group to 65% after IL-7 plus 4-1BBL treatmentin vitro, while treatment with IL-7 or 4-1BBL alone did not have any significant effect (Fig. 11A).
Subsequently, considering the negative correlation between the duration of HCV infection and theex vivodetection/reactivity of peripheral pentamer⫹/CD8⫹cells, we
explored whether IL-7 plus 4-1BBL treatment worked with a similar effectiveness in
cases with and without peripheral pentamer⫹/CD8⫹ cells detectable ex vivo. We
analyzed the results of 13 and 39 consecutive proliferation experiments with and withoutex vivo-detectable pentamer⫹/CD8⫹cells against NS3
1406or NS31073epitopes,
respectively. The cases with detectable cellsex vivohad an infection length of 31 years, while patients without visible cells had a longer infection span of 40 years (Fig. 11B). Interestingly, in experiments with peripheral cells detectableex vivo, 4-1BBL plus IL-7 treatment increased the proportion of T cell-reactive cases from 61% positive expan-sion in the control group to 92% positive expanexpan-sion after the addition of 4-1BBL plus IL-7 treatment (Fig. 11B and E; Table 2). The only nonrestored case was a cirrhotic (degree of liver fibrosis, F4) rapid fibroser patient (patient 1165P) whose T cell reactivity was reestablished by treatment with the combination of 4-1BBL, IL-7, and anti-PD-L1 (Fig. 11E). In cases without detectable cellsex vivo, the combination of 4-1BBL plus IL-7 was less effective, only enhancing T cell reactivity in some patients from 20% to 33% (Fig. 11B and E; Table 2).
Treatment with IL-7, 4-1BBL, and anti-PD-L1 improves HCV pentamer-binding CD8ⴙ cell reactivity in slow fibrosers with long-lasting disease. Because of the unsatisfactory restoration of T cell reactivity by using treatment with IL-7 plus 4-1BBL
in cases with no pentamer⫹ cells detectable ex vivo and long-lasting disease, we
assumed that the exhausted effector memory cell pool could have already disappeared and a potential PD-1-expressing population with stem cell properties but with an impaired regenerative capacity could survive in these cases, as recently suggested (14–16). Therefore, PBL from 20 patients with no pentamer⫹cells detectableex vivo
were challenged in vitro with the combination of IL-7, 4-1BBL, and anti-PD-L1.
[image:14.585.47.371.93.229.2]-Galactosidase, anti-PD-L1, and IL-7 plus 4-1BBL were used as controls. PBL from 20% of cases expanded after either -galactosidase or anti-PD-L1 treatment in vitro, PBL from 30% of cases proliferated after treatment with the IL-7 plus 4-1BBL combination, and cells from 50% of the cases expanded with treatment with IL-7, 4-1BBL, and anti-PD-L1 (Fig. 11C and E). Globally, the cases with no peripheral pentamer⫹/CD8⫹
TABLE 3Clinical features of recruited patients with CD8⫹/pentamer⫹cells directly detectableex vivoaccording to TRAF1 expressiona
Characteristic
Value(s) for patients with:
Pvalue TRAF1low
(nⴝ19)
TRAF1dim
(nⴝ19)
% of patients with PI/RI 64/36 15/85 0.003b
Median (IQR) age (yr) 53 (11) 57 (10) NSc
% of male patients 68 58 NSb
Median (IQR) duration of infection (yr) 34 (11) 32 (5) NSc
Median (IQR) viral load (IU · ml⫺1, log scale) 5.9 (6.6) UDL 0.003c
Mean (SD) ALT concn (IU · ml⫺1) 64 (76) 35 (9) 0.136c
% of patients with significant fibrosis (F3-F4) 57 42 NSb
Median (IQR) liver fibrosis progression rate (Metavir score [unit · year⫺1])
0.074 (0.07) 0.069 (0.06) NSc
% of patients who were slow fibrosers 45 36 NSb
aALT, alanine aminotransferase; IQR, interquartile range; NS, nonsignificant; PI, persistent infection; RI,
resolved infection after treatment; UDL, under the detection limit.
bDetermined by the chi-square test. cDetermined by the Mann-Whitney U test.
on November 6, 2019 by guest
http://jvi.asm.org/
cells detectable ex vivo that benefited from the combination of IL-7, 4-1BBL, and anti-PD-L1 were patients with low rates of liver fibrosis progression (Fig. 11D and E). Only two cases without cells detectableex vivoand a liver fibrosis progression rate of 0.07 unit · year⫺1 responded to treatment with the combination of IL-7, 4-1BBL, and
anti-PD-L1, but these two cases had short/midduration infections of 29 years (Fig. 11D and E).
Hence, our data suggest that IL-7 plus 4-1BBL treatment could improve HCV-specific cytotoxic T cell reactivity in patients with short/midduration infections. However, in cases with disease for longer durations, a more severe T cell exhaustion is usually present, making an additional blockade of the PD-1/PD-L1 checkpoint necessary to enhance the T cell proliferative potential.
DISCUSSION
In order to establish a persistent infection, HCV induces the exhaustion or even deletion of the HCV-specific CD8⫹T cell response (8, 10). Among other strategies, HCV
(D)
TGF-β1 (5 ng·mL- 1)
Co
u
n
ts
Gated on pooled NS3-pentamer+/CD8+cells
β-Gal (2μg·mL-1)
TRAF1 AF647
Negative
control β-Gal (2μg·mL
-1)
Negative control
IL-7 (20 ng·mL-1)
(B)
NS 3 -Pe n ta m e r PE TRAF1 AF647IL-7 (20 ng·mL-1)
β-Gal (2μg·mL-1) TGF-β1 (5 ng·mL-1)
Total CD8+cells
AF647 IgG
β-Gal (2μg·mL-1)
6-day stimulation 48h stimulation ID : 901R ID : 276R
MFI: 125 MFI: 70 MFI: 27
MFI: 115 MFI: 160 MFI: 10
(C)
(A)
p<0.05¤
n=7
TGF-β1 (5 ng·mL-1)
β-Gal (2μg·mL-1)
r e m at n e p n o n oi s s er p x e 7 4 6 F A 1 F A R T +/CD8 + c e lls ( M F I) IL-7 (20 ng·mL-1)
p<0.05¤
n=9
After 6 day in-vitro
treatment
After 48hin-vitro
treatment
β-Gal (2μg·mL-1)
0 50 100 150 200 250 300 40 30 20 10 0 300 200 100 0 Resolved Infection Persistent infection r=-0.421 p<0.05¥ n=27 T R A F 1 A F 6 4 7 exp ressi o n o n N S 3 -P e n tam er +/CD8 +c e lls ( M F I)
Serum TGF-β1 (ng·mL-1)
(E)
N=12 N=15 40 30 20 10 0 -10 p<0.05# TRAF1dim TRAF1lowNS3-pentamer+/CD8+cells
Se ru m TG F -β 1 ( ng/ m L)
NS3-specific in-vitro culture of PBL from PI cases
NS3-pentamer+/CD8+cell proliferation
Positive Negative
Day-2 Day-9Day-2 Day-9
F G T t n at a nr e p u S-β 1 l evel (ng·m L -1) TG F -β e s a er c e d l e v el 1 f o 9 d d n a 2 d n e e wt e b cu lt u re ( % ) p<0.01# n=8 n=12 -10 0 20 40 60 10 30 50
p<0.05¤ p<0.05¤
0 1 2 3 4 5 6 7 70 p<0.05# 0 10 20 30 40 50 Resolved infection (n=15) Persistent infection (n=18) p<0.05# Se ru m T G F -β 1 (ng·m L -1)
FIG 10TRAF1 regulation by IL-7 and TGF-1 in pentamer⫹/CD8⫹cells. (A) Levels of TRAF1 expression in pentamer⫹/CD8⫹cells after-galactosidase (-Gal),
IL-7, and TGF-1 treatmentsin vitro. Box plots summarize the distribution of the level of TRAF1 expression in each category. (B) Representative dot plots and histograms showing TRAF1 levels in pentamer⫹/CD8⫹cells after IL-7, TGF-1, and-galactosidase treatmentsin vitro. (C) In selected patients with PI, the
dynamics of the TGF-1 levels in PBL culture supernatants between day 2 and day 9 of NS3-specificin vitrochallenge, according to cell expansion status. (Top) Global variation in TGF-1 levels; (bottom) individual variation in TGF-1 levels. Box plots summarize the distribution of either the absolute value or the relative variation in the TGF-1 level in each category. (D) (Left) Serum TGF-1 level in patients with persistent infection and resolved infection after treatment. Box plots represent the distribution of the TGF-1 levels in each group. (Right) Correlation between the serum TGF-1 level and TRAF1 expression in HCV pentamer⫹/CD8⫹cells after 3 h of specific stimulation. (E) Serum TGF-1 concentration according to the TRAF1 phenotype of HCV pentamer⫹