An interactive decision support tool for participatory pest management planning: combining local, regional and scientific knowledge through immersive, collaborative and interactive technologies
291
0
0
Full text
(2) An Interactive Decision Support Tool for Participatory Pest Management Planning Combining Local, Regional and Scientific Knowledge Through Immersive, Collaborative and Interactive Technologies. By Dylan Mitchell Mathiesen B.IT (Hons I). Thesis submitted by Dylan Mitchell Mathiesen in partial fulfillment of the requirements for the Degree of Doctor of Philosophy in Information Technology under the College of Business, Law, Governance and IT at James Cook University.. College of Business, Law, Governance and IT, James Cook University.. 23 December 2016.
(3) Declaration. I declare that this thesis is my own work and has not been submitted in any form for another degree or diploma at any university or other institute of tertiary education. Information derived from the published and unpublished work of others has been acknowledged in the text and a list of references is given.. Dylan Mitchell Mathiesen 23 December 2016.
(4) Statement of Access to Thesis. I, the undersigned, the author of this thesis, grant James Cook University permission to make this thesis and included data available: for use within the University Library; for archival in formats that do not reduce the quality of the work; and for digital distribution online, to other libraries and scientific organisations when necessary. All users consulting this thesis are bound by the Commonwealth Copyright Act 1968 and all future revisions to the act, along with the licensing assigned to this thesis. In consulting this thesis you agree not to copy or closely paraphrase it in whole or in part without the written consent of the author; and to make proper written acknowledgement for any assistance which you have obtained from it. Beyond this, there are no restrictions placed on access to this thesis..
(5) Statement of Contributions. The researcher was supported under the Australian Postgraduate Award scholarship. Budget for publication, travel and tools were provided by the College of Business, Law and Governance and the JCU eResearch Centre. Expertise and mentorship were provided by Travis Sydes and Helen Murphy who assisted in identifying participants and organising sessions with them, ensuring the study was suitably designed and providing expert opinion on the function of the software. CSIRO provided accommodation and facilities when working remotely with stakeholders. This thesis was professionally copy edited by "The Expert Editor" following the IPEd guidelines. All of the work within this thesis is solely the Authors, with the exception of the items noted under this Statement of Contributions or additional materials within this thesis that have been clearly cited. No work within this thesis has been intentionally taken without permission..
(6) Abstract Decisions about resource allocation for invasive species management are usually made by multiple land managers who lack full knowledge of, or access to, information about the landscape beyond their area of interest. Although a vast number of modelling tools exist to aid pest management they are often too difficult for the majority of pest managers or are too time consuming to run. Advances in interactive technologies have opened new opportunities for the development of engaging decision support tools. The combination of these technologies with pest management planning will allow multiple stakeholders to engage and assess interactions simultaneously, so management decisions can be based on a larger ecological and financial vision. This thesis explores the value interactive technologies have for improving the pest management decision making process. To investigate the potential of interactive technologies applied to pest management planning an interactive tool was designed, developed and evaluated. Far North Queensland (FNQ) was selected as the study location due to its rich biodiversity and ideal climate for pest weeds. The research was divided into three phases: 1) Understanding the existing pest management process, both from relevant literature and from the perspectives of individual pest managers as well as identifying areas where interactive technologies could be applied; 2) Implementation of the tool; 3) Refinement of the tool with end users and evaluation with real pest managers. Phase One explored the existing pest management process, expanding on the literature and methodologies used for pest management in FNQ. Analysis of the existing pest management process was conducted using Activity Theory (AT) and the ActivityOriented-Design Methodology (AODM). Contradictions and limitations in the existing process were identified along with a series of pertinent research questions, the answers for which would help develop a deeper understanding of pest management. These questions were answered using a series of interviews with six pest management planners from different backgrounds. An observational study was also conducted with a group of expert ecologists using an interactive tool with a new type of distribution model to collect feedback on its potential in pest management..
(7) Phase Two developed an implementation based on the findings of the first phase. A new type of interactive pest management decision support tool was built around the MigClim dispersal model. A number of optimisations were made to improve its runtime. A web service was developed that could run the MigClim model and render dispersal outputs. An interactive user interface was built around the web service that allows users to add pest populations and define management objectives to interact with the model. The user could press the run button at any time to see a visualisation of the impact their objectives had on the pest species over time along with the cost and amount of work required. Phase Three incorporated potential end users to refine the interaction process and conceptual design of the tool. Two usability testing sessions were run with groups of three participants. A number of issues were found where the tool did not provide the information the participants needed or behaved unexpectedly. These concerns were addressed in new iterations of the prototype tool. A final case study was conducted with six experienced pest managers. They were trained in using the tool and asked to develop a plan around a quasi-real pest species. An evaluation was conducted after the focus group to explore how this interactive tool compared to traditional pest management planning. There were a number of key findings about interactive technologies and pest management. Both experienced planners and first time planners, with limited training, ran the MigClim dispersal model to inform their decision making processes. The tool allowed them to refine their plans over a period of time using the model to evaluate different strategies. The planners highlighted the ability for interactive tools like this to be used in other applications such as: educating communities, engaging uninterested stakeholders, preparing budgets, and building consensus with other planners..
(8) Acknowledgements There are many people from both my personal and university life that I need to thank for their support over the past 4 years.. I would first like to express my sincerest gratitude to my primary advisor, Prof. Ian Atkinson, I could not have done this without you. Your mentorship and advice over the past few years has been invaluable in shaping both my research and personal development.. Besides my primary advisor, I need to thank the rest of my advisory committee: Prof. Jeremy VanDerWal your guidance, expertise and input were invaluable; Asoc. Prof. Trina Myers, I would not have even started a PhD without your caring guidance, you’ve been extremely supportive since my years as an undergraduate; Dr. Helen Murphy and Travis Sydes, I could not have finished without you, thank you for sharing your expertise and time.. Thanks to my parents who have supported me through all my years of schooling, I owe you a great deal of gratitude. One day I will clean out my old bedroom, I promise.... Thanks to my partner Amy, thanks for being so supportive and putting up with me over the past few years.. Thanks to all the additional people who helped me proofread, Steve, Collin, Bill, Tamara and Amy. I literally could not have got the thesis to this point without you.. And to all my friends, without you I would have submitted two years sooner..
(9) Publications Mathiesen, D., Myers, T., & Atkinson, I. (2014). Large Scale, Collaborative, Invasive Species Planning and Visualisation Tool. Proceedings of the 7th International Symposium on Visual Information Communication and Interaction - VINCI ’14, 204–207. http://doi.org/10.1145/2636240.2636865. Mathiesen, D., Myers, T., Atkinson, I., & VanDerWal, J. (2016). TerrainVis: Collaborative, Interactive, Visualisation Tool for Engaging Residents in Disaster Preparedness. In Cooperative Design, Visualization, and Engineering: 13th International Conference, CDVE 2016 Sydney, NSW, Australia, October 24-27, 2016 Proceedings (pp. 110–117). http://doi.org/10.1007/978-3-319-46771-9_15.
(10) Glossary ACD. Activity-Centred Design. AODM. Activity-Oriented Design Methodology. API. Application Programming Interface. AR. Augmented Reality. AT. Activity Theory. AWPM. Areawide Pest Management. CAVE. CAVE Automatic Virtual Environment. FNQROC Far North Queensland Regional Organisation of Councils HCI. Human-Computer Interaction. HCD. Human-Centred Design. IPM. Integrated Pest Management. JCU. James Cook University. PNG. Portable Network Graphic. QLD. Queensland. QPWS. Queensland Parks and Wildlife Service. RPC. Remote Procedure Call. UCD. User Centred Design i.
(11) WFS. Web Feature Service. WMS. Web Map Service.
(12) Contents Glossary. i. List of Figures 1. 2. xii. Introduction. 1. 1.1. The Invaders . . . . . . . . . . . . . . . . . . . . . . . . . . . . . . . . . . . .. 2. 1.2. Interactive Technologies . . . . . . . . . . . . . . . . . . . . . . . . . . . . .. 5. 1.3. A Collaborative Tool for Engagement Around Management Decisions . .. 6. 1.4. Research Overview . . . . . . . . . . . . . . . . . . . . . . . . . . . . . . . .. 7. 1.4.1. Research Aims . . . . . . . . . . . . . . . . . . . . . . . . . . . . . .. 7. 1.4.2. Research Contributions . . . . . . . . . . . . . . . . . . . . . . . . .. 8. 1.4.3. Constraints and Assumptions . . . . . . . . . . . . . . . . . . . . . .. 9. 1.4.4. Personal Pronoun . . . . . . . . . . . . . . . . . . . . . . . . . . . . .. 10. 1.4.5. Research Approach . . . . . . . . . . . . . . . . . . . . . . . . . . . .. 10. 1.4.6. Thesis Structure . . . . . . . . . . . . . . . . . . . . . . . . . . . . . .. 12. Literature Review. 15. 2.1. Introduction . . . . . . . . . . . . . . . . . . . . . . . . . . . . . . . . . . . .. 17. 2.2. Terminology . . . . . . . . . . . . . . . . . . . . . . . . . . . . . . . . . . . .. 17. 2.3. The Pest Management Problem . . . . . . . . . . . . . . . . . . . . . . . . .. 18. 2.3.1. Integrated Pest Management . . . . . . . . . . . . . . . . . . . . . .. 20. 2.3.2. Areawide Pest Management . . . . . . . . . . . . . . . . . . . . . .. 23. Contemporary Pest Management . . . . . . . . . . . . . . . . . . . . . . . .. 24. 2.4.1. 25. 2.4. Organised Pest Management . . . . . . . . . . . . . . . . . . . . . .. iii.
(13) 2.5. 2.6. 2.7 3. 2.4.2. Modelling and Forecasting to Direct Resources . . . . . . . . . . . .. 27. 2.4.3. Conservation Planning - A Closely Related Field . . . . . . . . . . .. 31. 2.4.4. Participation in Planning . . . . . . . . . . . . . . . . . . . . . . . .. 32. 2.4.5. Looking Forward . . . . . . . . . . . . . . . . . . . . . . . . . . . . .. 34. Engagement Through Interactive Technologies . . . . . . . . . . . . . . . .. 35. 2.5.1. Interactive Technologies . . . . . . . . . . . . . . . . . . . . . . . . .. 36. Combining Interactive Technology and Pest Management Planning . . . .. 43. 2.6.1. Interactive Modelling . . . . . . . . . . . . . . . . . . . . . . . . . .. 43. 2.6.2. Considerations for New Interactive Decision Support Systems . . .. 44. Chapter Summary . . . . . . . . . . . . . . . . . . . . . . . . . . . . . . . . .. 45. Methodology. 47. 3.1. Research Theory: Activity-Centred Design . . . . . . . . . . . . . . . . . .. 49. 3.1.1. Activity Theory . . . . . . . . . . . . . . . . . . . . . . . . . . . . . .. 51. 3.1.2. Software Development and User Interface Design . . . . . . . . . .. 55. 3.2. 3.3. 3.4. 3.5. Research Methods. . . . . . . . . . . . . . . . . . . . . . . . . . . . . . . . .. 56. 3.2.1. Semi-Structured Interviews . . . . . . . . . . . . . . . . . . . . . . .. 57. 3.2.2. Observational Stuides . . . . . . . . . . . . . . . . . . . . . . . . . .. 57. 3.2.3. Usability Testing Sessions . . . . . . . . . . . . . . . . . . . . . . . .. 58. 3.2.4. Focus Groups . . . . . . . . . . . . . . . . . . . . . . . . . . . . . . .. 59. Research Approach: Putting Theory into Practice. . . . . . . . . . . . . . .. 59. 3.3.1. Decomposing the Existing Process . . . . . . . . . . . . . . . . . . .. 63. 3.3.2. Interviews . . . . . . . . . . . . . . . . . . . . . . . . . . . . . . . . .. 64. 3.3.3. Observational Study . . . . . . . . . . . . . . . . . . . . . . . . . . .. 67. 3.3.4. Developing the Prototype . . . . . . . . . . . . . . . . . . . . . . . .. 69. 3.3.5. Refining the MigClim Model for Interaction . . . . . . . . . . . . .. 70. 3.3.6. Usability Testing . . . . . . . . . . . . . . . . . . . . . . . . . . . . .. 72. 3.3.7. Case Study . . . . . . . . . . . . . . . . . . . . . . . . . . . . . . . . .. 75. Detailed Participant Selection and Recruitment . . . . . . . . . . . . . . . .. 78. 3.4.1. Ethics . . . . . . . . . . . . . . . . . . . . . . . . . . . . . . . . . . . .. 79. Chapter Summary . . . . . . . . . . . . . . . . . . . . . . . . . . . . . . . . .. 79.
(14) 4. Phase 1: Exploring the Problem 4.1. 4.2. 4.3. 4.4. 5. Current Process Analysis. 80 . . . . . . . . . . . . . . . . . . . . . . . . . . . .. 82. 4.1.1. Pest Management Forum and Special Working Group . . . . . . . .. 82. 4.1.2. Description of the Current Planning Process . . . . . . . . . . . . .. 84. 4.1.3. AODM Breakdown . . . . . . . . . . . . . . . . . . . . . . . . . . . .. 86. Interviews . . . . . . . . . . . . . . . . . . . . . . . . . . . . . . . . . . . . .. 90. 4.2.1. Summary of Activities . . . . . . . . . . . . . . . . . . . . . . . . . .. 91. 4.2.2. Participant Roles and Responsibilities . . . . . . . . . . . . . . . . .. 92. 4.2.3. Management Process . . . . . . . . . . . . . . . . . . . . . . . . . . .. 95. 4.2.4. Data Collection . . . . . . . . . . . . . . . . . . . . . . . . . . . . . .. 99. 4.2.5. Collaboration . . . . . . . . . . . . . . . . . . . . . . . . . . . . . . . 102. 4.2.6. Outcomes . . . . . . . . . . . . . . . . . . . . . . . . . . . . . . . . . 105. Observational Study - War Room Style Planning . . . . . . . . . . . . . . . 106 4.3.1. Training Participants to Use the Interactive Projector . . . . . . . . 107. 4.3.2. Results . . . . . . . . . . . . . . . . . . . . . . . . . . . . . . . . . . . 107. 4.3.3. Summary . . . . . . . . . . . . . . . . . . . . . . . . . . . . . . . . . 112. Chapter Summary . . . . . . . . . . . . . . . . . . . . . . . . . . . . . . . . . 113 4.4.1. Contradictions and Limitations . . . . . . . . . . . . . . . . . . . . . 113. 4.4.2. Refining the Scope of the project . . . . . . . . . . . . . . . . . . . . 114. Phase 2: Implementation. 116. 5.1. Introduction . . . . . . . . . . . . . . . . . . . . . . . . . . . . . . . . . . . . 118. 5.2. A Conceptual Overview . . . . . . . . . . . . . . . . . . . . . . . . . . . . . 118. 5.3. 5.2.1. Functional Requirements . . . . . . . . . . . . . . . . . . . . . . . . 119. 5.2.2. Workflow . . . . . . . . . . . . . . . . . . . . . . . . . . . . . . . . . 121. 5.2.3. Dispersal Model . . . . . . . . . . . . . . . . . . . . . . . . . . . . . 123. 5.2.4. Interaction . . . . . . . . . . . . . . . . . . . . . . . . . . . . . . . . . 124. 5.2.5. Why Build for the Web? . . . . . . . . . . . . . . . . . . . . . . . . . 125. 5.2.6. The Progression of This Spatial Planning Tool . . . . . . . . . . . . 127. Implementation Overview 5.3.1. . . . . . . . . . . . . . . . . . . . . . . . . . . . 128. User Interface . . . . . . . . . . . . . . . . . . . . . . . . . . . . . . . 128.
(15) 5.3.2 5.4. 5.5. 5.6 6. The Web Service . . . . . . . . . . . . . . . . . . . . . . . . . . . . . 141. Iteration One . . . . . . . . . . . . . . . . . . . . . . . . . . . . . . . . . . . . 147 5.4.1. The Web Service . . . . . . . . . . . . . . . . . . . . . . . . . . . . . 149. 5.4.2. Algorithm refinements . . . . . . . . . . . . . . . . . . . . . . . . . . 150. Iteration Two. . . . . . . . . . . . . . . . . . . . . . . . . . . . . . . . . . . . 154. 5.5.1. Multi-threading and Asynchronous Output . . . . . . . . . . . . . . 154. 5.5.2. User Interface . . . . . . . . . . . . . . . . . . . . . . . . . . . . . . . 158. Chapter Summary . . . . . . . . . . . . . . . . . . . . . . . . . . . . . . . . . 162. Phase 3: Refinement and Evaluation 6.1. 6.2. 6.3. 6.4. 6.5. 163. Usability Analysis of Iteration Two . . . . . . . . . . . . . . . . . . . . . . . 165 6.1.1. Results . . . . . . . . . . . . . . . . . . . . . . . . . . . . . . . . . . . 165. 6.1.2. Summary . . . . . . . . . . . . . . . . . . . . . . . . . . . . . . . . . 170. Developing Iteration Three . . . . . . . . . . . . . . . . . . . . . . . . . . . 171 6.2.1. Map Rendering . . . . . . . . . . . . . . . . . . . . . . . . . . . . . . 172. 6.2.2. User Interface . . . . . . . . . . . . . . . . . . . . . . . . . . . . . . . 173. 6.2.3. Summary . . . . . . . . . . . . . . . . . . . . . . . . . . . . . . . . . 178. Usability Analysis of Iteration Three . . . . . . . . . . . . . . . . . . . . . . 178 6.3.1. Results . . . . . . . . . . . . . . . . . . . . . . . . . . . . . . . . . . . 179. 6.3.2. Summary . . . . . . . . . . . . . . . . . . . . . . . . . . . . . . . . . 182. Developing Iteration Four . . . . . . . . . . . . . . . . . . . . . . . . . . . . 183 6.4.1. Management Objective Period and Transitions . . . . . . . . . . . . 184. 6.4.2. Run Model Button . . . . . . . . . . . . . . . . . . . . . . . . . . . . 189. 6.4.3. Additional Features . . . . . . . . . . . . . . . . . . . . . . . . . . . 190. 6.4.4. Summary . . . . . . . . . . . . . . . . . . . . . . . . . . . . . . . . . 192. Pest Management Tool Evaluation: A Case Study with a Quasi-Real Species 193 6.5.1. Process . . . . . . . . . . . . . . . . . . . . . . . . . . . . . . . . . . . 194. 6.5.2. Results and Discussion. 6.5.3. Evaluation. 6.5.4. Future Works . . . . . . . . . . . . . . . . . . . . . . . . . . . . . . . 211. 6.5.5. Summary . . . . . . . . . . . . . . . . . . . . . . . . . . . . . . . . . 212. . . . . . . . . . . . . . . . . . . . . . . . . . 195. . . . . . . . . . . . . . . . . . . . . . . . . . . . . . . . . 206.
(16) 6.6 7. Chapter Summary . . . . . . . . . . . . . . . . . . . . . . . . . . . . . . . . . 212. Discussion. 214. 7.1. Introduction . . . . . . . . . . . . . . . . . . . . . . . . . . . . . . . . . . . . 216. 7.2. Summary of Findings . . . . . . . . . . . . . . . . . . . . . . . . . . . . . . . 216. 7.3. Implications of the Findings . . . . . . . . . . . . . . . . . . . . . . . . . . . 217 7.3.1. Enables Non-Experts to Use Scientific Models . . . . . . . . . . . . 217. 7.3.2. Reducing the Time for Scientific Models to Inform Pest Management Planning . . . . . . . . . . . . . . . . . . . . . . . . . . . . . . 218. 8. 7.3.3. Increases the Effectiveness of Integrated Pest Management Planning 219. 7.3.4. Increase the Planning Capabilities for Areawide Pest Management. 7.3.5. Collecting and Working With Local Knowledge . . . . . . . . . . . 220. 7.3.6. Engaging Those Who Implement Plans . . . . . . . . . . . . . . . . 221. 7.3.7. Encourages Consensus Building . . . . . . . . . . . . . . . . . . . . 221. 7.3.8. Engaging Remote Stakeholders . . . . . . . . . . . . . . . . . . . . . 222. 7.3.9. Demonstrating a Need for Funding . . . . . . . . . . . . . . . . . . 222. Conclusion 8.1. 220. 224. Contributions . . . . . . . . . . . . . . . . . . . . . . . . . . . . . . . . . . . 226 8.1.1. Demonstrated that Interactive Tools Can Provide Value to the Planning Process . . . . . . . . . . . . . . . . . . . . . . . . . . . . . 226. 8.1.2. Showed Interactive and Collaborative Decision Support Tools can be Easily Applied to Pest Management Planning . . . . . . . . . . . 227. 8.2. 8.3. 8.1.3. Implications and Design Considerations . . . . . . . . . . . . . . . 228. 8.1.4. Improved the Runtime of a Widely Used Dispersal Model . . . . . 228. Future Work . . . . . . . . . . . . . . . . . . . . . . . . . . . . . . . . . . . . 229 8.2.1. Community Engagement and Education . . . . . . . . . . . . . . . 229. 8.2.2. Connected Ecosystem . . . . . . . . . . . . . . . . . . . . . . . . . . 229. 8.2.3. Multiple Species . . . . . . . . . . . . . . . . . . . . . . . . . . . . . 230. 8.2.4. Integrating Optimisation Model with Human Stakeholders . . . . 230. 8.2.5. Just Ship it and Improve it Later . . . . . . . . . . . . . . . . . . . . 230. Summary . . . . . . . . . . . . . . . . . . . . . . . . . . . . . . . . . . . . . . 231.
(17) Bibliography. 233. 9. 255. Appendices 9.1. Iteration 5 - Post Real World Testing Improvements . . . . . . . . . . . . . 255 9.1.1. 9.2. 9.3. Changing Data Formats to Increase Performance . . . . . . . . . . . 255. Information Sheets . . . . . . . . . . . . . . . . . . . . . . . . . . . . . . . . 257 9.2.1. Interview Recruitment. . . . . . . . . . . . . . . . . . . . . . . . . . 257. 9.2.2. Interview, Usability Analysis and Focus Group Information Sheet. 261. Interview Questions . . . . . . . . . . . . . . . . . . . . . . . . . . . . . . . 263 9.3.1. Activity Notation Research Questions . . . . . . . . . . . . . . . . . 263. 9.4. Focus Group Questions . . . . . . . . . . . . . . . . . . . . . . . . . . . . . . 264. 9.5. Focus Group Order . . . . . . . . . . . . . . . . . . . . . . . . . . . . . . . . 266. 9.6. Software . . . . . . . . . . . . . . . . . . . . . . . . . . . . . . . . . . . . . . 267. 9.7. 9.6.1. Prototype 5 . . . . . . . . . . . . . . . . . . . . . . . . . . . . . . . . 267. 9.6.2. Prototype 4 . . . . . . . . . . . . . . . . . . . . . . . . . . . . . . . . 268. Testing Scripts . . . . . . . . . . . . . . . . . . . . . . . . . . . . . . . . . . . 268 9.7.1. MigClim run-time comparison scripts . . . . . . . . . . . . . . . . . 268. 9.7.2. MigClim raster comparison script . . . . . . . . . . . . . . . . . . . 269. 9.7.3. MigClim Testing Configuration. . . . . . . . . . . . . . . . . . . . . 269.
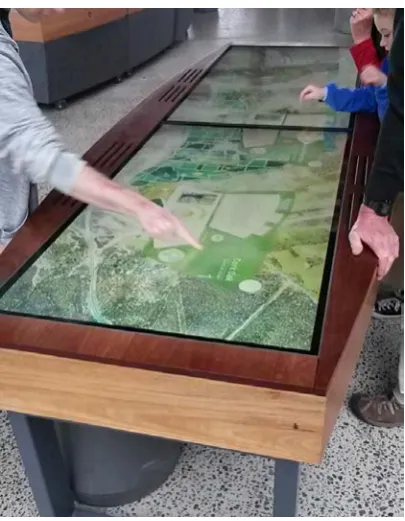
(18) List of Figures 1.1. Layers of pest managers, stakeholders and organisations in Far North Queensland. Based on Peterson et al. (2007).. 1.2. . . . . . . . . . . . . . . . . .. 4. Interactive Touch Table at the National Arboretum, Canberra Australia. Users can select locations on the map to view additional information and rich media.. . . . . . . . . . . . . . . . . . . . . . . . . . . . . . . . . . . . .. 1.3. Overview of the thesis structure. . . . . . . . . . . . . . . . . . . . . . . . .. 2.1. Diagram showing the order of research activities presented in this thesis. The blue highlight illustrates the current position in the thesis. . . . . . . .. 2.2. 6 13. 16. Visualisation of the MigClim dispersal model, captured from the software developed in this thesis. . . . . . . . . . . . . . . . . . . . . . . . . . . . . .. 29. 2.3. Samsung Gear VR headset. Image by Nan Palmero (Palmero, 2015). . . . . .. 38. 2.4. Participants collaborating around an interactive projector during the observational study conducted in Section 4.3 on page 106. . . . . . . . . . . .. 3.1. Diagram showing the order of research activities presented in this thesis. The blue highlight illustrates the current position in the thesis. . . . . . . .. 3.2. 41. 48. Activity-Centred Design process proposed by Gay and Hembrooke (2004). Diagram by Bishop (2016). . . . . . . . . . . . . . . . . . . . . . . . . . . . . .. 50. 3.3. Second generation activity system developed by Engeström (1987). . . . .. 52. 3.4. Timeline of the research activities undertaken as part of this project. . . . .. 62. 3.5. Participants sketching ideas onto a projected map during the observed workshop. . . . . . . . . . . . . . . . . . . . . . . . . . . . . . . . . . . . . .. ix. 68.
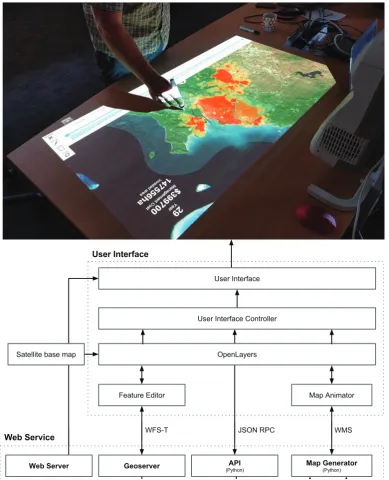
(19) 4.1. Diagram showing the order of research activities presented in this thesis. The blue highlight illustrates the current position in the thesis. . . . . . . .. 4.2. Atherton Tablelands Regional Council strategy for managing Turbina corymobsa, an outcome of the pest management working group. . . . . . .. 4.3. 83. Activity system showing the pest management process in Far North Queensland . . . . . . . . . . . . . . . . . . . . . . . . . . . . . . . . . . . .. 5.1. 81. 89. Diagram showing the order of research activities presented in this thesis. The blue highlight illustrates the current position in the thesis. . . . . . . . 117. 5.2. Flowchart depicting the workflow of the pest management decision support tool user interface.. . . . . . . . . . . . . . . . . . . . . . . . . . . . . . 123. 5.3. User Interface diagram.. . . . . . . . . . . . . . . . . . . . . . . . . . . . . . 129. 5.4. Toolbar, showing the view selector, map controls and layer switching shortcuts.. . . . . . . . . . . . . . . . . . . . . . . . . . . . . . . . . . . . . . 130. 5.5. Management strategies selection menu. . . . . . . . . . . . . . . . . . . . . 131. 5.6. Layers menu. . . . . . . . . . . . . . . . . . . . . . . . . . . . . . . . . . . . 132. 5.7. Data interface view. This interface allows participants to add new populations of the target pest species. Current pest populations are shown as white squares. . . . . . . . . . . . . . . . . . . . . . . . . . . . . . . . . . . . 134. 5.8. User interface screenshot showing the planning view. Red, orange and yellow overlay denotes the likely areas infested by the pest species over 30 years with no management. Red has the highest probability of established pests at this point in time, orange has a moderate probability and yellow a low probability. . . . . . . . . . . . . . . . . . . . . . . . . . . . . . . . . . . 136. 5.9. The create new plan dialog. . . . . . . . . . . . . . . . . . . . . . . . . . . . 137. 5.10 User interface screenshot, showing the reporting view. The top graph shows the area requiring active management to achieve the colour coded objectives. The bottom graph shows the costs associated with each objective. . . . . . . . . . . . . . . . . . . . . . . . . . . . . . . . . . . . . . . . . . 138.
(20) 5.11 Timeline interface, showing three different management strategies. Note the price differences and distribution graphs. Left: No action scenario. Middle: Limited eradication and predominantly containment scenario. Right: Conducting eradication across all populations from the first year. . . . . . . . . . . . . . . . . . . . . . . . . . . . . . . . . . . . . . . . . . . . 140 5.12 Architecture diagram showing how the web service is built. . . . . . . . . 142 5.13 The first iteration of the prototype pest management planning tool. . . . . 148 5.14 Managed Suitability Generation Process . . . . . . . . . . . . . . . . . . . . 149 5.15 Left: Optimised dispersal model aggregate, after 30 years, showing the number of simulations colonising a planning unit. Right: Green and pink denote planning units varying by more than 5% overlayed onto the 100 run aggregate of the optimised dispersal model. Note: The output from the standard MigClim algorithm is not shown as it is visually identical to the optimised version. . . . . . . . . . . . . . . . . . . . . . . . . . . . . . . 153 5.16 Left: Optimised dispersal model (100 run) aggregate, after 30 years, showing the number of simulations colonising a planning unit. Right: Green and pink denote planning units varying by more than 5% overlayed onto the aggregate of the optimised dispersal model. Note: The output from the standard MigClim algorithm is not shown as it is visually identical to the optimised version. . . . . . . . . . . . . . . . . . . . . . . . 157 5.17 The improvement in run-time is visible from the user interface. Blue: data is exported from the database and imported into MigClim. Red: The model is running the 30 dispersal steps. Black/white: The model is exporting each dispersal step. Note: the optimised version starts exporting dispersal steps while the remainder of the model runs. . . . . . . . . . . . . . . . . . . . . 158 5.18 Graph showing the no-action management scenario to the currently defined management scenario. . . . . . . . . . . . . . . . . . . . . . . . . . 159 6.1. Diagram showing the order of research activities presented in this thesis. The blue highlight illustrates the current position in the thesis. . . . . . . . 164.
(21) 6.2. Example showing the eradication action (green polygon) the participant drew over the infected planning unit (black square).. 6.3. . . . . . . . . . . . . 167. Comparison of the rendering methods. Left, original rendering method. Right, new higher resolution rendering method. . . . . . . . . . . . . . . . 173. 6.4. Screenshot of the reporting tab showing the statistics generated from a model run. The colour codes for the graph are shown at the top. . . . . . . 174. 6.5. Select user dialogue, showing the quick selection for existing users. . . . . 175. 6.6. Comparison of the first and second version of the timeline for comparing multiple pest management strategies. Top: Original Timeline; Bottom: New Timeline View. Objectives, prices and graphs were more easily compared using the new design. . . . . . . . . . . . . . . . . . . . . . . . . 177. 6.7. Screenshot of the pest management tool showing the selection modal for management objectives. . . . . . . . . . . . . . . . . . . . . . . . . . . . . . 189. 6.8. Progress indicator showing that the model has currently been started. The run button (bottom right) also rotates while the model is active. . . . . . . 190. 6.9. The planning tab of Iteration Four, showing the relocated zoom buttons and the total cost metric. . . . . . . . . . . . . . . . . . . . . . . . . . . . . . 191. 6.10 Changes to the interface names on the primary navigation bar. Top: Iteration Four, with new icons and renamed buttons. Bottom: Iteration Three. 7.1. . . . . . . . . . . . . . . . . . . . . . . . . . . . . . . . . . . . . . . . 192. Diagram showing the order of research activities presented in this thesis. The blue highlight illustrates the current position in the thesis. . . . . . . . 215. 9.1. AAIGrid vs GeoTIFF total modelling time. The grey stripes represent each frame of the dispersal simulation being displayed in the user interface. . . 257.
(22) Chapter 1. Introduction The world is in the midst of an invasion. Invasive alien species are causing widespread damage to food production and the environment. Although not a stereotypical alien invasion, pest animals, plants and disease are expanding their range at an increasing rate. As the world becomes more connected by air, sea and road the potential for invasive pest dispersal increases and the threat posed intensifies. Pest species disrupt environmental systems and human activity incurring a huge cost to society along the way. The prevention of their spread and cost effective management of these species is paramount and presents a challenging problem for those tasked with the job. Pest management is a complex process involving numerous stakeholders including landowners and a large number of organisations, each with unique objectives and interests. Modelling and decision-making tools that target pest species management are already commonplace in the scientific community but often, the skills to use these technologies is lacking at the local land management level. Decision makers often have to rely solely on their own expertise and knowledge to make resourcing decisions. Existing and emerging interactive tools have the ability to change this and make scientifically validated decision support tools available to the everyday pest manager. Moreover, these new technologies have the potential to encourage collaboration of additional stakeholders. This research project develops a new type of collaborative and interactive pest management decision support tool. This tool is designed to assist planners in building robust pest management plans and targeting resources where they will be most effective. It allows management objectives to be drawn onto a map on a desktop computer,. 1.
(23) 1.1. THE INVADERS. touchscreen device, or large touch-sensitive table. The tool uses a modified version of the MigClim (Engler et al., 2012) dispersal model to simulate user defined pest management strategies 30 years into the future. The simulations are computed and presented as an interactive animation in combination with the estimated amount of work, management costs and infested hectares. Playback can be stopped at any point and the management strategy can be redefined from that time forward. This thesis describes the interaction design and development of an interactive visualisation tool applied to conduct pest management planning.. 1.1. The Invaders. The term invasive alien species, invasive species, or more commonly pests, are typically introduced plants and animals that cause damage to biodiversity, the environment, human health or the productivity of the land. “Invasive species” is often only used for species with a mechanism for dispersal that cause or have the potential to cause significant damage. They have been estimated to cost the Australian economy $13.7 billion annually through loss of agricultural productivity and environmental damage (Hoffmann and Broadhurst, 2016). Invasive plants, animals and disease are also considered to be the greatest biological threat currently facing global food production. Furthermore, anthropogenic changes to the climate and environment are enabling pest species to cover vast expanses of land rapidly. Effective management of invasive pests is urgently required to reduce the damage they cause to human activity and the environment. The prickly pear (Opuntia), first introduced to Australia in 1788, is a great example of the damage invasive species can cause. The invasion ultimately caused the abandonment of millions of hectares of farming land. The British hoped to use the newly formed Australian colony to farm Cochineal (Dactylopius coccus), an insect, used to make red dye for military uniforms, that survived off the prickly pear (Biosecurity Queensland, 2015). Cochineal was successfully cultivated on the introduced prickly pear that thrived in the dry conditions. During the 1840s the prickly pear began to spread from plantations. Mechanical control mechanisms and chemical control proved expensive and ineffective at preventing. 2.
(24) 1.1. THE INVADERS. its spread. Properties and farms over run by prickly pear often had to be abandoned. By 1900 it had infested 4 million hectares and by 1920, 24 million hectares (Freeman, 1992). The Cactoblastis (Cactoblastis cactorum) moth was identified in the 1920s as a potential control mechanism and introduced to the prickly pear sites (Dodd, 1936). By 1932 an estimated 7 million hectares of infested land had been reclaimed by the Cactoblastis moth and was used for new settlements. To date, the Cactoblastis moth has successfully suppressed the prickly pear populations to a fraction of its peak range. Although the management of prickly pear was highly effective, many invasive pests are not so easy to control. The cane toad (Rhinella marina) was introduced in 1935 as a control mechanism for the cane beetle (Dermolepida albohirtum). , the cane toad quickly spread out from the cane farms, thriving in Northern Australia. Having no natural predators its population exploded, causing significant damage to many ecosystems and native species (Shine, 2010). Management of the cane toad has proved almost impossible and they have continued increasing their range (Nyquist, 2016). There are many other examples of large scale pest management programs in Australia struggling, such as Siam (Chromolaena odorata) and Lantana (Lantana camara) (Heap, 2014; Bhagwat et al., 2012; Herron et al., 2001). These pests are managed at a variety of levels (see Figure 1.1), from federal organisations running national eradication programs, through to state organisations, local councils and individual landowners. Each level holds a stake in the pest management process. These stakeholders have responsibilities to manage particular types of pests. For instance, landowners are required to keep their properties free of declared pest species while organisations like Biosecurity Queensland are tasked with averting emerging threats across the state. Farmers must control pests on their properties to ensure their farms remain productive and their crops have adequate drainage. The funding available to pest managers is substantially lower than what is needed to manage pests in Australia, making resource prioritisation essential. Decisions regarding the targeting of pest management resources are often made without a full understanding of the relevant invasive pest. However, collecting data on the current range of pest species is a difficult and expensive process, involving crews and often helicopters to survey remote and hard to access locations. Furthermore uncooperative or uninformed 3.
(25) 1.1. THE INVADERS. BioSecurity Australia. National BioSecurity Queensland. State. QLD Parks and Wildlife Service FNQROC. Regional. Terrain NRM Local council. Local. Industry Representative Groups Catchment Management Groups. Neighbourhood. Landcare Farmers. Site. Landholders. Figure 1.1: Layers of pest managers, stakeholders and organisations in Far North Queensland. Based on Peterson et al. (2007).. landholders may not adequately manage or report pest species on their properties. These factors make pest management challenging. Current management approaches attempt to engage large groups of stakeholders to assist in managing species. Determining the possible future range of a pest and potential for it to hinder agricultural activities and damage the environment is important when prioritising the allocation of resources. Understanding the future of an invasive pest in the environment can help to plan early targeting where it will be most effective. Several tools are already used for uncovering the future potential range of each species: Maxent (Phillips and Dudík, 2008) - for determining species distributions; MigClim (Engler et al., 2012) and SDMtoolbox (Brown, 2014) - for modelling future ranges; and Circuitscape (Shah and McRae, 2008) - for understanding species population connectivity. However, these tools are difficult to use and are not designed for stakeholders who are not research scientists. 4.
(26) 1.2. INTERACTIVE TECHNOLOGIES. with expertise in ecological modelling. Stakeholders without access to these tools will often resort to making resources allocation decisions based on their intuition or more simplistic analyses. Providing these tools to stakeholders could enable more informed decisions to be made about the allocation of these resources. However, newer, more user-friendly tools must be designed that allow use by the non-expert to support their decision-making process.. 1.2. Interactive Technologies. Many existing, and emerging technologies are changing the way scientists, citizens and decision makers go about solving problems. Personal smart-phones and computers have increased in abundance over the past decade, and high-speed internet provides easy access to information and rich interactive multimedia. Collaborative touch surfaces, such as the Diamond Touch (Dietz and Leigh, 2003), have been around since the early 2000s, allowing multiple users to interact with a large single device. Advances in emerging technology such as Augmented Reality (AR) and Virtual Reality (VR) is also bringing a lot of promise and providing new ways for people to interact with computers. Touch-sensitive table tops have started to become common in libraries, museums, galleries (Geller, 2006) and conference rooms. They are essentially larger versions of touchscreen tablets, allowing multiple users to gather around them and collaborate on projects (refer to Figure 1.2). The larger display size of these devices also allows for a greater amount of detail to be presented and for more precise input when compared to a smaller device. Touch-tables deployed into these public environments often have few instructions or support, leaving people to work out how to operate them themselves. Interfaces must be developed to mimic natural processes and be intuitive and easy to learn. These types of large touch screens have also been used in professional planning settings, for encouraging collaboration, expressing ideas and communicating ideas (Arciniegas and Janssen, 2012). AR and VR headsets offer the potential for immersing people into 3D worlds and have been used for assisting in problem solving tasks. AR applications have already shown their utility in education scenarios (Carmigniani et al., 2011), medical processes. 5.
(27) 1.3. A COLLABORATIVE TOOL FOR ENGAGEMENT AROUND MANAGEMENT DECISIONS. Figure 1.2: Interactive Touch Table at the National Arboretum, Canberra Australia. Users can select locations on the map to view additional information and rich media.. (Marescaux et al., 2004; Kang et al., 2014) and completing complex tasks (Savioja et al., 2007; Henderson and Feiner, 2009). AR works by supplementing the real world with additional information, allowing users to see through objects (Mathiesen et al., 2012), or providing navigation directions from the users current perspective (Reitmayr and Schmalstieg, 2004). VR allows users to immerse themselves in virtual worlds, experiencing it from a perspective previously not achievable. Both AR and VR offer huge potential for educational purposes and specifically with explaining complex concepts. However, using these systems typically requires expensive hardware that becomes more costly as more participants are added.. 1.3. A Collaborative Tool for Engagement Around Management Decisions. Interactive and immersive interfaces applied to decision-making in pest management have the potential to improve the communication and engagement with and between the general public and decision makers. Teaching using interactive technology has been 6.
(28) 1.4. RESEARCH OVERVIEW. shown to increase cognitive engagement compared to traditional teaching methods (Vogel et al., 2006). With the availability of low-cost computers and high-speed internet, interactive visualisations can be distributed to a large portion of the population very easily. The application of conservation planning to interactive visualisations could create a large population of citizen scientists learning by practice and adding value by feeding new data into the pest management planning process. The merging of conventional pest management decision support tools with interactive user interfaces could enable a more accessible and open planning process. Improving the “public image” of pest management by involving and educating stakeholders is crucial to developing long term sustainable plans (Richards et al., 2004; Reed, 2008). By making the pest management planning process more interactive and open the opportunity for the general public to be engaged and feedback new information is greatly improved. The increased involvement of the public will also improve trust between ecologists, stakeholders and the public at large. There are, however, several gaps in the knowledge base required for implementing a pest management planning tool. A number of models and decision support tools are available to help planners build spatial management strategies. However, these tools often require specialised training and domain knowledge. Even fewer tools support collaboration between stakeholders making spatial decisions. There are only a few known projects that have explored collaborative pest management planning (Pert et al., 2013; Pressey et al., 1995; Pressey, 1998). Developing new tools requires a more detailed understanding of the areas interactive tools can be applied to and the requirements of decision makers.. 1.4 1.4.1. Research Overview Research Aims. This project aimed to develop a collaborative and interactive tool that supports pest managers in making decisions involving the targeting of resources. An analysis of the pest management process was conducted, which focussed on the collection of distribution. 7.
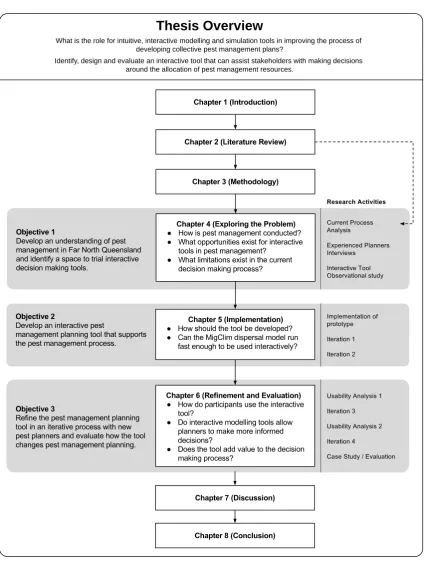
(29) 1.4. RESEARCH OVERVIEW. data, data analysis and targeting of resources to identify the specific areas new interactive tools could assist. A tool was developed that integrates the existing data collected by organisations involved in pest management with the aim of supporting the decisionmaking process. The user experience was designed in a manner which could minimise the training required and integrate it into the existing planning processes. The benefits and limitations of this type of tool were assessed using the prototype developed here in a close to real world scenario with pest managers.. The research question this thesis explored can thus be stated as: What is the role for intuitive, interactive modelling and simulation tools in improving the process of developing collective pest management plans?. This hypothesis can be further broken down into the following research objectives: • To investigate the needs of land holders, management staff and operational staff in order to design pragmatic invasive species management plans. These findings would allow the effective design of a workflow for the invasive species management platform to best address the research question. • To investigate methods for capturing and evaluating local knowledge from stakeholders in an intuitive manner. • To design and develop a software framework that can be re-used for more general land management problems. • To investigate the impact of simplifying the scientific modelling process on users with different backgrounds from land owners to decision makers to researchers. • To investigate the changes to the process of pest management workshops when real-time modelling is introduced into the decision-making process.. 1.4.2. Research Contributions. This research presents a new and novel tool to support pest managers in their decisionmaking process. The methodology, tools and findings from the studies conducted under 8.
(30) 1.4. RESEARCH OVERVIEW. this project could be used beyond the scope of pest management. Further, this research also presents insights into the process of training users in the utilisation of new interactive tools and minimising learning time. Other types of spatial land management decision making, such as disaster planning or environmental reserve design present similar problems to pest management. In reserve design, planners must balance the optimal plan from a model with the complex social and economic issues concerning the communities they affect. Furthermore, the planner and community both need to be involved in the process to achieve long term success. Interactive, easy to use planning tools, like the one developed in this project, have the potential to engage the community in more of the process. Conventional models appear to be black boxes to non-experts so making them easier to use could bolster community engagement. The methodology, findings and design of the software from this research project are already being used to develop a new generation of interactive pest management tools.. 1.4.3. Constraints and Assumptions. This research looked at the design of an easy to use interactive decision support tool for pest management planning. Although literature and expertise was be drawn from a broad area, the project focussed on pest management in the Far North Queensland region. There are several constraints and assumptions that were considered: • Pest management is conducted over large areas and not centrally managed, as such the research needs to be conducted over a small area to ensure adequate detail in pest management planning is incorporated. • This research makes the assumption that although species may differ the fundamental issues and inefficiencies facing each region are common across Australia. • Different regions collaborate and share their processes and some of the larger government organisations work across multiple regions. This research assumes that their techniques are consistent across their organisations.. 9.
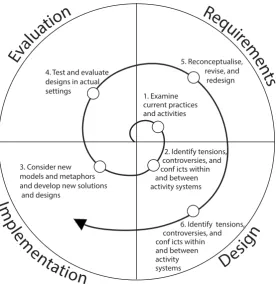
(31) 1.4. RESEARCH OVERVIEW • The smaller landholders (farmers, and ’lifestyle’ property owners) were contacted to take part in the study, but none were available to participate. Although a significant group of lanholders aren’t included, the larger stakeholders involved in the study generally have more influence over weed networks. This research is therfore focussed (but not exclusively) on the stakeholders that can have the most impact.. 1.4.4. Personal Pronoun. Traditionally personal pronouns were not considered acceptable in academic writing. However modern researchers have begun using them in Information Technology, Computer Science and Human-Computer Interaction (HCI). This thesis uses Activity Theory to ground the exploration of the user needs and the practice of pest management planning. Software design is not an entirely objective process and relies on the expertise, knowledge and observations of the practitioner undertaking it. In this thesis my thought process and journey is an essential part of the methodology and should not be diluted. I used the personal pronoun “I” to clearly distinguish my thoughts and observations from objective findings.. 1.4.5. Research Approach. This research project used an Activity-Centred Design (ACD) process to understand contradictions and shortcomings in current pest management planning methods, to design and develop a prototype interactive tool, and to compare the tool to the existing process.. Developing an Understanding of the Problem At the commencement of this research I began attending public pest management forums and working groups and also reading local pest management plans and weed strategies, to develop a practical understanding of the problems experienced in pest management. I modelled my understanding of the pest management process using the ActivityOriented Design Methodology (AODM) as an Activity System. AODM facilitated the. 10.
(32) 1.4. RESEARCH OVERVIEW. identification of contradictions in the current pest planning process and gaps in my knowledge. A series of research questions were developed to assist in building a more complete understanding of the relationships between different stakeholders in the pest management process.. Engaging with Pest Managers, Operators and Community Groups To answer these research questions a series of qualitative interviews with six people, from Far North Queensland, experienced in the pest management process were conducted, each from different organisations and representative groups. Participants were asked about their experiences in the pest management process including limitations, successes, collaboration and community engagement. The interview transcripts were analysed using thematic analysis (Boyatzis, 1998) to group related concepts and identify problems that existed across the different levels of management. The findings identified that prioritisation and collaboration amongst different stakeholders were the areas with the most potential for improvement with interactive technology.. Understanding the Influence of Interactive Tools An observational study was conducted with experts using a table-mounted touch screen projector. The researcher observed participants learning to use the interactive tool to gain an understanding of the learning process that participants go through when first using these types of interactive tools. The findings of these studies were summarised and presented as a set of user requirements for the development of the tool in Chapter 4.. Implementing a Tool An implementation of the decision support tool was developed around the MigClim dispersal simulation model. The collaborative tool was developed using Python as a webbased application targeted at large table-mounted touch screen displays. MigClim was optimised to reduce the wait time and modified to use management objectives familiar to the planners from the previous interviews.. 11.
(33) 1.4. RESEARCH OVERVIEW. Iterative Development with Usability Analysis An iterative process through five iterations was used to refine the tool. Two usability analysis sessions were held with participants that were unfamiliar with the pest management process. Findings from these were used to shape the development of the pest management tool.. Evaluation with Pest Managers An evaluation with experienced pest planners was conducted that asked them to develop a plan around a quasi-real species. At the conclusion of the scenario, participants were involved in a focus group and guided through a discussion around the value of the pest management tool. An analysis of this session with the focus group was conducted to answer the research question and objectives.. 1.4.6. Thesis Structure. This thesis is laid out in a chronological order with discussion and summaries integrated into the end of each research component. Each chapter develops its work into a conclusion which is used in the following chapter. Figure 1.3 gives a pictorial representation of the thesis structure. A general discussion of the findings and conclusions are provided at the end of the thesis. Chapter 2 contains the literature review exploring the current pest management process, interactive tools, community engagement and decision support tools. Chapter 3 details the methodology used throughout this research projects. Chapter 4 explores the pest management process, using ACD, AODM, qualitative interviews and an observational study. Chapter 5 describes the implementation of the decision support tool from the finding in the previous chapter. An iterative process was used to refine the pest management tool and an evaluation of the tool is described in Chapter 6. A summary of findings and discussion of the implications of this research is provided in Chapter 7. The future work that was identified and a thesis conclusion are provided in Chapter 8.. 12.
(34) 1.4. RESEARCH OVERVIEW. Thesis Overview What is the role for intuitive, interactive modelling and simulation tools in improving the process of developing collective pest management plans? Identify, design and evaluate an interactive tool that can assist stakeholders with making decisions around the allocation of pest management resources.. Figure 1.3: Overview of the thesis structure. 13.
(35) 1.4. RESEARCH OVERVIEW. This chapter concludes by restating the research question explored in this thesis. Research Question What is the role for intuitive, interactive modelling and simulation tools in improving the process of developing collective pest management plans?. 14.
(36) Chapter 2. Literature Review Chapter Overview This chapter explores the current literature on pest management and decision-making tools. The chapter begins by establishing the broader context and reasons for pest management and explores a number of pest management techniques that emerged in the 19th and 20th centuries and shaped contemporary pest management methodologies. An overview is provided of the tools and techniques used in modern pest management and followed by a review of interactive technology and decision support tools. The emerging themes from the two reviews are combined to create a new concept for pest management. From the research gap identified in this literature, the research question addressed in this thesis is elucidated. A review of the methods and techniques used to conduct this research is provided in the Methodology (Chapter 3).. 15.
(37) Thesis Overview What is the role for intuitive, interactive modelling and simulation tools in improving the process of developing collective pest management plans? Identify, design and evaluate an interactive tool that can assist stakeholders with making decisions around the allocation of pest management resources.. Figure 2.1: Diagram showing the order of research activities presented in this thesis. The blue highlight illustrates the current position in the thesis.. 16.
(38) 2.1. INTRODUCTION. 2.1. Introduction. The incursion of new foreign species is a constantly increasing threat globally, and finding ways to manage these invaders is a growing problem (Leung et al., 2002; Mack and Simberloff, 2000; Pimentel et al., 2005). The management of the natural resource assets across a wide region is a complex and challenging task involving large numbers of stakeholders and decision makers, often with competing interests. Engaging all parties across a region to achieve the best possible optimisation of both stakeholder interests and conservation outcomes is a complex and time-consuming task. The volume of data and information available can often exceed the capacity of an individual stakeholder to effectively comprehend the extent of the problem let alone appreciate the perspectives of all stakeholders. This review explores the existing management and planning techniques and investigates the application of emerging technologies and tools used in other fields to improve the effectiveness of the planning process. Specific focus is given to the current generation of readily available and affordable (consumer grade) technologies that have limited deployment costs. New technology could help in a number of ways: to compile wider bodies of user knowledge, engage the public, build more cost-effective management strategies, and help to further inform the decision-making process. The ultimate goal of applying these technologies is to produce management strategies with land managers, industry, farmers and the local community that are based on well-reasoned information.. 2.2. Terminology. Invasive species are typically non-native animal or plant species that have been introduced from elsewhere and pose some threat to the biodiversity or natural assets of a region. The term invasive species is fairly general and is sometimes used with multiple meanings in the literature. Additional terms, such as feral animals, pests and invasive alien species are often used to highlight specific characteristics of the species. These terms are described below. Invasive refers to the ability of a species to increase its range or over-run its existing range.. 17.
(39) 2.3. THE PEST MANAGEMENT PROBLEM. Often invasive species have no natural predators or competition to control their population numbers and thus limit their dispersal. Pest in the dictionary refers to an annoying thing or a nuisance. In environmental science, pest refers to a species that can cause damage to environmental systems or disrupt human activity. Pests are often invasive and have high reproductive rates, making them difficult to control with conventional methods. Feral refers to animals that have previously been used for domestic purposes or working purposes. The Cane Toad (Rhinella marina) is an excellent example of a feral species. Originally introduced in 1935 to control the Cane beetle (Dermolepida albohirtum), the Cane Toad has become a feral pest causing widespread damage to native species and is rapidly spreading across Northern Australia. For this thesis, the term “pest” is used to refer to invasive species that impact ecosystems, biodiversity and human activity and are typically difficult to control. Although the focus of the planning tool developed in this thesis is on pest weeds, the findings can easily be applied to the management of pest animals.. 2.3. The Pest Management Problem. Advances in transportation over the past century have connected cities and countries on a scale never previously achievable. Faster and more affordable travel in cars, trains, boats and planes have opened new markets and economic opportunities across the globe. Along with this expansion came an increased rate of dispersal of invasive alien species within countries and across the world (Westphal et al., 2008; McNeely, 2001). Efforts by the agencies tasked with protecting borders are often overwhelmed by the continuous and increasing stream of goods entering countries. Invasive alien species inevitably slip through border protections, some with the potential to cause widespread damage to local ecosystems, biodiversity and human activities. When invasive pests break through quarantine mechanisms and establish themselves in the environment, they can cause significant damage to flora, fauna, agricultural activities, forestry and waterways (Clavero and García-Berthou, 2005). While some pests 18.
(40) 2.3. THE PEST MANAGEMENT PROBLEM. may only cause harm to a small segment of the biota making up an ecosystem, their impact can cause a ripple effect to the rest of the ecosystem and in some cases cause major disruptions and potential ecosystem collapse. Ecosystems are dynamic organisations, and small changes can have far-reaching consequences such as potentially pushing endangered native species to extinction or causing damage to entire assemblages of plant species within forests. Problem pests can also complicate agricultural activities across entire regions. Therefore, in order to protect native ecosystems from damage, it is vital that Natural Resource Management (NRM) and land management groups control invasive pests. Managing these pests is a difficult task. In the introductory chapter, Prickly Pear (Opuntia sp.) was described as a fairly well known example of a damaging invasive species. Although Prickly Pear is successfully managed today, at its peak it had infested around 24 million hectares (Freeman, 1992). Early control mechanisms, such as physical removal and burning techniques were ineffective due to the deep root structure of the plant which would simply regrow from the remaining roots. Chemical control using arsenic pentoxide was effective but was highly toxic and expensive to use (Biosecurity Queensland, 2015). The high cost and difficulty in management caused many landowners to simply abandon their property and move elsewhere. In the early 1930s a biological control was trialled and the Cactoblastis Moth (Cactoblastis cactorum), whose larvae feed on the leaves of the pear, was introduced to Australia and rapidly reclaimed the lost land. Today, management strategies, quarantine and treatment methods have improved substantially. Highly threatening pest species are often recognised before they are introduced into Australia and quarantine strategies adapt to help prevent their naturalisation. Although these strategies have improved, Australia’s ecosystems and agricultural industry are still threatened by pests that manage to slip through the quarantines. A timely example of an emerging threat is the Panama disease (race 4), a highly threatening disease which could cause significant damage to the banana industry in Australia. Much like the early days of Prickly Pear, there is currently no highly effective control mechanism for areas infected with the disease. An infected property would likely need to be abandoned and quarantined to prevent the further spread of the disease. Invasive plants, animals and disease cause substantial disruption to farming activities 19.
(41) 2.3. THE PEST MANAGEMENT PROBLEM. and environmental systems. Sinden et al. (2004) conducted an analysis of the cost of pest weeds on productive agricultural land. The study found in the 2001-2002 financial year pest weeds had an economic impact in excess of $4bn on the Australian economy. An estimated $1.3-1.5bn was spent on management of weeds and a further $2.2bn in lost agricultural productivity. A more recent study conducted by Hoffmann and Broadhurst (2016) expanded on the findings of Sinden et al., calculating the economic costs for all pests in 2011-2012. Hoffmann and Broadhurst found that Australia collectively spends an estimated $3.7bn annually on management activities with an additional economic loss in excess of $9.83bn. The total combined annual cost to the Australian economy was $13.7bn. Both Sinden et al. and Hoffmann and Broadhurst conceded that their estimates only incorporated data that was available at the time and that the true cost was likely to be much greater. In Australia, there are an estimated 3207 introduced plant species that have been naturalised (Invasive Plants and Animals Committee, 2016). About 500 of these weeds have been declared as noxious and are managed through a variety of levels of governance. The number and range of these species makes eradication and management extremely tough. Management programs range from those undertaken by an individual landholder managing pests on their property to national programs targeting specific pest species across the entire country.. 2.3.1. Integrated Pest Management. Ideally, we would eradicate all of the invasive plants, animals and diseases from Australia. However, in most cases, widespread eradication is just not possible. Pests have high reproductive rates and can quickly reinfest areas they had already been removed from. Successful eradication requires management activities to be implemented faster than the pest can increase its range. Even after the successful elimination of plants from an area, seeds from the plants may be viable for extended periods of time. For example, seeds from Miconia (Miconia calvescens) have been observed germinating after five years of dormancy (Csurhes, 1997) and Branched Boomrape (Orobanche ramosa L.) after 12 years (Biosecurity Queensland, 2003). The long viability of some seeds means eradication requires a sustained effort, 20.
(42) 2.3. THE PEST MANAGEMENT PROBLEM. revisiting and confirming the absence of mature plants, until no viable seeds could possibly remain. Each mature plant that is found in that period would require the viability period to be restarted. Eradication is a long and complex process and is an insurmountable challenge to tackle all pest species simultaneously. Although we cannot simply eradicate all of the invasive pests in Australia, we can use a systematic methodology to reduce their impact on agriculture and the environment. This systematic approach is often known as Integrated Pest Management (IPM). Unlike conventional control methods, IPM focusses on the whole system of pest management, ensuring control is undertaken in a sustainable manner (Flint and van den Bosch, 2012). Control mechanisms are targeted to reduce the costs and to ensure the sustainability of managing the species. Pesticides are used in a manner that limits their harm to unintended targets and ensures usage is effectively timed. Similarly, high priority species are treated first, to ensure the impact of those invasive pests are minimised. The initial concepts of IPM emerged from the struggles with pesticide resistance of pests in the early 1900s (Hoskins et al., 1939). Hoskins et al. recounted the failures of many imported parasites and predators to control their host pests causing a return to chemical control mechanisms. Over the following 30 years, a number of pests developed resistance to those chemicals. Hoskins et al. reported on other trials in the 1930s that attempted to target pest control mechanisms based on predictions of weather and solar cycles. These IPM control methods were intended to pay careful consideration to the impact chemicals had on their surrounding ecosystems. The seminal paper by Michelbacher and Bacon (1952) described the need for control mechanisms to take into account the entire entomological lifecycle and food web. They described that the timing and dosage control of their treatments against Codling Moth (Cydia pomonella) was a large part of their success in managing the pest. Bartlett (1956) highlighted the benefits that integrated control could provide in retaining natural predators while still managing pest insects on crops. This integrated control approach selectively targeted the chemical applications to work alongside natural predators of pests. While the phrase “Integrated control” first appeared in Michelbacher and Bacon’s paper from 1952, it is difficult to determine when it became commonly used by practitioners, as it did not start appearing in the literature until the late 1950s (Stern 21.
(43) 2.3. THE PEST MANAGEMENT PROBLEM. et al., 1959; Smith and Hagen, 1959; Getzin, 1960). These wholistic integrated control methods grew in popularity over the following years as more examples of their success were published in the literature (Getzin, 1960; Van Den Bosch and Stern, 1962; Rabb, 1962; Smith, 1978). The term “Integrated Pest Management” was not coined until 30 years after the initial concepts of integrated control had been introduced. Although it is unknown who coined the term, it is attributed to being popularised in a presidential address by President Richard Nixon to the US Congress in the 1970s (Kogan, 1998). There is currently no concrete definition of IPM in the literature as emerging concerns have brought more attention to pesticide residues left on food and debates still continue as to the extent of IPM (Baker et al., 2002; Orr, 2003). However, there is consensus that IPM is undertaken in an informed and integrated whole of landscape approach to minimise harm both economically and to surrounding ecosystems (Kogan, 1998; Orr, 2003). Management methods are crafted in a sustainable manner to ensure the control mechanisms do not promote pesticide resistance. Modern IPM has incorporated the need to reduce damaging agricultural run-off and pesticide residues left on food crops. The management methods used under an IPM strategy generally evolve over time. Long term goals are established, but goals vary to adjust for seasonal variation, weather and the engagement of stakeholders. Generally, IPM approaches require the collection of a significant amount of data to make effective management decisions (Ehi-Eromosele et al., 2013). Selective targeting requires knowledge of existing populations of a pest species and collection of this data is often an intensive process requiring staff to explore remote and difficult to access areas to confirm the absence of a pest. Search operations are conducted in an informed manner, using modelling and buffers around known populations to help reduce the search area. The selective treatment of pests in an IPM approach can contribute to reducing costs, collateral damage and ensure the sustainability of control mechanisms. A focus on early intervention and eradication of emerging pest species is essential to effective pest management. Managing pests before they establish large populations can reduce their damage and associated management costs. As pest plants increase in both range or density, their potential for dispersal increases. Populations of emerging infesta22.
(44) 2.3. THE PEST MANAGEMENT PROBLEM. tions typically follow an exponential curve as the plants multiply. Early intervention programs using IPM can help avert future impacts from specific highly threatening species. An example of this is the Four Tropical Weeds program run by Biosecurity Queensland (Erbacher et al., 2008) which targets five weeds occurring in North Queensland. Managing existing and established weed populations is also an important part of pest management. An example of a program managing significant species is the federal management program called Weeds of National Significance (WoNS) (Hennecke, 2012). The WoNS program was established to focus on managing weeds with the highest potential to cause damage. Naturalised plants were prioritised based on their potential for spread, environmental and social impacts, and their ability to be managed. The 32 highest priority weeds were listed as Weeds of National Significance and strategic plans have been prepared for each species to coordinate management at all levels of government. All landholders, including residential and NRM groups, are required to manage these registered weeds on their properties.. 2.3.2. Areawide Pest Management. Areawide Pest Management (AWPM) is an approach that has emerged and developed since the 1800s (Klassen, 2005). The approach of the AWPM’s is the coordinated management of pests over a large area as opposed to management at the property level (Knipling, 1980). To be effective, this approach often requires the cooperation of large groups of stakeholders and landholders. AWPM was formulated into a methodology by Knipling and Rohwer and proposed to the North American Plant Protection Organisation (as described by Kogan, 1998). Their approach focussed on IPM over large areas seeking to suppress pest species to a manageable level (Knipling, 1980). Their argument was structured around four key criteria: 1. Planning should be conducted over a large spatial extent. 2. The program should be coordinated by organisations that represent all interests. 3. Priorities should be established to selectively maintain the most significant pests at acceptable densities.. 23.
(45) 2.4. CONTEMPORARY PEST MANAGEMENT. 4. Some management activities should be required of participants in the region. The AWPM approach is often used when the sole effort of individual landholders is not adequate to manage or eradicate a pest species (Klassen, 2005). These principles of AWPM have been successfully applied in large-scale programs over the years and have been extensively reviewed in the literature by Chandler and Faust (1998). Some of the successful programs using AWPM include the eradication of Cattle ticks (Boophilus annulatus) and Screwworm (Cochliomyia hominivorax) from the USA, the successful eradication of fruit flies in a number of countries, and successful trials against Ae. aegypti mosquito in various countries. A cooperative program between the federal and state government beginning in 1906 was run to eradicate the cattle ticks in the USA. The program worked in cooperation with cattle owners aiming to eradicate the ticks across the country. A cattle dipping program was conducted across fifteen states to treat the ticks, and by the 1950s the cattle ticks had been eradicated from the majority of the USA (Allen, 2008). One of the major eradication successes of the AWPM has been the introduction of sterile males of a species released into the pest population. Knipling first proposed the use of sterile males to control the populations of Screwworm in 1937 (Lindquist, 1955). The program used radiation to sterilise the male Screwworm in an attempt to reduce the viability of the Screwworm populations. These sterilised males would compete with the wild males to mate with females but would be incapable of producing offspring. After the release of the sterilised males, infestations of Screwworm quickly declined before being declared eradicated (Knipling, 1980). Although the approach of using sterilised males did not require large-scale co-operation of property owners as did the cattle dipping program, it was beneficial to the entire US livestock industry.. 2.4. Contemporary Pest Management. The evolution of pest management from a simple method of chemical control to an IPM strategy has driven the need to engage large groups of stakeholders in the management process. Pest species are not constrained by property boundaries or land ownership. Unmanaged pests on a property often become the problem of their neighbours over a 24.
Figure

+7


Related documents