A western boundary current eddy characterisation study
Joachim Ribbe, Daniel Brieva
PII: S0272-7714(16)30533-9 DOI: 10.1016/j.ecss.2016.10.036 Reference: YECSS 5295
To appear in: Estuarine, Coastal and Shelf Science
Received Date: 27 May 2016 Revised Date: 25 October 2016 Accepted Date: 26 October 2016
Please cite this article as: Ribbe, J., Brieva, D., A western boundary current eddy characterisation study,
Estuarine, Coastal and Shelf Science (2016), doi: 10.1016/j.ecss.2016.10.036.
M
AN
US
CR
IP
T
AC
CE
PT
ED
1 1
2
A Western Boundary Current Eddy Characterisation Study
3
4
5
by
6
7
8
9
Joachim Ribbe and Daniel Brieva
10
11
International Centre for Applied Climate Sciences (ICACS), University of Southern Queensland, 12
Toowoomba 4350 Queensland, Australia 13
14
15
16
Corresponding author: [email protected]
17
18
19
20
Manuscript for Estuarine Coastal Shelf Science
21
22
October 25, 2016
23
24
M
AN
US
CR
IP
T
AC
CE
PT
ED
2 26
27
Key Points:
28
29
• 497 short-lived eddies detected in a coastal corridor off eastern Australia.
30
31
• About 23 individual short-lived eddies traced per year.
32
33
• 43% of cyclonic eddies (4-5 per year) found off southeast Queensland.
34
35
• Cyclonic eddies displaced shelf water by about 110-120 km.
36
37
• Cyclonic eddies postulated to establish quasi-permanent northward flow.
38
M
AN
US
CR
IP
T
AC
CE
PT
ED
3
Abstract
40
41
The analysis of an eddy census for the East Australian Current (EAC) region yielded a
42
total of 497 individual short-lived (7-28 days) cyclonic and anticyclonic eddies for the
43
period 1993 to 2015. This was an average of about 23 eddies per year. 41% of the
44
tracked individual cyclonic and anticyclonic eddies were detected off southeast
45
Queensland between about 25 oS and 29 oS. This is the region where the flow of the
46
EAC intensifies forming a swift western boundary current that impinges near Fraser
47
Island on the continental shelf. This zone was also identified as having a maximum in
48
detected short-lived cyclonic eddies. A total of 94 (43%) individual cyclonic eddies or
49
about 4-5 per year were tracked in this region. The census found that these potentially
50
displaced entrained water by about 115 km with an average displacement speed of
51
about 4 km per day. Cyclonic eddies were likely to contribute to establishing an
on-52
shelf longshore northerly flow forming the western branch of the Fraser Island Gyre
53
and possibly presented an important cross-shelf transport process in the life cycle of
54
temperate fish species of the EAC domain. In-situ observations near western
55
boundary currents previously documented the entrainment, off-shelf transport and
56
export of near shore water, nutrients, sediments, fish larvae and the renewal of inner
57
shelf water due to short-lived eddies. This study found that these cyclonic eddies
58
potentially play an important off-shelf transport process off the central east Australian
59
coast.
60
61
62
Keywords: Western boundary currents; fisheries; eddies; transport; shelf dynamics; 63
East Australian Current.
M
AN
US
CR
IP
T
AC
CE
PT
ED
4 1. Introduction
65
66
In-situ observations from Western Boundary Current (WBC) regions indicate that
67
cyclonic eddies (CEs) are important for fisheries (Kasai et al. 2002, Govoni et al.
68
2009, Suthers et al. 2011, Matis et al. 2014, Mullaney et al. 2014, and Everett et al.
69
2015). Forming on the near-coast side of WBC regions, CEs become enriched in fish
70
larvae and primary productivity stimulating nutrients due to the entrainment of near-
71
shore coastal water. The East Australian Current (EAC) CEs observed to the south of
72
the EAC intensification zone (Ridgway and Dunn 2003) where found to be usually
73
short-lived (2-4 weeks). The eddies were more frequent and of smaller scale than
74
anticyclonic eddies (ACEs) and ranged in size from about 10 km to 100 km
75
(Mullaney and Suthers 2013; Everett et al. 2015). Observed CEs propagated close to
76
the coastal zone, often generated a near-shore northward flow (e.g. Huyer et al. 1988,
77
Roughen et al. 2011, Everett et al. 2011) and were located at the coastal side of the
78
EAC. CEs were also usually cold-core eddies, i.e. characterised by a negative sea
79
surface temperature anomaly (SSTa), and Chlorophyll-a (Chl-a) concentrations were
80
about twice than those observed for ACEs (e.g. Govoni et al., 2009, Suthers et al.
81
2011, Everett et al. 2011, Everett et al. 2014, Mullaney et al. 2014, Everett et al.
82
2015). Studies of EAC CEs are few and limited to the southern regions of the EAC
83
(e.g. Oke and Griffin 2010; Macdonald et al. 2016), which is referred to as the EAC
84
separation zone (Ridgway and Dunn 2003). This study aimed to provide a census for
85
short-lived eddies (7-28 days) along the east Australian coast with a particular focus
86
on CE off the coast of southeast Queensland. This region is part of the EAC
87
intensification region (Figure 1).
88
M
AN
US
CR
IP
T
AC
CE
PT
ED
5
Everett et al. (2012) and Pilo et al. (2015) performed the only two eddy
90
characterisation studies of long-lived eddies (>28 days) for the EAC. Both studies
91
utilised data from the same global eddy census conducted by Chelton et al. (2011).
92
Pilo et al. (2015) compared the eddy statistics for three WBC regions, i.e. the Agulhas
93
Current, the Brazil Current and the EAC region. The study expanded on Everett et
94
al.’s (2012) analysis by estimating also average lifetime, propagation speed and
95
distance travelled. A census of short-lived CEs (7-28 days) propagating within close
96
proximity to the shelf, which appear to be more important for primary productivity
97
and fisheries due to the entrainment of near coast shelf water, recruitment and
98
retention is lacking for the EAC and other WBCs (Mullaney and Suthers 2013). The
99
analysis presented in this paper aimed to expand on these previous studies (Everett et
100
al. 2012, Pilo et al. 2015). Its focus was on the analysis of eddy characteristics
101
detected in a coastal corridor of about 100 km width, i.e. eddies that were wedged
102
between the coast line and the EAC. We quantified the occurrences of short-lived
103
cyclonic eddies important to fisheries and provided the first assessment of the role of
104
these eddies for the coastal ocean off southeast Queensland.
105
106
The east Australian continental shelf is at its widest (80-90 km) off the coast of
107
southeast Queensland between about 25-27 oS and to the south of Fraser Island
108
(Figure 1). The EAC forms to the north of this region from the South Equatorial
109
Current and Coral Sea outflows. It intensifies forming a swift, albeit seasonally
110
varying in strength, southward flowing current hugging the continental shelf
111
(Ridgway and Dunn, 2003). A prominent oceanographic feature of the region is the
112
EAC-driven Southeast Fraser Upwelling System (Brieva et al. 2015).
113
M
AN
US
CR
IP
T
AC
CE
PT
ED
6 115
116
Figure 1: Location of the study site along the east coast of Australia. The boundaries
117
(white lines) between Zone 1 (Z1) and Zone 2 (Z2) at about 29o S and Z2
118
and Zone 3 (Z3) at about 33o S were identified in this study from minima
119
in eddy activity. Approximate mean path of the East Australian Current
120
(EAC) is shown in light grey. Eddies were tracked over the whole region.
121
An eddy census was conducted and the analysis limited to two coastal
122
corridors of 100 km and 600 km width each (dash lines).
123
124
125
Ward et al. (2003) and Mullaney et al. (2014) speculated that the northern sub-tropical
126
shelf waters (~25-27 oS) of the EAC intensification zone supply larvae of temperate
127
fish species that are transported southward with the EAC. These return at a later stage
M
AN
US
CR
IP
T
AC
CE
PT
ED
7
in their lifecycle to spawn again during early winter. Gruber et al. (2011) find that
129
eddy induced transports appeared to be close to a maximum within a near-shore 100
130
km wide zone. Mullaney and Suthers (2013) argued for the importance of these
near-131
coast short-lived eddies for fisheries. The eddies were also found to be associated with
132
the northward countercurrent and entrainment of coastal waters (Huyer et al. 1988,
133
Mullaney and Suthers 2013). Thus, the analysis presented in this study was focused
134
on eddies and their characteristics identified for a narrow 100 km wide coastal
135
corridor (Figure 1). The characteristics were obtained from a new eddy census for the
136
southwestern Pacific Ocean using the Halo et al. (2014) eddy detection method. It led
137
to the identification of three zones (Zone 1 or Z1, Zone 2 or Z2 and Zone 3 or Z3)
138
distinguished from minima in eddy activity (Figure 1). Z1 was identified as the region
139
with the highest number of short-lived cyclonic eddies along the east coast of
140
Australia.
141
142
2. Data and Methodology 143
144
2.1 Data 145
146
Daily estimates of Chl-a (mg.m-3) and SST (oC) were disseminated via the data portal
147
of Australian Integrated Marine Observing System (IMOS 2015a) and were used in
148
this study for the period 09/08/2002 to 31/10/2015. The data was gridded with a
149
spatial resolution of 0.01o (IMOS 2015a). The data was derived from MODerate
150
resolution Imaging Spectroradiometer (MODIS) measurements with methodological
151
details provided by O’Reilly et al. (2000) and Claustre and Maritorena (2003).
152
M
AN
US
CR
IP
T
AC
CE
PT
ED
8
Gridded sea surface height anomaly (SSHa) was available for the period 01/01/1993 –
154
31/10/2015 and for every second day until 31/12/2010 and daily thereafter (IMOS
155
2015b). The eddy detection tool provided by Halo et al. (2014) was applied to SSHa
156
data for this period (Section 2.2 Methodology). The spatial resolution of SSHa data
157
used in this study was 1/5o. This compared to the 1/4o resolution in Chelton et al.
158
(2011), which was evaluated by Everett et al. (2012) and Pilo et al. (2015) resolving
159
eddies with a minimum radii of >40 km and lifetime larger than 28 days. Halo et al.
160
(2014) used SSH gridded data with 0.25o resolution and tracked eddies with lifetime
161
larger than 30 days. Census data from the application of the Halo et al. (2014) method
162
in this study and for lifetimes of at least 7 days were presented in Table 1.
163
164
The mean eddy core characteristics such as Chl-a, SST and SSHa were determined for
165
all detected eddies (Table 2). The core size was defined in this study to have a radius
166
of 20 km. Chl-a and SST anomalies were also computed as the difference in mean
167
value for the core and the value computed for a larger area with radius of 40 km, but
168
excluding any values within the core. The number of observations to determine Chl-a
169
and SST anomalies was much reduced compared to SSHa data due to frequent and
170
extensive cloud coverage (see also discussion in Brieva et al. 2015).
171
172
2.2 Methodology 173
174
Methods to track eddies in remotely sensed observation of SSHa and ocean model
175
data were described by e.g. Chelton et al. (2007), Henson and Thomas (2007),
176
Chelton et al. (2011), Morrow and Le Traon (2012), Mason et al. (2014), Halo et al.
177
(2014), Karstensen et al. (2015), and Pegliasco et al. (2015). The eddy-tracking
M
AN
US
CR
IP
T
AC
CE
PT
ED
9
algorithm utilised in this study was initially proposed by Penven et al. (2005) to assess
179
eddy characteristics of the Peru Current System. Halo et al. (2014) used the method
180
for an eddy census of the Mozambique Channel and provided the method as a Matlab
181
toolbox, which was implemented for this study.
182
183
Halo et al. (2014) combined a geometry approach with a dynamic criterion. The
184
former method detected closed SSHa loops (Chelton et al. 2011), whereas the latter
185
involved computing the Okubo-Weiss parameter. The Okubo-Weiss parameter was
186
applied as a criteria or filter to identify regions of vorticity. Negative values beyond a
187
defined negative threshold value were being indicative of a vorticity dominated flow
188
field (Chelton et al. 2007, 2011). Thus, regions within a closed loop of SSHa and
189
characterised by negative vorticity were then typical for the presence of an eddy. The
190
threshold value for the Okubo-Weiss parameter W used by Halo et al. (2014) was W
191
< 0 s−2. Chelton et al. (2007) applied a value of W < -2x10⁻¹² s−2.
192
193
The parameters values adopted in this study were the following: a maximum radius Ro
194
of 200 km to exclude larger eddies and ocean gyres, a contour interval of 0.002 m to
195
identify closed loops of SSHa, an Okubo-Weiss parameter W < -2x10⁻¹² s−2 as per
196
Chelton et al. (2007) to identify regions of vorticity characterising the flow field, and
197
a Hanning filter that was applied twice to reduce grid scale noise in the computed
198
Okubo-Weiss parameter. The tracking code was limited to identify eddies with radii
199
larger than 22.5 km and a minimum amplitude of 0.02 m. Following an eddy census
200
of the entire domain (Figure 1), eddy statistics were provided for two coastal
201
corridors. These extended eastward from the location of the 100 m depth contour by
202
100 km and 600 km. The western boundary of the each corridor was the coastline,
M
AN
US
CR
IP
T
AC
CE
PT
ED
10
meaning both corridors varied by the width of the continental shelf west of the 100 m
204
depth contours. The shelf is widest just to the south of Fraser Island (Figure 1). The
205
100 km corridor limited the census to eddies that were closest to the coast. These most
206
likely led to the entrainment of near-shore water and subsequent across-shelf transport
207
and observed evidence of entrainment was presented below (section 3.1). The wider
208
corridor of 600 km was used to allow for some limited comparison with Everett et al.
209
(2012) and Pilo et al. (2015).
210
211
The Halo et al. (2014) eddy detection and tracking tool was applied: firstly, to detect
212
eddies, which provided information on mean radius and SSHa; secondly, to track their
213
movements, which provided information about lifetime; and thirdly, to determine
214
their location within the 100 km corridor and a 600 km coastal corridor for
215
comparison with previous studies. A tracked eddy may have enterd or left one of the
216
corridors. The number of detected eddies was much larger than the number of tracked
217
individual eddies. A tracked eddy was referred to as an eddy event. It was found that
218
this study utilising the Halo et al. (2014) algorithm identified several important
219
climatological features of the EAC as highlighted by Ridgway and Dunn (2003) and
220
many of the mean eddy characteristics identified in the previous censuses.
221
222
3. Results 223
224
The application of the Halo et al. (2014) resulted in an archive of detected eddies and
225
the location of eddy cores at a particular date. Once detected, we then inspected the
226
database of daily Chl-a and SST images for evidence of these eddies in ocean colour.
227
Several examples of identified eddies were presented in Section 3.1 showing the
M
AN
US
CR
IP
T
AC
CE
PT
ED
11
detected eddy core location and remotely sensed Chl-a for the shelf region of
229
southeast Queensland. In Section 3.2, a tracked eddy was presented as an example for
230
all those tracked in the census. The census was described further in Section 3.3 with
231
results being summarised in Table 1 and 2.
232
233
3.1 Detected individual cyclonic eddies
234
235
The eddy detection tool identified CEs on July 31, 2003 with an eddy core located at
236
154.2087 oE and 26.4739 oS; on August 14, 2004 with an eddy core located at
237
154.2286 oE and 28.1857 oS; on October 8, 2007 with an eddy core located at 154.181
238
o
E and 27.0143 oS; and on June 25, 2013 with an eddy core located at 154.2303 oE
239
and 26.8758 oS. CEs and corresponding Chl-a concentrations were shown in Figure 2.
240
M
AN
US
CR
IP
T
AC
CE
PT
ED
M
AN
US
CR
IP
T
AC
CE
PT
ED
13
Figure 2: Series of detected CE with coordinates of detected eddy cores on July 31,
242
2003; August 14, 2004; October 8, 2007 and June 25 2013 indicated and
243
corresponding images of the Chl-a concentration (mg/m3) on those dates. Indicated
244
are the 40 m, 200 m, and 1000 m depth contours.
245
246
The Chl-a images (Figure 2) were selected following the identification of an eddy
247
core on a particular day. In all cases, the region of the eddy’s location was
248
characterised by higher Chl-a concentrations. Elevated Chl-a filaments (e.g. with
249
values of about 6 mg/m3 on August 14, 2004) extended away from near coastal waters
250
in a cyclonic fashion across the 40-80 km wide shelf off southeast Queensland. This
251
was indicative of the eddy’s interaction with the shallow shelf waters and the
252
entrainment of near coastal high nutrient primary productivity stimulating waters.
253
254
3.2 Tracking a cyclonic eddy
255
256
Chl-a and SST filaments observed for a detected and tracked eddy, indicated that this
257
particular CE interacted with the shallow (<40 m) near-coast shelf (Figure 3). It
258
exported water off-shore in a cyclonic fashion as evident from entrained water
259
characterised by elevated Chl-a and cooler coastal water.
260
M
AN
US
CR
IP
T
AC
CE
PT
ED
14 262
263
264 265
Figure 3: Evidence of a CE detected on July 2, 2012 from remotely sensed (top left
266
panel) Chl-a (mg/m3), (top right panel) SST (oC), and (lower panel) SSHa (m) with
267
negative SSHa anomalies contoured in intervals of 0.05 m. The location of the core of
268
the eddy was traced from its initial detection on May 28 to its dissipation on July 12.
M
AN
US
CR
IP
T
AC
CE
PT
ED
15
Circles in (c) indicate location and date of core with core locations shown for May 30,
270
June 4-29 and finally for July 9, 2012.
271
272
The CE appeared to be wedged between the shelf break and the EAC. The core of the
273
CE was situated at about 154.5 oE. The EAC was evident from the higher SST (>25
274
o
C) emerging in the north and extending southward along the shelf break and was
275
associated with lower Chl-a concentrations (Figure 3). The CE appeared to deflect the
276
EAC flow eastward.
277
278
First identified on May 28th, 2012, the eddy was initially located at about 155.2 oE and
279
26.3 oS or about 150 km to the northeast of its location on July 2, 2012. Its radius was
280
about 46 km, covering a surface area of 6642 km2 and extended westward close to the
281
coast with SSHa at about -0.05 m. The eddy was tracked over a period of about six
282
weeks (Figure 3 with core locations indicated). After a maximum in SSHa of about
-283
0.2 m on July 2, 2012 at location 154.5 oE and 27.25 oS, the CE started to rapidly
284
decay. It had dissipated by about July 11, 2012 with SSHa of less than 0.05 m and
285
reached a most southern location of 154.4oE and 27.5 oS. Its mean latitudinal
286
displacement speed in a south-westerly direction from about 26.3 oS to about 27.3 oS
287
(~110 km) over the six week period was estimated with about ~3 km per day. This
288
displacement speed was similar to the mean speed of 3.2 km per day identified by Pilo
289
et al. (2015) for CEs from the Chelton et al (2011) eddy census. It was representative
290
for the mean displacement speeds (~4 km per day) found for all CE detected in this
291
study. On July 2, 2012, the SST anomaly was about -0.9 oC and the Chl-a eddy core
292
concentration was about 1 mg/m3 and above a typical background level of about 0.2
293
mg/m3. The maximum SSHa was about -0.2 m (Figure 2c).
M
AN
US
CR
IP
T
AC
CE
PT
ED
16
3.3 The East Australian Current Eddy Census
295
296
The number of all tracked eddy events across the region (see Figure 1) with lifetime
297
of at least 1-2 weeks was 804 (Figure 4). This included 395 CEs (49%) and 409 ACEs
298
(51%). There were on average about 37 eddy events per year. Short-lived eddies
299
(lifetime 7-28 days) contributed about 64% of all tracked eddies. Eddies lasting more
300
than 10 weeks made up 16% of the total and potentially exited from the area
301
considered in this study.
302
303
304
Figure 4: Lifetime (weeks) of CE and ACE during the period 1993 to 2015.
305
306
The total number of detected eddies per degree latitude was shown for both the 100
307
km and 600 km wide coastal corridors and for detected eddies with lifetime >7 days
308
and >28 days (Figure 5). The distribution of detected CEs and ACEs per degree
309
latitudes was represented in Figure 6.
310
M
AN
US
CR
IP
T
AC
CE
PT
ED
17 312
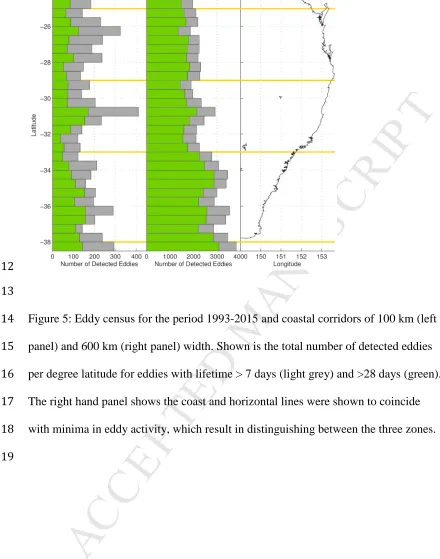
[image:18.595.62.502.86.645.2]313
Figure 5: Eddy census for the period 1993-2015 and coastal corridors of 100 km (left
314
panel) and 600 km (right panel) width. Shown is the total number of detected eddies
315
per degree latitude for eddies with lifetime > 7 days (light grey) and >28 days (green).
316
The right hand panel shows the coast and horizontal lines were shown to coincide
317
with minima in eddy activity, which result in distinguishing between the three zones.
318
M
AN
US
CR
IP
T
AC
CE
PT
ED
18 320
321
Figure 6: Total number of detected ACE (dashed lines) and CE (solid lines) shown for
322
both 7 days and 28 days lifetime.
323
324
The number of detected short-lived (7-28 days) eddies and tracked eddy events (Table
325
1) followed from the difference between eddies lasting at least 7 days and those
326
lasting more than 28 days. For example, in the case of the 600 km wide corridor, the
327
number of total detected CEs and ACEs was at a maximum within Z3 (Table 1).
328
About 67273 detected eddies (Σ1 with 35805 plus Σ2 with 31468) were identified that
329
lasted at least 7 days and of those, 52300 (Σ1 with 28211 plus Σ2 with 24089) lasted
330
28 days and longer. Therefore, about 14973 detected eddies were short-lived (7-28
331
days) within the 600 km corridor of Z3.
332
M
AN
US
CR
IP
T
AC
CE
PT
ED
19
Short-lived detected ACEs (7-28 days) dominated the 100 km coastal corridor and
334
contributed about 64% of all detected ACEs along the EAC. In contrast, only about
335
23% of all detected ACEs were short-lived within the 600 km wide coastal corridor.
336
This followed from an evaluation of the data presented in Table 1. The total number
337
of detected ACEs with lifetime of more than 7 days was 2554 (Σ2, 100 km) and
338
31468 (Σ2, 600 km). Of those, 1645 detected eddies or 64% in the 100 km corridor
339
and 7379 detected eddies or about 23 % in the 600 km corridor were short-lived.
340
341
Short-lived (7-28 days) detected eddies (CEs and ACEs) dominated the northern zone
342
(Z1) of the 100 km corridor. The total number of all detected short-lived eddies was
343
994 in Z1 (Table 1: 515 CEs and 479 ACEs) from a total of all detected eddies (>7
344
days) of 1643 (Table 1: 1003 CEs and 640 ACEs). This corresponded to a total of 202
345
lived eddy events or 41% in Z1 (Table 1: 94 CEs plus 108 ACEs), 154
short-346
lived eddy events or 31% in Z2 (Table 1: 57 CEs plus 97 ACEs), and 141 short-lived
347
eddy events or 28% in Z3 (Table 1: 70 CEs plus 71 ACEs). In other words, of the
348
total number of 497 short-lived eddy events tracked within the 100 km corridor (Σ1 =
349
221 CE events plus Σ2 =276 ACE events), Z1, Z2 and Z3 each contributed 41%,
350
31%, and 28 % of short-lived eddy events respectively.
351
M
AN
US
CR
IP
T
AC
CE
PT
ED
20 353
Table 1 354
Number of detected eddies and tracked eddies for both EAC corridors
355 356
100 km corridor C
Z1 Z2 Z3 Σ Z1 Z2 Z3 Σ
Life-time > 7 days
Detected eddies 1003 840 1264 3107 640 719 1195 2554
Eddy events 153 121 151 425 138 127 150 415
Life-time > 28 days
Detected eddies 488 515 602 1605 161 211 537 909
Eddy events 59 64 81 204 30 30 79 139
Life-time 7-28 days
Detected eddies 515 325 662 1502 479 508 658 1645
Eddy events 94 57 70 221 108 97 71 276
600 km corridor Life-time > 7 days
Detected eddies 9277 9840 16688 35805 8148 8218 15102 31468
Eddy events 585 590 1011 2186 616 628 762 2006
Life-time > 28 days
Detected eddies 7340 8077 12794 28211 6110 5551 12428 24089
Eddy events 266 309 438 1013 268 245 393 906
Life-time 7-28 days
Detected eddies 1937 1763 3894 7594 2038 2667 2674 7379
Eddy events 319 281 573 1173 348 383 369 1100
357 358 359
The Halo et al. (2014) detection and tracking tool appeared to have also captured the
360
approximate location of the centre of two quasi-permanent anticyclonic EAC
361
recirculation cells that were identified previously by Ridgeway and Dunn (2003, their
362
Figure 7). This was evident from two maxima in detected ACEs at about 26oS and
363
31oS (Figure 6). The latter maximum was also evident in the total of all detected
364
eddies (Figure 5) and found to be close to the approximate location of the EAC
365
separation point. It further vindicated the use of Halo et al. (2014) as an appropriate
366
tool to detect and track eddies.
367
368
The northern zone Z1 off the coast of southeast Queensland was characterised by the
369
largest number of tracked short-lived CE events (94 or 43% of the total of 221 tracked
M
AN
US
CR
IP
T
AC
CE
PT
ED
21
eddy events) within the 100 km wide coastal corridor (Table 1). Z1 was part of the
371
previously identified EAC intensification zone (Ridgeway and Dunn 2003).
372
373
The total number of detected ACEs in the 100 km wide corridor and with lifetime > 7
374
days was found to be about 2554 (Table 1). The number of detected ACEs per zone
375
increased north to south from 25% (640 detected eddies in Z1) and 28% (719 detected
376
eddies in Z2) to a maximum of 47% (1195 detected eddies in Z3) (in Table 1) south
377
of about 33oS (Z3) and within the EAC separation zone where the EAC’s eastward
378
flow eastward is often associated with the spawning long-lasting anticyclonic eddies
379
(e.g. Nielson and Cresswell 1981).
380
381
The identified minima in the latitudinal distribution of detected eddies located at
382
about 29o S and 33o S (see Figure 5 and Figure 6) divided the east Australian coast
383
into three discernible zones. These zones were previously distinguished based on the
384
mean EAC characteristics by Ridgway and Dunn (2003) and referred to as the
385
intensification (Z1, north of about 29 oS) and separation zone (combined Z2 and Z3,
386
south of about 29 oS), which includes the location of the EAC separation point and
387
where the EAC turns toward the east. In the northern region Z1 and within the 100 km
388
wide coastal corridor, the total number of short-lived (7-28 days) tracked CEs and
389
ACEs was found to be highest. The southern boundary of Z1 was evident from a
390
minimum in eddy activity located at 29 oS coinciding with the approximate southern
391
boundary of the EAC intensification zone (Ridgway and Dunn 2003).
392
393
The combined two southern zones Z2 and Z3 comprised the EAC separation zone
394
(Ridgway and Dunn 2003). The southern boundary between both zones was found to
M
AN
US
CR
IP
T
AC
CE
PT
ED
22
coincide with the approximate location of the EAC separation point (30 S or 31 S to
396
34 oS, e.g. Godfrey et al. 1980; Ridgeway and Dunn 2003) and where EAC turns
397
toward the east between about 33-35 oS (Ridgway and Dunn 2003) and into the
398
Tasman Sea. The number of eddies detected in both the 100 km and particular the 600
399
km wide corridors increased south of about 33 oS and the boundary between zones Z2
400
and Z3, which is within the region where the EAC separates from the coast. This
401
finding was consistent with previous findings (Everett et al. 2012).
402
403
The number of detected and tracked eddies lasting at least four weeks was compared
404
with the Everett et al. (2012) and Pilo et al. (2015), noting that Everett et al. (2012)
405
only reported detected eddies and individual eddies were not tracked.
406
407
Everett et al. (2012) reported 50.2% CEs and 49.8% ACEs from a total of 2613
408
detected eddies for “Eddy Avenue”. In this study, Z2 and Z3 combined (100 km
409
corridor) were broadly part of the “Eddy Avenue”, which found 59.89% CEs and
410
40.10% ACEs from a total of 1865 detected eddies (i.e. 515+602+211+537; Table 1,
411
>28 days). The total number of detected eddies was about 1/3 less than that reported
412
by Everett et al. (2012), who reported 1314 CEs (this study 1117 CEs) and 1299
413
ACEs (this study 748 ACEs). Everett et al. (2012) and this study found agreement in
414
the tendencies for the total number of detected eddies to increase significantly for the
415
larger Tasman Sea area. Everett et al. (2012) reported a total of 14094 CEs and 14892
416
ACEs, this study found a total of 28211 CEs and 24089 ACEs (Table 1, >28 days,
417
600 km corridor).
418
M
AN
US
CR
IP
T
AC
CE
PT
ED
23
Pilo et al. (2015) identified a total of 1050 individually tracked eddies (51% CEs, 49%
420
ACEs, lifetime >28 days) or 50 on average per year. This study found to a total of
421
1919 individually tracked eddies (Σ1 1013 plus Σ 2 906, see Table 1, >28 days, 600
422
km corridor) or about 87 on average per year (53 % CEs, 47 % ACEs, see Table 1,
423
>28 days, 600 km corridor). In both studies more CEs than ACEs were tracked.
424
425
Mean characteristics quantified for detected eddies within the 100 km wide coastal
426
corridor appeared to be consistent with the conventional eddy model (e.g. Bakun
427
2006; Everett et al. 2012; Weeks et al. 2010) with mean Chl-a high for CEs than
428
ACEs. The model postulates that CEs are to be associated with higher Chl-a due to
429
upwelling that supplies primary productivity enhancing nutrient rich water to the
430
surface, while ACE characterised by lower Chl-a. Yet, inspection of satellite imagery
431
(Figure 2 and 3) indicated that SST and Chl-a core characteristics identified in this
432
study were likely to be a significantly controlled by the entrainment of coastal waters
433
and potential entrainment from other depths. Everett et al. (2012) also found and
434
discussed a significant departure of mean SST and Chl-a characteristics from the
435
conventional eddy model. In this study, mean SSHa was negative for detected CEs
436
and positive for ACEs (Table 2). Detected CEs had lower mean SST and higher mean
437
Chl-a compared to detected ACEs (22.5 oC vs 22.7 oC and 0.27 mg/m3 vs 0.17 mg/m3,
438
see Table 2), which appeared to be consistent with the standard model, but was
439
potentially contributed to by significant entrainment (Figure 2).
440
441
There appeared to be no discernable difference in mean eddy radii between CEs and
442
ACEs found for all zones (Table 2). Mean radii determined in this study were smaller
443
than those reported by Everett et al. (2012) and Pilo et al. (2015) who reported 92 km
M
AN
US
CR
IP
T
AC
CE
PT
ED
24and 83.4 km radii for CEs and 95 km and 82.5 km for ACEs 95 km respectively.
445
These previous studies were based on eddies with lifetime >28 days and mean radii
446
larger than 40 km (Chelton et al 2011). This study’s minimum detected eddy radius
447
was 22.5 km. Rotational speeds (~0.4 m/s to 0.5 m/s) and mean displacement speeds
448
(about 0.05 m/s or about 4 km/day) were similar to values reported by Everett et al.
449
(2012) and Pilo et al. (2015). Considering an estimated mean displacement speed of
450
the 4 km/day and a lifetime of 7-28 days, a short-lived eddy potentially travelled a
451
distance of about 115 km. This mean value based on the tracking tool was found to be
452
similar to the value estimated from tracking the individual eddy shown in Figure 3.
453
Mean core characteristics SST and Chl-a displayed no discernable difference between
454
CEs and ACEs (Table 2) Anomalies for both where found to be very small (not
455
shown). This was likely due to the entrainment process of coastal water, which was
456
likely associated with high Chl-a and low SST filaments near the edge of the eddy,
457
which appeared to emanate from the near shore shelf waters as apparent from
458
inspection of Figure 3 and Figure 4.
459
[image:25.595.67.518.567.754.2]460
Table 2 461
Mean cyclonic and anticyclonic eddy characteristics for the 100 km wide coastal corridor,
462
individual zones Z1 to Z2 and the average of all zones.
463 464 Eddy Characteristics Cyclonic Eddies Anticyclonic Eddies
Life-time > 7 days Z1 Z2 Z3 Z1 Z2 Z3
Radius (103 m) 60±14 57±14 52±12 55±12 53±13 53±14
SSHa (10-2 m) -12±9 -17±11 -12±8 10±6 17±10 19±13
Rotational Speed
(10-2 m/s) 44±22 53±23 47±23 29±12 35±16 50±25
Chl-a (mg/m3) 0.18±0.13 0.22±0.12 0.43±0.36 0.11±0.08 0.14±0.09 0.26±0.78
SST (oC) 24.08±1.98 23.13±2.17 20.24±2.38 24.63±1.77 23.03±1.93 20.45±2.12
Radius (103 m) 66±13 62±13 55±11 61±14 56±13 60±13
SSHa (10-2 m) -16±10 -19±11 -14±8 12±6 17±10 24±13
Rotational Speed
(10-2 m/s) 52±24 60±23 52±23 35±13 37±16 63±25
Chl-a (mg/m3) 0.22±0.15 0.23±0.12 0.44±0.42 0.11±0.1 0.1±0.08 0.2±0.12
SST (oC) 24.14±2.3 23±2.2 20.36±2.4 24.15±1.6 23.91±2.1 20.34±1.9
M
AN
US
CR
IP
T
AC
CE
PT
ED
25 4. Discussion and Conclusion
466
467
The latitudinal location with maxima in detected ACEs at about 26oS and 31oS was
468
found to be consistent with the climatological location of two centres of previously
469
identified EAC anticyclonic recirculation cells (Ridgway and Dunn 2003). The
470
location of the EAC separation point at about 31.5 oS was evident from the maximum
471
of detected eddies between 30 oS and 31 oS (Figure 5 and Figure 6). Here, the
472
separation of the EAC from the coast alleviates the restriction for ACEs formation
473
and the number of detected ACEs increased again southward of 33 oS (Figure 6). This
474
was found to be consistent with other studies (Everett et al. 2012, Piolo et al. 2015).
475
The increase was more apparent for the 600 km corridor where the most southern
476
zone Z3 was characterised by the highest number of detected eddies (Figure 5).
477
478
In the northern zone Z1 off the coast of southeast Queensland, both short-lived (7-28
479
days) CE and ACE events were found to be dominant within the 100 km wide
480
corridor (Table 1). Mean eddy characteristics such as radii, SSHa, SST, Chl-a and
481
total number of detected eddies confirmed with the conventional eddy model and
482
were found to be broadly consistent with those derived from the Chelton et al. (2011)
483
data base (Everett et al. 2012, Pilo et al.2015). Dissimilarities were expected due to
484
different detection and tracking tools, SSHa temporal resolution, the actual regions
485
analysed, different minimum radii applied and minimum lifetime of eddies considered
486
(i.e. 7-28 days versus >28 days in previous studies). The eddy census based on the
487
Halo et al. (2014) method was broadly in good agreement with that from Chelton et
488
al. (2011) for the same coastal domain between total number of detected eddies, but
M
AN
US
CR
IP
T
AC
CE
PT
ED
26
some differences in their distribution. The comparison also identified the two maxima
490
in detected eddies at 27oS and 31oS in the Chelton et al. (2011) database.
491
492
The continental shelf off southeast Queensland and to the south of Fraser Island was
493
found to be home to about 43% of all short-lived detected CEs within a 100 km
494
coastal corridor along the east Australian coast. This corresponded to a total of 94
495
individual CE events tracked during the period 1993-2015 or about 4-5 CEs on
496
average per year. These CEs were likely to encroach onto the shelf leading to the
497
entrainment of near shore water and across-shelf transport as discussed for several
498
individual events (Figure 2 and Figure 3). The frequent occurrence of these CEs could
499
likely contribute to establishing a quasi-permanent alongshore near coast northward
500
flow as it was observed for the separation zone of the EAC (Huyer et al. 1988,
501
Roughen et al. 2011). This potentially established a quasi-permanent cyclonic
on-502
shelf EAC recirculation cell south of Fraser Island referred to as the Fraser Island
503
Gyre. The cyclonic on shelf circulation is similar to that of other continental shelf
504
regions characterised by transient CE genesis such as the Charleston Gyre (Govoni et
505
al. 2009). The continuous, but transient throughout the year, entrainment
506
characteristic of the short-lived CEs generated in this region was likely to be part of
507
the enhancement of primary productivity in this region, which was in part also driven
508
by the Southeast Fraser Island Upwelling System (Brieva et al. 2015). The transient
509
eddies were likely to transport in a cyclonic fashion fish larvae across the shelf that
510
were subsequently transported to the southern temperate waters of the Tasman Sea by
511
the EAC. This mechanism was postulated by Ward et al. (2003) and this study
512
identified the possible role of CEs and the existence of a quasi-permanent gyre in
513
contributing to the cross-shelf exchange process.
M
AN
US
CR
IP
T
AC
CE
PT
ED
27 515
Previous studies of EAC eddy generation and their role in ecosystem dynamics
516
focused on the coastal ocean of New South Wales and the separation zone of the EAC
517
(e.g. Suthers et al. 2011). Results presented here were from an eddy characterisation
518
study with some focus on the coast off southeast Queensland finding that CEs
519
appeared to be a distinct and most prominent feature for this region of the eastern
520
Australian coast. It is noted that this eddy study may have underestimated the
521
presence of CEs for this (and other) region since it is difficult to capture smaller-scale
522
CEs in satellite derived SSHa with a spatial resolution of 22.5 km (see e.g. Macdonald
523
et al. 2016). In the future, it would be prudent to investigate the on-shelf flow pattern
524
and the role of the EAC in this region from in-situ observations augmented with
525
detailed higher resolution modelling studies to confirm the apparent dominant role
526
played by CEs gleaned here from remote sensing data.
527
528
In the case of the EAC, we found that it is the northern EAC intensification zone that
529
was dominated by short-lived CEs (7-28 days). These provided a possible key
530
cyclonic and cross shelf transport mechanism for fish larvae, which is a poorly
531
understood physical process of biological significance (Ward et al. 2003, Mullaney et
532
al. 2013, Mullaney et al. 2014). Frequent CEs of the EAC intensification zone were
533
likely to lead to an alongshore-northerly flow as also documented for the southern
534
EAC separation zone (e.g. Roughen et al. 2011). Combined with a southward flowing
535
EAC along the shelf-break, this would establish an on-shelf characteristic mean
536
oceanographic circulation feature referred to as the Fraser Island Gyre.
537
538
M
AN
US
CR
IP
T
AC
CE
PT
ED
28 Acknowledgement
540
541
The authors would like to thank Halo et al. (2014) and colleagues at the Nansen-Tutu
542
Centre for Marine Environmental Research Department of Oceanography, University
543
of Cape Town for access to the eddy detection and tracking tool and colleagues with
544
the Integrated Marine Ocean Observing (IMOS) for providing remote sensing data.
545
Results reported here contributed to a postgraduate research project and Mr Daniel
546
Brieva is thankful to the Chilean Government for providing a scholarship. The
547
authors wish to also acknowledge the constructive feedback that was received from all
548
reviewers, which helped greatly to improve this paper.
549
550
References 551
552
Bakun, A., 2006. Fronts and eddies as key structures in the habitat of marine fish
553
larvae: opportunity, adaptive response and competitive advantage. Scientia Marina 70,
554
105-122.
555
556
Brieva, D., Ribbe, J., Lemckert, C., 2015. Is the East Australian Current Causing A
557
Marine Ecological Hot Spot and An Important Fisheries near Fraser Island, Australia?
558
Estuarine, Coastal and Shelf Science 153, 121-134, doi: 10.1016/j.ecss.2014.12.012.
559
560
Chelton, D. B., Schlax, M. G., Samelson, R. M., de Szoeke, R. A., 2007. Global
561
observations of large oceanic eddies. Geophysical Research Letters 34, L15606, doi:
562
10.1029/2007gl030812.
563
M
AN
US
CR
IP
T
AC
CE
PT
ED
29
Chelton, D. B., Schlax, M.G., Samelson, R.M., 2011. Global observations of
565
nonlinear mesoscale eddies. Progress in Oceanography 91, 167–216.
566
567
Claustre, H., Maritorena, S., 2003. The Many Shades of Ocean Blue. Science 302,
568
1514–1515.
569
570
Everett, J. D., Baird, M. E., Suthers, I. M., 2011.Three-dimensional structure of a
571
swarm of the salp Thalia democratica within a cold-core eddy off southeast Australia.
572
Journal of Geophysical Research – Ocean 116, C12046.
573
574
Everett, J. D., Baird, M. E., Oke, P. R., Suthers, I. M., 2012. An avenue of eddies:
575
Quantifying the biophysical properties of mesoscale eddies in the Tasman Sea.
576
Geophysical Research Letters 39, doi: 10.1029/2012GL053091.
577
578
Everett, J. D., Baird, M. E., Roughan, M., Suthers, I. M., Doblin, M. A., 2014.
579
Relative impact of seasonal and oceanographic drivers on surface chlorophyll a along
580
a Western Boundary Current. Progress in Oceanography 120, 340-351.
581
582
Everett, J. D., Macdonald, H., Baird, M. E., Humphries, J., Roughan, M., Suthers, I.
583
M., 2015. Cyclonic entrainment of preconditioned shelf waters into a frontal eddy.
584
Journal of Geophysical Research – Ocean 120, doi: 10.1002/2014JC01301.
585
586
Godfrey, J. S., Cresswell, G. R., Golding, T. J., Pearce, A. F., 1980. The Separation of
587
the East Australian Current. Journal of Physical Oceanography 10, 430-440.
588
M
AN
US
CR
IP
T
AC
CE
PT
ED
30
Govoni, J. J., Hare, J. A., Davenport, E. D., Chen, M. H., Marancik, K. E., 2009.
590
Mescoscale, cyclonic eddies as larval fish habitat along the southeast United States
591
shelf: a Lagrangian description of the zooplankton community. ICES Journal of
592
Marine Science 67, 403-411.
593
594
Gruber, N., Lachkar, Z., Frenzel, H., Marchesiello, P., Munnich, M., McWilliams, J.
595
C., Nagai, T., Plattner, G.-K., 2011. Eddy-induced reduction of biological production
596
in eastern boundary upwelling systems. Nature Geoscience 4, 787-792.
597
598
Halo, I., Backeberg, B., Penven, P., Ansorge, I., Reason, C., Ullgren, J. E., 2014.
599
Eddy properties in the Mozambique Channel: A comparison between observations
600
and two numerical ocean circulation models. Deep Sea Research Part II: Topical
601
Studies in Oceanography 100, 38-53.
602
603
Henson, S. A., Thomas, A. C., 2008. A census of oceanic anticyclonic eddies in the
604
Gulf of Alaska. Deep-Sea Research Part I: Oceanographic Research Papers 55,
163-605
176.
606
607
Huyer, A., Smith, R. L., Stabeno, P. J., Church, J. A., White, N. J., 1988. Currents of
608
South-eastern Australia: Results from the Australian Coastal Experiment. Australian
609
Journal of Marine and Freshwater Research 39, 245-288.
610
611
IMOS, 2015a. Chlorophyll-a concentration (OC3) (Last access November 2015).
612
http://rs-data1-mel.csiro.au/thredds/catalog/imos-srs/oc/aqua/1d/catalog.html
613
M
AN
US
CR
IP
T
AC
CE
PT
ED
31
IMOS, 2015b. Gridded sea level anomaly (Last access November 2015).
615
http://thredds.aodn.org.au/thredds/catalog/IMOS/OceanCurrent/GSLA/DM00/catalog.
616
html
617
618
Karstensen, J., Fiedler, B., Schütte, F., Brandt, P., Körtzinger, A., Fischer, G.,
619
Zantopp, R., Hahn, J., Visbeck, M., Wallace, D., 2015. Open ocean dead zones in the
620
tropical North Atlantic Ocean. Biogeosciences 12, 2597-2605.
621
622
Kasai, A., Kimura, S., Nakata, H., Okazaki, Y., 2002. Entrainment of coastal water
623
into a frontal eddy of the Kuroshio and its biological significance. Journal of Marine
624
Systems 37, 185-198.
625
626
Macdonald, H. S., Roughan, M., Baird, M., Wilkin, J., 2016. The formation of a
cold-627
core eddy in the East Australian Current. Continental Shelf Research 114, 72-84.
628
629
Mason, E., Pascual, A., McWilliams, J. C., 2014. A New Sea Surface Height–Based
630
Code for Oceanic Mesoscale Eddy Tracking. Journal of Atmospheric and Oceanic
631
Technology 31, 1181–1188, doi: 10.1175/JTECH-D-14-00019.1.
632
633
Matis, P. A., Figueira, W. F., Suthers, I. M., Humphries, J., Miskiewicz, A., Coleman
634
R. A., Kelaher, B. P., Taylor, M. D., 2014. Cyclonic entrainment? The
635
ichthyoplankton attributes of three major water mass types generated by the
636
separation of the East Australian Current. ICES Journal of Marine Science 71,
1696-637
1705, doi: 10.1093/icesjms/fsu062.
638
M
AN
US
CR
IP
T
AC
CE
PT
ED
32
Morrow, R., Le Traon, P.-Y., 2012. Recent advances in observing mesoscale ocean
640
dynamics with satellite altimetry. Advances in Space Research 50, 1062-1076.
641
642
Mullaney, T. J., Suthers, I. M., 2013. Entrainment and retention of the coastal larval
643
fish assemblage by a short-lived, submesoscale, frontal eddy of the East Australian
644
Current. Limnology and Oceanography 56, 1546-1556.
645
646
Mullaney, T. J., Gillanders, B. M., Heagney, E. C., Suthers, I. M., 2014. Entrainment
647
and advection of larval sardine, Sardinopssagax, by the East Australian Current and
648
retention in the western Tasman Front. Fisheries Oceanography 23, 554-567.
649
650
Nilsson, C. S., Cresswell, G. R., 1981. The formation and evolution of East Australian
651
Current warm-core eddies. Progress in Oceanography 9, 133-183.
652
653
Oke, P., Griffin, D., 2010. The cold-core eddy and strong upwelling off the coast of
654
new South Wales in early 2007. Deep Sea Research Part II: Topical Studies in
655
Oceanography 58, 574-591.
656
657
O'Reilly, J.E. et al., 2000. SeaWiFS Post Launch Calibration and Validation
658
Analyses, Part 3. In: Hooker s. B., firestone, E. R. (Eds.), NASA Tech. Memo.
2000-659
206892, NASA Goddard Space Flight Center, vol. 11, 49 pp. 660
661
Pegliasco, C, Chaigneau, A., Morrow, R., 2015. Main eddy vertical structures
662
observed in the four Eastern Boundary Upwelling Systems. Journal of Geophysical
663
Research – Oceans 120, doi: 10.1002/2015JC010950.
M
AN
US
CR
IP
T
AC
CE
PT
ED
33 665
Penven,P., Échevin,V., Pasapera,J., Colas,F., Tam, J., 2005. Average circulation,
666
seasonal cycle and mesoscale dynamics of the Peru Current System: a modelling
667
approach. Journal of Geophysical Research - Ocean 110, C10021.
668
669
Pilo, G. S., Mata, M. M., Azevedo, J. L. L., 2015. Eddy Surface properties and
670
propagation at Southern Hemisphere western boundary current systems. Ocean
671
Science Discussions 12, 135-160.
672
673
Ridgway, K. R., Dunn, J. R., 2003. Mesoscale structure of the mean East Australian
674
Current System and its relationship with topography. Progress in Oceanography 56.
675
189-222.
676
677
Roughen, M., Macdonald, H. S., Baird, M. E., Glasby, T. M., 2011. Modelling coastal
678
connectivity in a Western Boundary Current: Seasonal and inter-annual variability.
679
Deep-Sea Research II 58, 628-644.
680
681
Suthers, I. M., J. W. Young, et al. 2011. The strengthening East Australian Current, its
682
eddies and biological effects — an introduction and overview. Deep Sea Research
683
Part II: Topical Studies in Oceanography 58, 538-546.
684
685
Weeks, S. J., Bakun, A., Steinberg, C. R., Brinkman, R., Hoegh-Guldberg, O.,
686
2010. The Capricorn Eddy: a prominent driver of the ecology and future of the
687
the southern Great Barrier Reef. Coral Reefs 29, 975-985.
688
M
AN
US
CR
IP
T
AC
CE
PT
ED
34
Ward, T. M., Staunton-Smith, J., Hoyle, S., Halliday, I. A., 2003. Spawning patterns
690
of four species of predominantly temperate pelagic fishes in the sub-tropical waters of
691
southern Queensland. Estuarine, Coastal and Shelf Science 56, 1125-1140.
M
AN
US
CR
IP
T
AC
CE
PT
ED
35 693
List of Tables 694
[image:36.595.71.498.103.707.2]695
Table 1: Number of detected eddies and tracked eddies for both EAC corridors.
696
697
Table 2: Mean cyclonic and anticyclonic eddy characteristics for the 100 km wide
698
coastal corridor, individual zones Z1 to Z2 and the average of all zones.
699
700
701
702
M
AN
US
CR
IP
T
AC
CE
PT
ED
36 List of Figures704
705
Figure 1: Location of the study site along the east coast of Australia. The
706
boundaries between Zone 1 (Z1) and Zone 2 (Z2) at about 29o S and Z2
707
and Zone 3 (Z3) at about 33o S were identified in this study from minima
708
in eddy activity. Approximate mean path of the East Australian Current
709
(EAC) is shown in light grey. Eddies were tracked over the whole region.
710
An eddy census was conducted and the analysis limited to two coastal
711
corridors of 100 km and 600 km width each (dash lines).
712
713
Figure 2: Series of detected CE with coordinates of detected eddy cores on July 31,
714
2003; August 14, 2004; October 8, 2007 and June 25 2013 indicated and
715
corresponding images of the Chl-a concentration (mg/m3) on those dates.
716
Indicated are the 40 m, 200 m, and 1000 m depth contours.
717
718
Figure 3: Evidence of a CE detected on July 2, 2012 from remotely sensed (a) Chl-a
719
(mg/m3), (b) SST (oC), and (c) SSHa (m) with negative SSHa anomalies
720
contoured in intervals of 0.05 m. The location of the core of the eddy was
721
traced from its initial detection May 28 to its dissipation on July 12.
722
Circles in (c) indicate location and date of core with core locations shown
723
for May 30, June 4-29 and finally for July 9, 2012.
724
725
Figure 4: Characteristic lifetimes of CE and ACE (in weeks) detected during the
726
period 1993 to 2015.
727
728
Figure 5: Eddy census for the period 1993-2015 and coastal corridors of 100 km
729
(left panel) and 600 km (right panel) width. Shown is the total number of
730
detected eddies per degree latitude for eddies lasting at least 7 days (light
731
grey) and 28 days (green). The right hand panel shows the coast and
732
horizontal lines were shown to coincide with minima in eddy activity,
733
which result in distinguishing between the three zones.
734
M
AN
US
CR
IP
T
AC
CE
PT
ED
37
Figure 6: Total number of detected ACE (dashed lines) and CE (solid lines) per
736
degree latitude and shown for both 7 days and 28 days lifetime
M
AN
US
CR
IP
T
AC
CE
PT
ED
• 497 short-lived eddies detected in a coastal corridor off eastern Australia.
• About 23 individual short-lived eddies traced per year.
• 43% of cyclonic eddies (4-5 per year) found off southeast Queensland.
• Cyclonic eddies displaced shelf water by about 110-120 km.