White Rose Research Online URL for this paper:
http://eprints.whiterose.ac.uk/111375/
Version: Published Version
Article:
Jeffares, Daniel C orcid.org/0000-0001-7320-0706, Jolly, Clemency, Hoti, Mimoza et al. (7
more authors) (2017) Transient structural variations have strong effects on quantitative
traits and reproductive isolation in fission yeast. Nature Communications. 14061. pp. 1-11.
ISSN 2041-1723
https://doi.org/10.1038/ncomms14061
[email protected]
https://eprints.whiterose.ac.uk/
Reuse
This article is distributed under the terms of the Creative Commons Attribution (CC BY) licence. This licence
allows you to distribute, remix, tweak, and build upon the work, even commercially, as long as you credit the
authors for the original work. More information and the full terms of the licence here:
https://creativecommons.org/licenses/
Takedown
If you consider content in White Rose Research Online to be in breach of UK law, please notify us by
Received 20 May 2016
|
Accepted 24 Nov 2016
|
Published 24 Jan 2017
Transient structural variations have strong effects
on quantitative traits and reproductive isolation in
fission yeast
Daniel C. Jeffares
1,2,w
, Clemency Jolly
1
, Mimoza Hoti
1
, Doug Speed
2
, Liam Shaw
1,2
, Charalampos Rallis
1,2,w
,
Francois Balloux
1,2
, Christophe Dessimoz
1,3,4,5
, Ju
¨rg Ba¨hler
1,2
& Fritz J. Sedlazeck
6
Large structural variations (SVs) within genomes are more challenging to identify than
smaller genetic variants but may substantially contribute to phenotypic diversity and
evolution. We analyse the effects of SVs on gene expression, quantitative traits and intrinsic
reproductive isolation in the yeast
Schizosaccharomyces pombe
. We establish a high-quality
curated catalogue of SVs in the genomes of a worldwide library of
S. pombe
strains, including
duplications, deletions, inversions and translocations. We show that copy number variants
(CNVs) show a variety of genetic signals consistent with rapid turnover. These transient
CNVs produce stoichiometric effects on gene expression both within and outside the
duplicated regions. CNVs make substantial contributions to quantitative traits, most notably
intracellular amino acid concentrations, growth under stress and sugar utilization in
wine-making, whereas rearrangements are strongly associated with reproductive isolation.
Collectively, these findings have broad implications for evolution and for our understanding of
quantitative traits including complex human diseases.
DOI: 10.1038/ncomms14061
OPEN
1Department of Genetics, Evolution and Environment, University College London, London WC1E 6BT, UK.2UCL Genetics Institute, University College London,
London WC1E 6BT, UK.3Department of Computer Science, University College London, London WC1E 6BT, UK.4Department of Ecology and Evolution and Center for Integrative Genomics, University of Lausanne, Biophore, Lausanne 1015, Switzerland.5Swiss Institute of Bioinformatics, Biophore, Lausanne 1015, Switzerland.6Department of Computer Science, Johns Hopkins University, Baltimore, Maryland 21218, USA.wPresent addresses: Department of Biology, University of York, York YO105DD, UK (D.C.J.); School of Health, Sport and Biosciences, University of East London, London E15 4LZ, UK (C.R.).
A
variety of genetic changes can influence the biology of
species,
including
single-nucleotide
polymorphisms
(SNPs), small insertion-deletion events (indels),
transpo-son insertions and large structural variations (SV). SVs, including
deletions, duplications, insertions, inversions and translocations,
are the most difficult to type and consequently the least well
described.
Nevertheless, it is clear that SVs have strong effects on
various biological processes. Copy number variants (CNVs) in
particular influence quantitative traits in microbes, plants and
animals, including agriculturally important traits and a variety of
human diseases
1–5. Inversions are known to influence
repro-ductive isolation
6–13and other evolutionary processes such
as recombination
8and hybridization between species
14, with
a variety of consequences
15.
We and others have recently begun to develop the fission yeast
Schizosaccharomyces pombe
as a model for population genomics
and quantitative trait analysis
6,7,16–18. This model organism
combines the advantages of a small, well-annotated haploid
genome
19, abundant tools for genetic manipulation and
high-throughput phenotyping
20, and considerable resources of
genome-scale and gene-centric data
21–23.
Previous analyses of fission yeast have begun to describe
both naturally occurring and engineered inversions and
recipro-cal translocations
6,7,18. Given this evidence for SVs and their
effects in this model species, we recognized that a systematic
survey of SVs would advance our understanding of their
biological influence. Here, we utilize the recent availability
of 161 fission yeast genomes and extensive data on quantitative
traits and reproductive isolation
17to describe the nature
and effects of SVs in
S. pombe
.
We show that SVs have strong effects on a variety
of quantitative traits and intrinsic reproductive isolation.
They contribute an average of 11% of trait variance (the much
more abundant SNPs contribute 24% on average), with the largest
effects coming from CNVs. We show that CNVs are transient
within clonal populations, and are frequently not well tagged
by SNPs. We also show that rearrangements (inversions and
translocations) contribute to reproductive isolation, whereas
CNVs do not.
Results
Population-wide detection of structural variations
. To predict
an initial set of SVs, we applied four inference software packages
(Delly, Lumpy, Pindel and cn.MOPs)
24–27to existing short-read
data
17, using parameters optimized on simulated data (Methods).
We then filtered these initial predictions, accepting SVs detected
by at least two callers, to obtain 315 variant calls (141 deletions,
112 duplications, 26 inversions and 36 translocations). We
release this pipeline as an open-source tool called SURVIVOR
(Methods). To ensure a high specificity, we further filtered
the 315 variants by removing SV calls whose breakpoints
overlapped with low complexity regions or any that
correspo-nded to previously annotated long terminal repeats (LTRs)
17.
Finally, we manually vetted all the remaining SVs by visual
inspection of read alignments in multiple strains for all remaining
candidates. This meticulous approach aimed to ensure a
high-quality call set, to mitigate against the high uncertainty associated
with SV calling
25.
This curation produced a set of 113 SVs, comprising
23 deletions, 64 duplications, 11 inversions and 15 translocations
(Fig. 1a). Reassuringly, when applying our variant calling
methods to an engineered knockout strain, we correctly identified
the known deletions and called no false positives. Attempts
to validate all rearrangements by PCR and BLAST searches of
de novo
assemblies positively verified 76% of the
rearrange-ments, leaving only a few PCR-intractable variants unverified
(see Methods for details).
Most SVs were present at low frequencies, with 28% discovered
in only one of the strains analysed (Fig. 1b). The deletions were
generally slightly smaller (median length 14 kb, Fig. 1c) than
duplications (median length of 21 kb), with the largest duplication
extending to 510 kb and covering 200 genes (a singleton in strain
JB1207/NBRC10570). The majority of CNVs were present
in copy numbers varying between 0 and 16 (subsequently we
refer to amplifications of two or more copies as ‘duplications’).
All SVs, particularly deletions and duplications, were biased
toward the ends of chromosomes (Fig. 1d and Supplementary
Figs 1 and 2), which are characterized by high genetic diversity,
frequent transposon insertions and a paucity of essential genes
17,
similar to
Saccharomyces cerevisiae
and
Sa. paradoxus
28,29.
All SVs preferentially occurred in positions of low gene density
and were strongly under-enriched in essential genes
(Supple-mentary Fig. 2).
To describe SVs further, we conducted gene
enrich-ment analysis with the AnGeLi tool (Suppleenrich-mentary Table 1),
which interrogates gene lists for functional enrichments
using
multiple
qualitative
and
quantitative
information
sources
30. The CNV-overlapping genes were enriched for
caffeine/rapamycin induced genes and genes induced during
meiosis
(
P
¼
4
10
7and
1
10
5,
respectively);
they
also showed lower relative RNA polymerase II occupancy
and were less likely to contain genes known to produce
abnormal cell phenotypes (
P
¼
1.8
10
5and 3
10
5,
respectively). These analyses are all broadly consistent with
a paucity of CNVs in genes that encode essential mitotic
functions. Rearrangements disrupted only a few genes and
showed no significant enrichments.
Duplications are transient within clonal populations
. Our
previous work identified 25 clusters of near-clonal strains, which
differed by
o
150 SNPs within each cluster
17. We expect that
these clusters reflect either repeat depositions of strains differing
only at few sites (for example, mating-type variants of reference
strains
h
90and
h
–differ by 14 SNPs) or natural populations of
strains collected from the same location. Such ‘clonal populations’
reflect products of mitotic propagation from a very recent
common ancestor, without any outbreeding. We therefore
expected that SVs should be largely shared within these clonal
populations.
suggests that CNVs can arise or disappear frequently during
evolution.
To examine whether this transience is a general feature
of CNVs in this population, we quantified the variation in
copy number of each CNV relative to mutations in the adjacent
region of the genome. If a CNV was subject only to the same
processes as these adjacent regions, we would expect a strong
correlation between the rate of point mutation (SNPs) in
these regions and the total variation in copy number of the
CNV. However, the variation in copy number of CNVs across the
data set was only weakly correlated with SNP variation in nearby
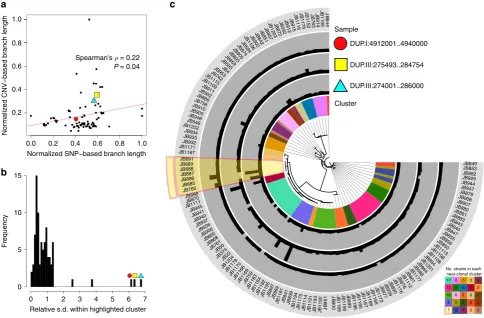
regions of the genome (Spearman rank correlation
r
¼
0.22,
P
¼
0.041), indicating that CNVs are subject to additional or
different evolutionary processes (Fig. 2a). Furthermore, some
CNVs showed high rates of variation within closely related
clusters relative to their variation in the rest of the data set
(Fig. 2b,c, Supplementary Table 2 and Supplementary Fig. 4).
Finally, we found that many CNVs represented the rare allele
within the cluster, consistent with events that have short
half-lives (Supplementary Fig. 5). Taken together, these results
indicate that CNVs are transient and variable features of the
genome, even within extremely closely related strains.
Transient
duplications
affect
gene
expression
.
Partial
aneuploidies of 500–700 kb in the
S. pombe
reference strain
are known to alter gene expression levels within and, to
some extent, outside of the duplicated region
31. The naturally
occurring duplications described here are typically smaller
(median length: 21 kb), including an average of 6.5 genes.
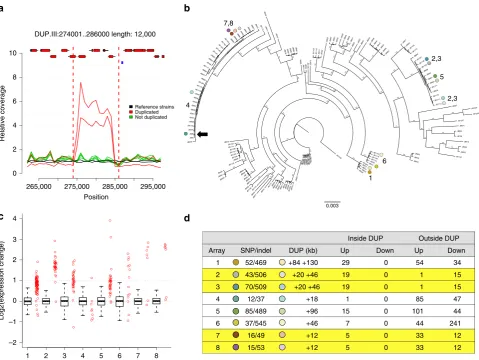
To examine whether naturally occurring CNVs have similar
effects on gene expression, we examined eight pairs of closely
related strains (
o
150 SNPs among each pair) that contained
at least one unshared duplication (Fig. 3 and Supplementary
Table 3). Several of these strain pairs have been isolated
from the same substrate at the same time, and all pairs
are estimated to have diverged
B50–65 years ago
(Suppleme-ntary Table 3). We assayed transcript expression from log
phase cultures using DNA microarrays, each time comparing
a duplicated to a non-duplicated strain from within the same
Population allele frequencyNumber of variants
0.0 0.1 0.2 0.3 0.4 0.5
0 20 40 60
d
a
b
c
DEL DUP INV
SV length (kb)
0.1 1 10 100 1,000
Del
Dup
Inv
Tra Gene density
Transposon
Diversity
Chr 1
Chr 2 Chr 3
DEL (23)
DUP (64)
INV (15)
[image:4.595.82.515.48.406.2]TRA (11)
Figure 1 | Characteristics of SVs inS. pombe.(a) Relative proportions of SVs identified. Duplications (DUP) were the most abundant SVs, followed by
deletions (DEL), inversions (INV) and translocations (TRA). (b) Population allele frequency distribution of SVs, showing the frequencies of less abundant
alleles in the population (minor allele frequencies). (c) Length distributions of SVs, log10scale. Deletions were smallest (2.8–52 kb), duplications larger
(2.6–510 kb) and inversions often even larger, spanning large portions of chromosomes (0.1 kb–5,374 kb, seed). Horizontal dotted lines show the size of
chromosome regions that contain an average of 1, 10 and 100 genes in this yeast. Box plots indicate the first quartile, the median and the third quartile;
whiskers extend to the most extreme data point, which is no more than 1.5 the interquartile range from the box. (d) Locations of SVs on the three
chromosomes compared with other genomic features. From outside: density of essential genes, locations ofTf-type retrotransposons, diversity (p, average
pairwise diversity from SNPs), deletions (black), duplications (red) and breakpoints of inversions and translocations as curved lines inside the concentric circles (green and blue, respectively). Bar heights for retrotransposons, deletions and duplications are proportional to minor allele frequencies. Diversity and
clonal population. In seven out of the eight strain pairs,
the expression levels of genes within duplications were
significantly induced, although the degree of expression changes
between genes was variable (Fig. 3c and Supplementary Fig. 6).
The increased transcript levels correlated with the increased
genomic copy numbers, so that higher copy numbers produced
correspondingly more transcripts (Spearman rank correlation
r
¼
0.71,
P
¼
0.014, Supplementary Fig. 7). No changes in gene
expression were evident immediately adjacent to the duplications
(Supplementary Fig. 7), suggesting that the local chromatin state
was not strongly altered by the CNVs. This result not only
confirms the previous observation that CNVs alter the gene
expr-ession levels, but more importantly it reveals large copy number
differences between two genomes that are only 19 SNPs apart.
Interestingly, some genes outside the duplicated regions
also showed altered expression levels (Fig. 3d and
Suppleme-ntary Table 4). For example, two strain pairs differ by a single
12 kb duplication. Here, five out of seven genes within
the duplication showed induced expression, while 45 genes
outside the duplicated region also showed consistently altered
expression levels (38 protein-coding genes, seven noncoding
RNAs) (Fig. 3d, arrays 7 and 8). As environmental growth
conditions were tightly controlled, these changes in gene
expression could be due to either compensatory effects of the
initial perturbation caused by the 12 kb duplication or changes
that arise due to SNPs or indels that segregate between the strains
(Supplementary Fig. 6). We conclude that these evolutionary
unstable duplications reproducibly affect the expression of
distinct sets of genes and thus have the potential to influence
cellular function and phenotypes.
Copy number variants contribute to quantitative traits
. To test
whether SVs affect phenotypes, we examined the contributions of
SNPs, CNVs and rearrangements to 228 quantitative traits
(Supplementary Table 5), including 20 cell-shape parameters,
colony size on solid media assaying 42 stress and nutrient
conditions
17, 126 growth parameters in liquid media conditions
7and three biochemical parameters from wine fermentation
32. For
each phenotype, we used mixed model analysis to estimate the
total proportion of variance explained by the additive
contribution of genomic variants (the narrow-sense heritability).
Spearman's = 0.22
P = 0.04
JB849 JB853 JB882 JB929 JB944 JB947 JB878 JB908 JB907 JB880 JB881 JB883 JB843 JB840 JB847 JB855 JB856 JB850 JB1113 JB1198 JB1108 JB894 JB1201 JB864 JB588 JB1177 JB861 JB1112 JB876 JB1176 JB890 JB939 JB877 JB1172 JB1166 JB1188 JB1187 JB1185 JB1186 JB899 JB1190 JB1189 0 0 9 B J 1 0 9 B J JB1192 JB1193 JB1191 JB1114 JB1175 JB1194 JB839 JB841 JB1181 JB869 JB897 JB1195 JB1182 JB1184 JB1183 JB759 JB1169 JB1168 JB1170 JB1179 JB1204 JB22 JB374 JB50 JB761 JB868 JB892 JB906 JB936 JB937 JB940 JB941 JB945 JB1111 JB870 JB898 JB760 JB885 JB886 JB887 JB888 JB889 JB891 JB1167 JB1171 JB932 JB933 JB934 JB1202JB946 JB948 JB909JB910 JB758JB866 JB952JB911 JB1109JB1115
JB762JB953JB4
JB593JB859
JB893JB905
JB874JB594 JB1196JB902JB842
JB851JB857
JB1203JB872JB592JB912 JB915
JB1116 JB1178 JB1153 JB763 JB914 JB1199
4 4 8 B J
a
b
0.20.0 0.2 0.4 0.6 0.8 1.0
0.4 0.6 0.8 1.0
Normalized SNP−based branch length
Nor
malized CNV−based br
anch length
Relative s.d. within highlighted cluster
Frequency
0 1 2 3 4 5 6 7
0 5 10 15
c
Cluster DUP.III:274001..286000 DUP.III:275493..284754 DUP.I:4912001..4940000 Sample 17 13 10 8 7 6 6 6 5 5 5 5 5 4 4 3 3 3 3 2 2 2 2 2 2 No. strains in each [image:5.595.55.540.52.370.2]near-clonal cluster
Figure 2 | CNVs are transient within fission yeast.(a) For each of the 87 CNVs we calculated the genetic distance between strains using SNPs in the region around the CNV (20 kb up- and downstream of the CNV, merged) as the total branch length from an approximate maximum-likelihood tree
(xaxis, SNP-based branch length normalized to maximum value). We further calculated a CNV-based distance using the total branch length from
a neighbour-joining tree constructed from Euclidean distances between strains based on their copy numbers (yaxis, CNV-based branch length normalized
to maximum value). The weak correlation indicates that CNVs are subject to additional or different evolutionary processes. (b) Histogram of the standard
deviation of each CNV within a near-clonal cluster (see also Fig. 2a), relative to its standard deviation across strains not in the near-clonal cluster. Standard
deviation is highly correlated with CNV-based branch length (Spearman rank correlationr¼0.90,Po0.001) (Supplementary Fig. 4b). The highlighted
CNVs have unusually high rates of variation within this cluster compared with other clusters. (c) Copy number variation of these highlighted CNVs plotted
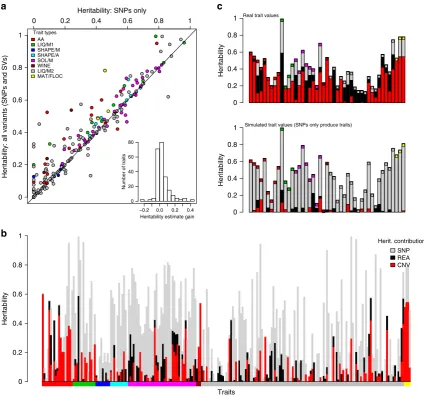
When we determined heritability using only SNP data,
estimates varied between 0 and 74% (median 30%). After adding
CNVs and rearrangements to SNPs in a composite model,
the estimated overall heritability increased for nearly all traits,
explaining up to
B40% of additional trait variance (Fig. 4a). This
finding indicates that the CNVs and rearrangements can explain
a substantial proportion of the trait variance. Using this
composite model, we quantified the individual contributions of
heritability best explained by SNPs, CNVs and rearrangements
(Fig. 4b). On average, SNPs explained 24% of trait variance,
CNVs 7% and rearrangements 4% (Supplementary Table 5).
Analysis of simulated data confirmed that the contribution of
CNVs could not be explained by linkage to causal SNPs alone
(Supplementary Fig. 8).
Many trait measures gathered using the same method
(for example, growth on solid media, cell shape) are strongly
correlated
17. Thus, some groups of traits have consistently larger
contributions from SVs (Fig. 4b) than from SNPs alone. These
traits include intracellular amino acid concentrations, growth
under
stress
and
several
traits
measured
during
wine
fermentation (Fig. 4c). Since many of these strains have been
collected from fermentations (Supplementary Table 6), the
substantial influence of CNVs may represent recent strong
selection and adaptation to fermentation conditions that has
occurred via recent CNV acquisition.
Our analysis of heritability showed that SNPs are generally
able to capture most, but not all, of the genetic contribution
of SVs (Fig. 4). To examine whether trait-influencing SVs would
be effectively detected from SNPs alone in this population,
we examined the linkage of all 113 SVs with SNPs. We found
that only 63 of these SVs (55%) are in strong linkage to SNPs
(
r
24
0.6), leaving 45% of the SVs weakly linked. This lack of
Duplicated Not duplicated Reference strains JB119 2 JB110 8 JB853 JB 88 7 JB83 9 JB85 6 JB120 4 JB119 5 JB94 7 JB1188 JB1171 JB593 JB85 1 JB91 8 JB117 5
JB848
9 81 1 BJ JB 900
JB845
JB868 JB1154 JB111 0 JB1206 JB844 JB941 JB 931 JB916 JB89 1 JB 91 1 JB119 9 JB85 4 JB905 JB938
JB886
JB873
JB953 JB1177 JB 88 9 JB864 JB119 3 JB 888 JB 763 JB592 JB118 1 JB118 3 JB936 JB111 6 JB118 2 JB119 8 JB837 JB4 JB85 2 JB87 2 JB76 2 JB1176 JB120 1 JB952 JB940 JB899 JB1187
JB907
JB841
JB 88 0 JB94 6 JB866 JB90 8
JB870 JB894
JB91 2 JB 87 4 JB906 JB120 2 JB875
JB890
JB758 JB90 9 JB1185 JB91 7
JB855
JB 879
JB910
JB934
JB94 8 JB1167
JB840
JB 93 0 JB932 JB588 JB861 JB110 9 JB116 9 JB871 JB1168 JB 94 2 JB 59 4 JB374 JB50 JB1179 JB22 JB1113 31 9B J JB83 8
JB939
JB85 7 JB117 8 JB86 2
JB847
JB933
JB929 JB89 8 JB85 8 JB937 JB1153 JB120 3 JB111 7 JB859 JB117 2 JB914 JB945 JB 87 8
JB869
JB876 JB119 0 JB84 6 JB1197 JB1112 JB849 JB 88 4
JB877
JB893
JB111
5
JB943
4 91 1B J JB111 4 JB1186 JB 88 2 JB118 4 JB 88 3 JB111
1 081
1
BJ
JB843
JB117 0 JB759 JB116 6 JB 88 1 JB915 JB885
JB94 4 JB117 4 JB1205 JB84 2 JB892 JB761
JB850
JB 760
JB1207 JB897
JB119 6 JB90 1 JB119 1
JB902
38 4 9 100 100 41 2 4 61 100 9 7 1 6 3 2 100 99 57 100 9 100 2 8 100 57 100 52 10 0 100 55 100 100 100 4 4 100 80 100 57 62 26 100 5 8 98 10 0 100 2 3 8 9 72 80 1 53 9 7 100 8 0 21 7 0 23 60 32 100 41 16 74 48 43 90 100 86 3 5 100 43 100 59 10 6 2 1 2 100 100 99 100 100 100 100 95 94 2 4 26 100 59 87 100 5 6 100 95 100 71 100 98 3 6 99 100 60 1 9 100 25 100 9 9 76 1 9 100 37 98 100 58 25 31 100 9 3 100 6 8 34 3 0 5 1 100 94 100 98 100 100 53 59 30 6 8 49 60 28 100 100 52 94 100 5 5 5 8 10 0 34 100 62 96 1 9 6 100 81 100 3 4 30 9 100 73 100 97 9 61 64
Inside DUP Outside DUP
Array SNP/indel DUP (kb) Up Down Up Down
1 52/469 +84 +130 29 0 54 34
2 43/506 +20 +46 19 0 1 15
3 70/509 +20 +46 19 0 1 15
4 12/37 +18 1 0 85 47
5 85/489 +96 15 0 101 44
6 37/545 +46 7 0 44 241
7 16/49 +12 5 0 33 12
8 15/53 +12 5 0 33 12
265,000 275,000 285,000 295,000
0 4 3 2 1 0 –2 –1 2 4 6 8 10
DUP.III:274001..286000 length: 12,000
Position
Relative coverage
1 2 3 4 5 6 7 8
[image:6.595.59.539.48.408.2]Log2(expression change)
c
a
d
b
0.003 1 6 2,3 2,3 7,8 4 5Figure 3 | Transient duplications affect gene expression.(a) Duplications occur within near-clonal strains. Plot showing average read coverage in 1 kb
windows for two clonal strains (JB760, JB886) with the duplication (red), five strains without duplication (green) and two reference strains (hþ, and h)
(black). Genes (with exons as red rectangles) and retrotransposon LTRs (blue rectangles) are shown on top (see Supplementary Table 3 for details).
(b) Eight pairs of closely related strains, differing by one or more large duplications, selected for expression analysis. The tree indicates the relatedness of
these strain pairs (dots coloured as ind). The position of the reference strain (Leupold’s 972, JB22) is indicated with a black arrow. The scale bar shows the
length of 0.003 insertions per site. (c) Gene expression increases for most genes within duplicated regions. For each tested strain pair, we show the relative
gene expression (strains with duplication/strains without duplication) for all genes outside the duplication (as boxplot) and for all genes within the duplication (red strip chart). In all but one case (array 4), the genes within the duplication tend to be more highly expressed than the genes outside
of the duplication (all Wilcoxon rank sum testPvalueso1.5103). Box plots indicate the first quartile, the median and the third quartile; whiskers
extend to the most extreme data point, which is no more than 1.5 the interquartile range from the box. (d) Summary of expression arrays 1–8, with
strains indicated as coloured dots (as inb), showing number of SNP differences between strains, sizes of duplications in kb (DUP, where ‘þX þY’
indicates two duplications with lengthsXandY, respectively). We show total numbers of induced (up) and repressed (down) genes, both inside and
linkage is consistent with SVs being transient, rather than
persisting within haplotypes. Such weakly linked SVs may be
missed in SNP-only association studies.
To examine this possibility, and to locate specific SVs
that affect these traits, we performed mixed model
genome-wide association studies, using all 68 SVs with minor allele
counts
X
5 (that is, occurring in at least five strains) as well
as 139,396 SNPs and 22,058 indels with minor allele counts
X
5.
Trait-specific
significance
thresholds
for
5%
family-wise
error rates were computed via permutation analysis, and
were approximately 10
4(SVs) and 10
6(SNPs and indels).
Nineteen SVs (28%) were significantly associated with traits
(15 duplications, five deletions and one translocation), as
well
as
228
SNPs
(0.16%),
and
93
indels
(0.42%)
(Supplementary Table 7). SVs were associated with 20 different
traits, including amino acid concentrations, mating traits, and
stress resistance in solid and liquid media. Nine of these SVs were
not strongly linked to SNPs (
r
2o
0.6). The median effect size
of these SVs was 14% (range 6-33%). While more detailed
analyses of these associations will be required to confirm any
–0.2 0.0 0.2 0.4 0
20 40 60 80
Heritability estimate gain
Number of traits
0 0.2 0.4 0.6 0.8 1
0 0.2 0.4 0.6 0.8 1
Heritability: SNPs only
Heritability: all variants (SNPs and SVs)
Trait types AA LIQ/M1 SHAPE/M SHAPE/A SOL/M WINE LIQ/M2 MAT/FLOC
a
b
c
Heritability
Heritability
0 0.2 0.4 0.6 0.8
1 Real trait values
0 0.2 0.4 0.6 0.8
1 Simulated trait values (SNPs only produce traits)
Heritability
Traits 0
0.2 0.4 0.6 0.8 1
[image:7.595.84.509.50.448.2]Herit. contribution SNP REA CNV
Figure 4 | SVs contribute to quantitative traits.(a) Heritability estimates are improved by the addition of SVs. Heritability estimates for 228 traits
(Supplementary Table 5), using only SNP data (xaxis) range from 0 to 96% (median 29%). Adding SV calls (yaxis) increases the estimates (median 34%),
with estimates for some traits being improved up to a gain of 43% (histogram inset). The diagonal line shows where estimates after adding SVs are the
same as those without (x¼y). Inset: the distribution of the ‘gain’ in heritability after adding SV calls (median 0.4%, maximum 43%). Points are coloured by
trait types, according to legend top left. (b) The contributions of SNPs (grey), CNVs (red) and rearrangements (black) to heritability varied considerably
between traits. Coloured bars along thexaxis indicate the trait types. heritability estimates are in Supplementary Table 5. The panel below bars indicates
trait types as in the legend for part (a). (c, top) For some traits, SVs explained more of the trait variation than SNPs. Boxes are coloured as legend
ina. (c, lower) Analysis of simulated data generated with assumption that only SNPs cause traits indicates that the contribution of SVs to trait variance is
unlikely to be due to linkage. Traits from left are; with red inset at top, free amino acid concentrations (glutamine, histidine, lysine, methionine, phenylalanine, proline and tyrosine), with green inset liquid media growth traits (maximum mass in minimal media, time to maximum slope, most rapid slope and highest cell density in rich media), in with magenta inset colony growth on solid media (with Brefeldin, CuSO4, H2O2, hydroxyurea, 0.0025%
MMS, 0.005% MMS, with proline and 0.001% SDS), wine traits with Burgundy inset (malic acid accumulation and glucoseþfructose ultilisation),
with grey inset liquid media conditions (caffeine lag, rate and efficiency, CsCl12efficiency, diamide growth rate, EMS growth rate, ethanol efficiency,
ethanol growth rate, galactose growth rate, growth rate at 40°C, HqCl2lag, KCl efficiency, MgCl2efficiency, MMS lag, NiCl lag, unstressed lag and rate,
particular association, our findings are consistent with the
heritability analysis.
Collectively, these analyses indicate that even a small collection
of SVs, most notably CNVs, can contribute substantially
to quantitative traits. Thus, Genome-wide association studies
(GWAS) analyses conducted without genotyping SVs could fail
to capture these important genetic factors.
Structural variations contribute to reproductive isolation
.
Crosses between
S. pombe
strains produce between
o
1 and
90% viable offspring
6,18. We have previously shown that spore
viability correlates inversely with the number of SNPs between
the parental strains
17. This intrinsic reproductive isolation may be
due to the accumulation of Dobzhansky–Muller incompatibilities
(variants that are neutral in one population, but incompatible
when combined)
33,34. However, genetically distant strains also
accumulate SVs, which are known to lower hybrid viability and
drive reproductive isolation
9. In
S. pombe
, engineered inversions
and translocations reduce spore viability by
B40% (ref. 6).
At present the impact of naturally occurring rearrangements,
sequence divergence, and incompatible alleles in speciation
within budding yeast is unclear
12–14,35,36.
To analyse intrinsic reproductive isolation in our population
based on naturally occurring SVs, we examined the
relation-ship between viability, SNPs and SVs. Both SV-distance
(number of unshared SVs between parents) and SNP-distance
inversely correlated with hybrid viability (Kendall correlation
coefficients, SVs:
t
¼
0.26,
P
¼
5.6
10
3, SNPs:
t
¼
0.35,
P
¼
1.6
10
4) (Supplementary Fig. 9). While inversions and
translocations are known to lower hybrid viability as they affect
chromosome pairing and segregation during meiosis
6,18,37,
CNVs are not expected to influence spore viability. Consistent
with this view, there was no significant correlation between
CNVs and viability (rearrangements,
t
¼
0.36,
P
¼
2.0
10
4;
CNVs,
t
¼
0.10,
P
¼
0.28).
As the numbers of SNP and rearrangement differences
between mating parents are themselves correlated (t
¼
0.53,
P
¼
1.3
10
8), we also estimated the influence of each factor
alone using partial correlations. When either SNPs or
rearrange-ments were controlled for, both remained significantly correlated
with offspring viability (
P
¼
0.04,
P
¼
0.02, respectively) (Fig. 5).
Taken together, these analyses indicate that both rearrangements
and SNPs contribute to reproductive isolation, but CNVs do not.
Discussion
Here we present the first genome- and population-wide catalogue
of SVs among
S. pombe
strains. To account for the high
discrepancy of available methods
25, we applied a consensus
approach to identify SVs (SURVIVOR), followed by rigorous
filtering and manual inspection of all calls. We focused on high
specificity (the correctness of the inferred SV) rather than high
sensitivity (attempting to detect all SVs).
Our previous analyses of these strains, conducted without
SV data
17, attributed both trait variations and
reprodu-ctive isolation to SNPs and/or small indels. Here we show that
the small number of SVs we describe make substantial
contributions to both of these factors. We demonstrate
that CNVs (duplications and deletions) contribute significantly
to our ability to describe quantitative traits, whereas variants that
rearrange the order of the genome (inversions and translocations)
produce much weaker effects on traits. In contrast, CNVs have
no detectable influence on reproductive isolation, while
rearra-ngements contribute substantially to reproductive isolation,
similar to other species
10,38.
We show that CNVs and, to a lesser extent, rearrangements
can produce substantial contributions to trait variation. These
CNVs subtly alter the expression of genes within and beyond
the duplications, and contribute considerably to quantitative
traits. Within small populations, CNVs may produce larger
effects on traits in the short term than SNPs, since their
effect sizes can be substantial (SVs significant in GWAS have
a mean effect size of 16% in this study). Within budding
yeast, clearly measured effects of alterations to gene order in
the DAL metabolic cluster
39and the lethality of some engineered
rearrangements
40indicates that rearrangements can also effect
phenotypic changes. Given the evidence for extensive ploidy and
0 20,000 40,000 60,000
0 20 40 60 80
SNP differences between parents
Viable offspring (%) Viable offspring (%)
Viability (SNPs | rearr): = −0.19 P = 0.038 Viability (rearr | SNPs ): = −0.22 P = 0.016
Self−mating 0.2 0.5 0.9
0 2 4 6 8
0 20 40 60 80
[image:8.595.116.480.49.232.2]Rearrangement differences between parents
Figure 5 | Both SNPs and rearrangements contribute to intrinsic reproductive isolation.Spore viability was measured from 58 different crosses from
Jeffareset al.17(black) or Avelaret al.6(red), with each circle in the plots representing one cross. An additive linear model incorporating both SNP and
rearrangement differences showed highly significant correlations with viability (P¼1.2106,r2¼0.39). Both genetic distances measured using SNPs
and rearrangements (inversions and translocations) significantly correlated with viability when controlling for the other factor (Kendall partial rank order
correlations with viability SNPs|rearrangementst¼ 0.19,P¼0.038; rearrangements|SNPst¼ 0.22,P¼0.016). Some strains produce low-viability
aneuploidy variation with budding yeasts, including clinical
and industrial budding yeasts
29,41,42, SVs can be expected to
have considerable impacts on phenotypic variation of these fungi.
In this context, it is striking that CNVs appear to be transient
within the clonal populations that we studied. Our analysis
is consistent with experimental studies with fission yeast,
indicating that both rearrangements and CNVs may be gained
or lost at rates in excess of point mutations. For example, frequent
gain of duplications has been observed in laboratory cultures
of
S.
pombe
,
where
spontaneous
duplications
suppress
cdc2
mutants at least 100 times more frequently than
point mutations. These suppressor strains lose their duplications
with equal frequency
43, indicating reversion of alleles. Similarly,
duplications frequently occur during experimental evolution
with budding yeast
44. This instability is likely facilitated
by repeated elements, which are unstable within both budding
and fission yeast genomes
45–48, which is also supported by
the enrichment of SVs in our population near retrotransposon
LTRs (Supplementary Fig. 10). Although we do not examine
the stability of rearrangements, there is also evidence for their
instability. Transposon-mediated rearrangements are highly
dynamic in laboratory cultures during selection
49,50, and show
elevated mutation rates at subtelomeric regions
51.
This analysis also has relevance for human diseases, since
de novo
CNV formation in the human genome occurs at a rate
of approximately one CNV/10 generations
52, and CNVs are
known to contribute to a wide variety of diseases
4. Indeed, both
the population genetics and the effects of SVs within
S. pombe
seem similar to human, in that CNVs are associated with
stoichiometric changes on gene expression, and SVs are in weak
linkage with SNPs
53,54, and therefore may be badly tagged by
SNPs in GWAS studies. We show that CNVs and rearrangements
in fission yeast not only rapidly emerge but also substantially
contribute to quantitative traits independent of weakly linked
SNPs. These findings highlight the need to identify SVs when
describing traits using GWAS, and indicate that a failure to call
SVs can lead to an overestimation of the impact of SNPs to traits
or contribute to the problem that large proportions of
the heritable component of trait variation are not discovered in
GWAS (the ‘missing heritability’). We observed a clear example
of this effect in two winemaking traits, where heritability was
entirely due to SVs.
In summary, we show that different types of SVs are transient
within populations of fission yeast, where they alter gene
expression, impact phenotypes and can lead to reproductive
isolation.
Methods
Performance assessment of SV callers using simulated data
.
To identify filtering parameters for DELLY, LUMPY and Pindel for theS. pombegenome, we simulated seven data sets (s1–s7) of 40coverage with a range of different SV types and sizes (Supplementary Table 7). The simulated read sets contained sequencing errors (0.4%), SNPs and indels (0.1%) within the range of actual data fromS. pombestrains and between 30 and 170 SVs. These data sets were produced by modifying the reference genome using our in-house software (SURVIVOR, described below), and simulating reads from this genome with Mason software55.After mapping the reads and calling SVs, we evaluated the calls. We defined a SV correctly predicted if: (i) the simulated and reported SV were of the same type (for example, duplication), (ii) were predicted to be on same chromosome and (iii) their start and stop locations were with 1 kb. We then defined caller-specific thresholds to optimize the sensitivity and false discovery rate (FDR) for each caller. FDRs on the simulated data were low: DELLY (average 0.13), LUMPY (average 0.06) and Pindel (average 0.04).
Selecting calls that were present in at least two callers further reduced the FDR (average of 0.01). DELLY had the highest sensitivity (average 0.75), followed by SURVIVOR (average 0.70), LUMPY (average 0.62) and Pindel (0.55). We further used simulated data to assess the sensitivity and FDR of our predictions. cn.mops was evaluated with a 2 kb distance for start and stop coordinates. Our cn.mops parameters were designed to identify large (above 12 kb)
events and thus did not identify any SVs simulated for s1-s6. Details of simulations and caller efficacy are provided in Supplementary Table 9.
SURVIVOR (StructURal Variant majorIty VOte) Software Tool
.
We developed the SURVIVOR tool kit for assessing SVs for short-read data that contains several modules. The first module simulates SVs given a reference genome file (fasta) and the number and size ranges for each SV (insertions, deletions, duplications, inversions and translocations). After reading in the reference genome, SURVIVOR randomly selects the locations and size of SV following the provided parameters. Subsequently, SURVIVOR alters the reference genome accordingly and prints the so altered genome. In addition, SURVIVOR provides an extended bed file to report the locations of the simulated SVs.The second module evaluates SV calls based on a variant call format (VCF) file56and any known list of SVs. A SV was identified as correct if (i) they were of same type (for example, deletion); (ii) they were reported on same chromosome and (iii) the start and stop coordinates of the simulated and identified SV were within 1 kb (user definable).
The third module of SURVIVOR was used to filter and combine the calls from three VCF files. In our case, these files were the results of DELLY, LUMPY and Pindel. This module includes methods to convert the method-specific output formats to a VCF format. SVs were filtered out if they were unique to one of the three VCF files. Two SVs were defined as overlapping if they occur on the same chromosome, their start and stop coordinates were within 1 kb, and they were of the same type. In the end, SURVIVOR produced one VCF file containing the so filtered calls. SURVIVOR is available at github.com/fritzsedlazeck/SURVIVOR.
Read mapping and detection of structural variants
.
Illumina paired-end sequencing data for 161S. pombestrains were collected as described in Jeffares,et al.17, with the addition of Leupold’s reference 975hþ(JB32) and excluding
JB374 (known to be a gene-knockout version of the reference strain, see below). Leupold’s 968h90and Leupold’s 972h were included as JB50 and JB22,
respectively (Supplementary Table 6). For all strains, reads were mapped using NextGenMap (version 0.4.12)57with the following parameter (-X 1000000) to theS. pombereference genome (version ASM294v2.22). Reads with 20 base pairs or more clipped were extracted using the scriptsplit_unmapped_to_fasta.pl
included in the LUMPY package (version 0.2.9)25and were then mapped using YAHA (version 0.1.83)58to generate split-read alignments. The two mapped files were merged using Picard-tools (version 1.105)
(http://broadinstitute.github.io/picard), and all strains were then down-sampled to 40coverage using Samtools (version 0.1.18) (ref. 59).
Subsequently, DELLY (version 0.5.9, parameters: ‘‘ –q 20 -r’’)26, LUMPY
(version 0.2.9, recommended parameter settings)25and Pindel (version 0.2.5a8,
default parameter)27were used to independently identify SVs in the 161 strains using our SURVIVOR software. This included merging any variants of the same type (duplication, deletion and so on) whose start and end coordinates where within 1 kb. Merging was justified by the finding that most allele calls were close to the defined call (only 5% of start or end positions were4300 nt from the defined
consensus boundary). We then retained all variants predicted by at least two methods. These SVs calls were genotyped using DELLY.
To identify further CNVs, we ran cn.MOPS24with parameters tuned to collect large duplications/deletions as follows: read counts were collected from bam alignment files (as above) withgetReadCountsFromBAMand WL¼2000, and CNVs predicted usinghaplocn.mopswith min Width¼6, all other parameters as default. Hence, the minimum variant size detected was 12 kb. CNV were predicted for each strain independently by comparing the alternative strain to the two reference strains (JB22 and JB32) and four reference-like strains that differed from the reference byo200 SNPs (JB1179, JB1168, JB937 and JB936).
After CNV calling, allele calling was achieved by comparing counts of coverage in 100 bp windows for the two reference strains (JB22 and JB32) to each alternate strain using custom R scripts. Alleles were called as non-reference duplications if the one-sided Wilcoxon rank sum testPvalues for both JB22 and JB32 vs alternate strain were less than 11010(showing a difference in coverage) and the ratio of
alternate/reference coverage (for both JB22 and JB32) was41.8 (duplications), or o0.2 (deletions). Manual inspection of coverage plots showed that the vast
majority of the allele calls were in accordance with what we discerned by eye. These R scripts were also used to examine CNVs predicted to be segregating within clusters (clonal populations). All such CNVs were examined in all clusters that contained at least one non-reference allele call (Supplementary Table 10).
Finally, we manually mapped two large duplications that did not satisfy these criteria (DUP.I:2950001..3190000, 240 kb and DUP.I:5050001..5560000, 510 kb – both singletons in JB1207), but were clearly visible in chromosome-scale read coverage plots (Supplementary Fig. 11).
Reduction of false discovery rate
.
This filtering produced 315 variant calls. However, because 31 out of these 315 (B10%) were called within the two68223, 60087 and 67860 SNP differences to reference17). The reasoning was that we expected to locate few variants in the reference, and more variants in the more distantly related strains. This analysis showed that paired-end support, repeats and mapping quality were of primary value.
We therefore discarded all SVs that had a paired-end support of 10 or less. In addition, we ignored SVs that appeared in low mapping quality regions (that is, regions where reads with MQ¼0) or those where both start and end coordinates overlapped with previously identified retrotransposon LTRs17.
Finally, to ensure a high specificity call set, these filtered SVs were manually curated using IGV60(Supplementary Tables 11 and 12). We assigned each SVs a
score (0: not reliable, 1: unclear, 2: reliable based on inspection of alignments through IGV). We utilized different visualizations from IGV to identify regions were pairs of the reads mapped to different loci, for example, which we interpreted as possible artefacts. Overall, we investigated whether the alignments of the breakpoints and reads in close proximity had a reliable mapping in terms of mapping quality and clearness of the distortions of the pairs. Only calls passing this manual curation as reliable (score 2) were included in the final data set of 113 variants utilized for all further analyses. These filtering and manual curation steps reduced our variant calls substantially, from 315 to 113. At this stage only 1/113 (B1%) of these variants was called within the two standard reference
strains (Leupolds’shþandh-,JB22 and JB32 in our collection).
PCR validation
.
PCR analysis was performed to confirm 10 out of the 11 inver-sions and all 15 translocations from the curated data set. One inversion was too small to examine by PCR (INV.AB325691:6644..6784, 140 nt). Primers were designed using Primer3 (ref. 61) to amplify both the reference and alternate alleles. PCR was carried out with each primer set using a selection of strains that our genotype calls predict to include at least one alternate allele and at least one reference allele (usually six strains). Products were scored according to product size and presence/absence (Supplementary Tables 13 and 14).Inversions: 9/10 variants were at least partially verified by either reference or alternate allele PCR (three variants were verified by both reference and alternate PCRs), and 7/10 inversions also received support from BLAST (see below). Translocations: 10/15 were at least partially verified by either reference or alternate allele PCR (5/15 variants were verified by both reference and alternate PCRs). One additional translocation received support from BLAST (see below), meaning that 11/15 translocations were supported by PCR and/or BLAST. Three out of the four translocations that could not be verified were probably nuclear copies of mitochondrial genes (NUMTs)62, because one breakpoint was mapped to the mitochondrial genome. Details of the 113 curated variants are presented in Supplementary Table 15.
Validation by BLAST ofde novoassemblies
.
We further assessed the quality of the predicted breakpoints for the inversions and translocations by comparing them to the previously createdde novoassemblies for each of the 161 strains17. To this end, we created blast databases for the scaffolds of each strain that were41kb. We then created the predicted sequence for 1 kb around each junction
of the validated 10 inversions and 15 translocations. These sequences were used to search the blast databases using BLASTþwith --gapopen 1 --gapextend 1 parameters. We accepted any blast hsp with a length4800 bp as supporting
the junction (because these must contain at least 300 bp at each side of the break point). Four inversions and three translocations gained support from these searches (Supplementary Table 2—PCR.xlsx).
Knockout strain control
.
Our sample of sequenced strains included one strain (JB374) that is known to contain deletions of thehis3andura4genes. Our variant calling and validation methods identified only two variants in this strain, both deletions that corresponded to the positions of these genes, as below:his3gene location is chromosome II, 1489773-1488036, deletion detected at II:1488228-1489646.
ura4gene location is chromosome III, 115589-116726, deletion detected at III:115342-117145.
This strain was not included in the further analyses of the SVs.
Microarray expression analysis
.
Cells were grown in YES (Formedium, UK) and harvested at OD600¼0.5. RNA was isolated followed by cDNA labelling63. Agilent815K custom-madeS. pombeexpression microarrays were used. Hybridization, normalization and subsequent washes were performed according to the manufacturer’s protocols. The obtained data were scanned and extracted using GenePix and processed for quality control and normalization using in-house developed R scripts. Subsequent analysis of normalized data was performed using R. Microarray data have been submitted to ArrayExpress (accession number E-MTAB-4019). Genes were considered as induced if their expression signal after normalization was41.9, and repressed ifo0.51.
Time to most recent common ancestor (TMRCA) estimates
.
Previously, based on the genetic distances between these strains and the ‘dated tip’ dating method implemented in BEAST64, we have estimated the divergence times betweenall 161S. pombestrains sequenced17. To determine the TMRCA for pairs of strains, we re-examined the BEAST outputs using FigTree to obtain the medium and 95% confidence intervals.
SNP and indel calling
.
SNPs were called as described17. Insertions and deletions (indels) were called in 160 strains using stampy-mapped, indel-realigned bams as described previously17. We accepted indels that were called by both the GenomeAnalysis Toolkit HaplotypeCaller65and Freebayes66, and then genotyped all these calls with Freebayes.
Briefly, indels were called on each strains bam with HaplotypeCaller, and filtered for call quality430 and mapping quality430 (bcftools filter --include
’QUAL430 && MQ430’). Separately, indels were called on each strains bam
with Freebayes, and filtered for call quality430. All Freebayes vcf files were
merged, accepting only positions called by both Freebayes and HaplotypeCaller. These indels were then genotyped with Freebayes using a merged bam (containing reads from all strains), using the --variant-input flag for Freebayes to genotyped only the union calls. Finally indels were filtered for by score, mean reference mapping quality and mean alternate mapping quality430 (bcftools filter
--include ’QUAL430 && MQM430 & MQMR430’). These methods identified
32,268 indels. Only 50 of these segregated between Leupold’s h-reference (JB22)
and Leupold’s h90reference (JB50), whereas 12109 indels segregated between the
JB22 reference and the divergent strain JB916.
Heredity and GWAS
.
We analysed 228 traits, including those described previously17, and three wine traits32. Trait values were normalized using a rank-based transformation in R, for each trait vectory, normal.y¼qnorm(rank(y)/ (1þlength(y))). Total heritability, and the contribution of SNPs, CNVs and rearrangements were estimated using LDAK (version 5) (ref. 67), with kinship matrices derived from all SNPs, 146 CNVs and 15 rearrangements. All genotypes, including CNVs were encoded as binary values (1 or 0) for heritability and GWAS. To assess whether the contribution of CNVs could be primarily due to linkage with causal SNPs, we simulated trait data using the --make-phenos function of LDAK with the relatedness matrix from all SNPs, assuming that all variants contributed to the trait (--num-causals -1). We made one simulated trait data set per trait, for each of the 2 traits, with total heritability defined as predicted from the real data. We then estimated the heritability using LDAK, including the joint matrix of SNPs, CNVs and rearrangements. To assess the extent to which the contribution of SNPs to heritability was overestimated, we performed another simulation using the relatedness matrix from the 87 segregating CNVs alone, and then estimated the contribution of SNPs, CNVs and rearrangements in this simulated data as above.Genome-wide associations were performed with LDAK using default parameters. To account for the unequal relatedness of strains, we used a kinship matrix derived from all 172,368 SNPs called previouslyJeffareset al.17Association analysis was used to find associations between traits, testing SVs, SNPs and indels with a minor allele countZ5. Analysis was run separately for 68 SVs, 139,396 SNPs and 22,058 indels (each used the kinship derived from all SNPs). We examined the same 53 traits as for the heritability analysis (above). For each trait, we carried out 1,000 permutations of trait data, and define the 5th percentile of these permutations as the trait-specificPvalue threshold.
Model details for Heritability and GWAS Analysis
.
To estimate the heritability contribution of SNPs, we computed a kinship matrix (KSNP) using all 172,368 SNPsthat we had discovered in our previous published analysis17(elements of this matrix represent pairwise allelic correlations across all SNPs)67, onto which we
regressed the phenotypic values assuming the following model:
Y N 0;KSNPs2SNPþs2eI
We estimated the two variance components,s2
SNPands2e, using REML (restricted
maximum-likelihood), based on which our estimates of the heritability of SNPs is
s2 SNP
s2
SNPþs2e
To estimate the heritability of CNVs and rearrangements, we repeated this analysis using instead KCNVthen KREA, computed using only 146 segregating CNVs and 15
segregating rearrangements, respectively. We additionally considered the model
Y N 0;KSNPs
2
SNPþKCNVs2CNVþKREAs2<Aþs2eI
; Having estimated the four variance components, again using REML, the relative contributions of SNPs, CNVs and rearrangements are, respectively,
s2 SNP
S ;
s2 CNV
S and
s2 REA
S
whereS¼s2
SNPþs2CNVþs2REA.
For the mixed model association analysis, we used the same the SNP kinship matrix. As the predictors (variants that we examined for effects on a trait), we chose to analyse SNPs, indels and SVs with a minor allele count
Z5 (68 SVs, 139,396 SNPs and 22,058 indels). Then for each predictorXjwe considered the model
YNðbjXjKSNPs2SNPþs2eIÞ;
wherebjis the effect size of predictorXj
Having solved using REML, we used a likelihood ratio test (comparing to the null model (bj¼0) to assess whetherbjis significantly nonzero. Each of these
analyses used the kinship derived from all SNPs.
Offspring viability and genetic distance
.
Cross spore viability data and self-mating viability were collected from previous analyses6,17. The number ofdifferences between each pair was calculated using vcftools vcf-subset56, and
correlations were estimated using R, with the ppcor package. When calculating the number of CNVs differences between strains, we altered our criteria for ‘different’ variants (to merge variants whose starts and ends where within 1 kb), and merged CNVs if their overlap was450% and their allele calls were the same.
Transience analysis
.
For each CNV, we extracted all SNPs from 20 kb upstream and 20 kb downstream. 86/87 CNVs showed variation in these regions (DUP.MT:1..19382 was the only CNV with no corresponding SNPs). We then used these concatenated SNPs to build a local SNP-based tree with FastTree (version 2.1.9) (ref. 68). To build a CNV-based tree from the copy number variation in each CNV region, we used a neighbour-joining tree estimation based on the Euclidean distances between strains.The total branch length of the CNV-based tree was strongly correlated (Spearman rank correlationr¼0.90,Po0.001) with the standard deviation of
copy number variation (Supplementary Fig. 4). We therefore used this standard deviation to define a relative rate of transience for each cluster,src¼sic/soc, where
sicandsocare the within cluster and without cluster standard deviations,
respectively, meaning that CNVs which were highly relatively transient within a given cluster would have high values ofsrc. This was used to select the
three CNVs visualized in Fig. 2c. See Supplementary Table 2 for all values ofsrc, Supplementary Fig. 4 for visualization as heatmap. Visualizations
of all 86/87 CNVs with their SNP-based phylogenies are available at: https://figshare.com/projects/fission_yeast_structural_variation/15798.
Circle plots were used to visualize the variation in copy number over the SNP-based phylogeny for each CNV using Anvi’o (version 2.0.3)69.
Data availability
.
Sequence data are archived in the European Nucleotide Archive under study accessions PRJEB2733 and PRJEB6284. SNP, indel and SVs calls, genotypes and copy numbers are available on Figshare at: https://figshare.com/ projects/fission_yeast_structural_variation/15798.Array data is available at ArrayExpress, accession number: E-MTAB-4019.
References
1. Chen, C.et al.A comprehensive survey of copy number variation in 18 diverse pig populations and identification of candidate copy number variable genes associated with complex traits.BMC Genomics13,733 (2012).
2. Stefansson, H.et al.CNVs conferring risk of autism or schizophrenia affect cognition in controls.Nature505,361–366 (2014).
3. Wang, Y.et al.Copy number variation at the GL7 locus contributes to grain size diversity in rice.Nat. Genet.47,944–948 (2015).
4. Zhang, F., Gu, W., Hurles, M. E. & Lupski, J. R. Copy number variation in human health, disease, and evolution.Annu. Rev. Genomics Hum. Genet.10,
451–481 (2009).
5. Zhang, H.et al.Gene copy-number variation in haploid and diploid strains of the yeastSaccharomyces cerevisiae.Genetics193,785–801 (2013).
6. Avelar, A. T., Perfeito, L., Gordo, I. & Ferreira, M. G. Genome architecture is a selectable trait that can be maintained by antagonistic pleiotropy.Nat. Commun.4,2235 (2013).
7. Brown, W. R.et al.A geographically diverse collection of schizosaccharomyces pombe isolates shows limited phenotypic variation but extensive karyotypic diversity.G3 (Bethesda)1,615–626 (2011).
8. McGaugh, S. E. & Noor, M. A. Genomic impacts of chromosomal inversions in parapatricDrosophilaspecies.Philos. Trans. R. Soc. Lond. B Biol. Sci.367,
422–429 (2012).
9. Rieseberg, L. H. Chromosomal rearrangements and speciation.Trends Ecol. Evol.16,351–358 (2001).
10. Ayala, D., Guerrero, R. F. & Kirkpatrick, M. Reproductive isolation and local adaptation quantified for a chromosome inversion in a malaria mosquito.
Evolution67,946–958 (2013).
11. Stevison, L. S., Hoehn, K. B. & Noor, M. A. Effects of inversions on within- and between-species recombination and divergence.Genome Biol. Evol.3,830–841 (2011).
12. Liti, G., Barton, D. B. & Louis, E. J. Sequence diversity, reproductive isolation and species concepts inSaccharomyces.Genetics174,839–850 (2006). 13. Hou, J., Friedrich, A., de Montigny, J. & Schacherer, J. Chromosomal
rearrangements as a major mechanism in the onset of reproductive isolation in
Saccharomyces cerevisiae.Curr. Biol.24,1153–1159 (2014).
14. Leducq, J. B.et al.Speciation driven by hybridization and chromosomal plasticity in a wild yeast.Nat. Microbiol.1,15003 (2016).
15. Ortiz-Barrientos, D., Engelstadter, J. & Rieseberg, L. H. Recombination rate evolution and the origin of species.Trends Ecol. Evol.31,226–236 (2016). 16. Fawcett, J. A.et al.Population genomics of the fission yeast
Schizosaccharomyces pombe.PLoS ONE9,e104241 (2014). 17. Jeffares, D. C.et al.The genomic and phenotypic diversity of
Schizosaccharomyces pombe.Nat. Genet.47,235–241 (2015).
18. Zanders, S. E.et al.Genome rearrangements and pervasive meiotic drive cause hybrid infertility in fission yeast.Elife3,e02630 (2014).
19. Wood, V.et al.The genome sequence ofSchizosaccharomyces pombe.Nature 415,871–880 (2002).
20. Sabatinos, S. A. & Forsburg, S. L. Molecular genetics ofSchizosaccharomyces pombe.Methods Enzymol.470,759–795 (2010).
21. Kim, D. U.et al.Analysis of a genome-wide set of gene deletions in the fission yeastSchizosaccharomyces pombe.Nat. Biotechnol.28,617–623
ð2010Þ:
22. Marguerat, S.et al.Quantitative analysis of fission yeast transcriptomes and proteomes in proliferating and quiescent cells.Cell151,671–683 (2012). 23. Ryan, C. J.et al.Hierarchical modularity and the evolution of genetic
interactomes across species.Mol. Cell46,691–704 (2012).
24. Klambauer, G.et al.cn.MOPS: mixture of Poissons for discovering copy number variations in next-generation sequencing data with a low false discovery rate.Nucleic Acids Res.40,e69 (2012).
25. Layer, R. M., Chiang, C., Quinlan, A. R. & Hall, I. M. LUMPY: a probabilistic framework for structural variant discovery.Genome Biol.15,R84 (2014). 26. Rausch, T.et al.DELLY: structural variant discovery by integrated paired-end
and split-read analysis.Bioinformatics28,i333–i339 (2012).
27. Ye, K., Schulz, M. H., Long, Q., Apweiler, R. & Ning, Z. Pindel: a pattern growth approach to detect break points of large deletions and medium sized insertions from paired-end short reads.Bioinformatics25,2865–2871 (2009).
28. Bergstrom, A.et al.A high-definition view of functional genetic variation from natural yeast genomes.Mol. Biol. Evol.31,872–888 (2014).
29. Dunn, B., Richter, C., Kvitek, D. J., Pugh, T. & Sherlock, G. Analysis of the
Saccharomyces cerevisiaepan-genome reveals a pool of copy number variants distributed in diverse yeast strains from differing industrial environments.
Genome Res.22,908–924 (2012).
30. Bitton, D. A.et al.AnGeLi: a tool for the analysis of gene lists from fission yeast.Front. Genet.6,330 (2015).
31. Chikashige, Y.et al.Gene expression and distribution of Swi6 in partial aneuploids of the fission yeastSchizosaccharomyces pombe.Cell Struct. Funct. 32,149–161 (2007).
32. Benito, A.et al.SelectedSchizosaccharomyces pombestrains have characteristics that are beneficial for winemaking.PLoS ONE11,e0151102 (2016). 33. Dobzhansky, T. On the sterility of the interracial hybrids inDrosophila
pseudoobscura.Proc. Natl Acad. Sci. USA19,397–403 (1933).
34. Muller, H. J. Reversibility in evolution considered from the standpoint of genetics.Biol. Rev.14,261–280 (1939).
35. Fischer, G., Rocha, E. P., Brunet, F., Vergassola, M. & Dujon, B. Highly variable rates of genome rearrangements between hemiascomycetous yeast lineages.
PLoS Genet.2,e32 (2006).
36. Gordon, J. L., Byrne, K. P. & Wolfe, K. H. Additions, losses, and rearrangements on the evolutionary route from a reconstructed ancestor to the modernSaccharomyces cerevisiaegenome.PLoS Genet.5,e1000485 (2009).
37. Delneri, D.et al.Engineering evolution to study speciation in yeasts.Nature 422,68–72 (2003).
38. Noor, M. A., Grams, K. L., Bertucci, L. A. & Reiland, J. Chromosomal inversions and the reproductive isolation of species.Proc. Natl Acad. Sci. USA 98,12084–12088 (2001).
39. Naseeb, S. & Delneri, D. Impact of chromosomal inversions on the yeast DAL cluster.PLoS ONE7,e42022 (2012).
40. Naseeb, S.et al.Widespread impact of chromosomal inversions on gene expression uncovers robustness via phenotypic buffering.Mol. Biol. Evol.33,
1679–1696 (2016).
41. Zhu, Y. O., Sherlock, G. & Petrov, D. A. Whole genome analysis of 132 clinicalSaccharomyces cerevisiaestrains reveals extensive ploidy variation.
G3 (Bethesda)6,2421–2434 (2016).
42. Gallone, B.et al.Domestication and divergence ofSaccharomyces cerevisiae
beer yeasts.Cell166,1397–1410 e1316 (2016).