1
Assessing the expected value of research studies in
reducing uncertainty and improving implementation
dynamics
Running title: Assessing the dynamic value of research
Authors:
Sabine E. Grimm (PhD)a,b (corresponding author) Simon Dixon (PhD)c
John W Stevens (PhD)c
a
Department of Clinical Epidemiology and Medical Technology Assessment (KEMTA), Maastricht University Medical Center
Oxfordlaan 10 6202 AZ Maastricht b
Tel (+31) (0)433875129 Email: [email protected] c
School of Health and Related Research, University of Sheffield Regent Court, 30 Regent Street
Sheffield, S1 4DA
Word count total: 4,832
2
ABSTRACT
Background: With low implementation of cost-effective health technologies being a problem in many health systems, it is worth considering the potential effects of research on implementation at the time of health technology assessment. Meaningful and realistic implementation estimates must be of dynamic nature.
Objective: To extend existing methods for assessing the value of research studies in terms of both reduction of uncertainty and improvement in implementation by considering diffusion based on expert beliefs with and without further research conditional on the strength of evidence.
Methods: We use expected value of sample information and expected value of specific implementation measure concepts accounting for the effects of specific research studies on implementation and the reduction of uncertainty. Diffusion theory and elicitation of expert beliefs about the shape of diffusion curves inform implementation dynamics. We illustrate the use of
resulting dynamic expected value of research in a pre-term birth screening technology and results are compared with those from a static analysis.
Results: Allowing for diffusion based on expert beliefs had a significant impact on the expected value of research in the case study, suggesting that mistakes are made where static implementation levels are assumed. Incorporating the effects of research on implementation resulted in an increase in the expected value of research compared to expected value of sample information alone.
3 Introduction
Implementation of new health technologies has been noted to be low in many countries(1-3). While this is commonly highlighted as a brake on innovation, it also leads to inefficiencies in the health system when the new technologies have been shown to be cost-effective. These inefficiencies pose a burden to the payer in terms of money lost that could be spent more effectively elsewhere, and to patients in terms of health lost. In the United Kingdom (UK) National Health Service, for instance, getting cost-effective technologies into practice has been declared a priority(2). Despite this, there is no standardised procedure in place in the UK that allows an evaluation of implementation measures at the time of health technology assessment(4). In fact, the National Institute for Health and Care Excellence (NICE) does not have a mandate to recommend implementation measures, although it can recommend that further research be conducted if there is large decision uncertainty(4).
Such Recommendation with Research (RwR) or Only in Research decisions can be considered using an existing framework on coverage decisions(5, 6) and can be assessed for their value using expected value of information (EVI) methods(7). However, to our knowledge, the EVI methods used in practice do not consider the effect that the recommended research studies may have on the dynamics of health technology implementation, although other research has shown this to be possible(8). This is an omission because further evidence can influence the implementation of a new health technology(8) and reduce the opportunity cost that low implementation poses to the payer. Research can be designed to address decision uncertainty present in technology assessments, and to improve implementation(8, 9), thereby improving the use of strategies and resources in a budget constrained health system(10). Acknowledging the importance of health technology implementation to the design of research studies, the effect of imperfect implementation on the value of research studies has been considered
previously(8, 11). Willan and Eckermann(8) provide an important contribution to decision-making by presenting a framework for estimating the value of research allowing for imperfect implementation, and by modelling the effect of research evidence on implementation as a function of the strength of evidence. The authors use an analytic solution to calculate the expected value of sample information (EVSI), assuming normality of the expected incremental net benefit distributions(8). The authors further demonstrate that the optimal research design could be found by maximising the expected net gain (that is the EVSI compared to trial costs) associated with different designs(8). The authors found that the EVSI increased with imperfect implementation, which was explained by the expected
opportunity loss increasing with imperfect implementation (where a proportion of patients are on the treatment that is expected to be less cost-effective) and the positive effect of research evidence on implementation. In contrast to this, another study that incorporated imperfect implementation in EVSI calculations asserted that EVSIs without adjustments for imperfect implementation are
4 counterfactual cases with and without further trial evidence(13) and extending an existing
framework(9) by adding further static frames(13).
For research studies or implementation strategies that were evaluated in the past, the dynamic nature of implementation was not considered. Instead, the future levels of implementation that could be expected with investment in implementation measures and research were modelled as though fixed levels of implementation arose immediately with such investment and remained at the same current level without investment(8, 14, 15). A further limitation of some research studies is the omission of the counterfactual development of implementation of doing nothing(14). Only two studies have attempted to model implementation dynamics and included a counterfactual. One fitted simple regression methods to extrapolate future implementation(16) without linking to existing diffusion theory(17); and another study extrapolated an s-shaped curve with a passing reference to diffusion theory but without any behavioural parameterisation of it(18). The reason for these omissions may be because the estimation of potentially low and changing implementation in the future can be
challenging, especially when the technology has not been introduced(19), and effects of any implementation measures, including research, on implementation are difficult to predict.
We extend the Willan and Eckermann(8) framework by a) allowing implementation to adopt different values in future periods through the incorporation of diffusion curves, b) replacing the assumed functional relationship between strength of research evidence on implementation by evidence obtained by elicitation of experts’ beliefs, c) using an alternative to the Central limit theorem
method(8) for the estimation of EVSI and d) maintaining a distinction between the expected value of information and implementation proposed by Fenwick et al.(9). Extensions a) and b) have the
potential to improve the accuracy of value of research estimates. We are only examining the effects of strength of evidence on diffusion, rather than the effects of different research outcomes. This implies that diffusion is assumed to be independent of study results. Extension c) is made for illustration purposes, to provide an alternative to parametric methods particularly for those analysts who wish to allow for non-normal incremental net benefit distributions. Extension d) is useful for decision-makers who also consider implementation strategies other than research because reimbursement authorities may be interested in the expected opportunity loss associated with both low implementation and uncertainty.
5 Methods
The measures of expected value of information and implementation
Most health technology assessments are associated with decision uncertainty that results from a limited evidence base. Expected Value of Information (EVI) methods can estimate the magnitude of the cost linked with decision uncertainty on a monetary or health scale(20). The Expected Value of Perfect Information (EVPI) is the expected value of reducing all uncertainty present in a decision. With implementation being less than perfect, the expected value of achieving full implementation of the best technology is of interest. This has been referred to as the Expected Value of Perfect
Implementation (EVPIM)(9). The EVPIM reflects the losses that the payer will incur because less cost-effective technologies remain partially implemented.
6 Assessing the value of research designs considering imperfect implementation
The value of a particular research study can be calculated using the Expected Value of Sample Information (EVSI)(8, 22, 23) and is given by:
𝐸𝑉𝑆𝐼 = 𝔼𝑋[𝑚𝑎𝑥𝑑𝔼𝜃|𝑋{𝑁𝐵(𝑑|𝜃)}] − 𝑚𝑎𝑥𝑑𝔼𝜃{𝑁𝐵(𝑑, 𝜃)} (1)
where 𝔼𝜃|𝑋𝑁𝐵(𝑑|𝜃) is the expected net monetary benefit of technology d given the uncertain model input parameters 𝜃 and data X are informative for the input parameters 𝜃.
If implementation is assumed perfect, the resulting EVSI underestimates the true value of research(8). To allow estimation of the expected value of research that allows for both the effects of reductions in uncertainty and improving implementation, we consider the Expected Value of Specific
Implementation Measures (EVSIM)(8, 9). The EVSIM is given by:
𝐸𝑉𝑆𝐼𝑀 = ∑ 𝜌𝑑𝐼𝑀 𝐷
𝑑=1
𝔼𝜃𝑁𝐵(𝑑, 𝜃) − ∑ 𝜌𝑑𝐶 𝐷
𝑑=1
𝔼𝜃𝑁𝐵(𝑑, 𝜃) (2)
where 𝜌𝑑𝐶 is the probability of implementing technology d with current information, and 𝜌𝑑𝐼𝑀 is the implementation with a certain implementation measure IM for technology d.
7 uncertainty. Both effects are independent of each other because they are inherently different: the value of a reduction of uncertainty (EVSI) is calculated by considering what the value of a decision would be under current information and subtracting that from the value of a decision made with future evidence, when we would make a better decision in a greater proportion of PSA runs. The value of improved implementation (EVSIM), however, neglects the reduction of uncertainty and only assesses the value of research in terms of its effect on implementation (proof in appendix Equation (A.2)). Adding both together ensures that both effects are captured in the value of research.
The EVR is therefore the sum of the EVSIM and the EVSI of the proposed research study, which is analogous to the EVP being the sum of the EVPIM and the EVPI:
𝐸𝑉𝑅 = 𝐸𝑉𝑆𝐼(𝑅𝑒𝑠𝑒𝑎𝑟𝑐ℎ) + 𝐸𝑉𝑆𝐼𝑀(𝑅𝑒𝑠𝑒𝑎𝑟𝑐ℎ) (3)
When accrued over the affected patient population over all periods until the time horizon at which the decision ceases to be relevant, the value measures of information, implementation and research (summarised in Table 1) can be compared to the costs associated with the research study(21). The research is then worth doing if the population EVR exceeds its cost.
Incorporating diffusion curves in EVR analysis
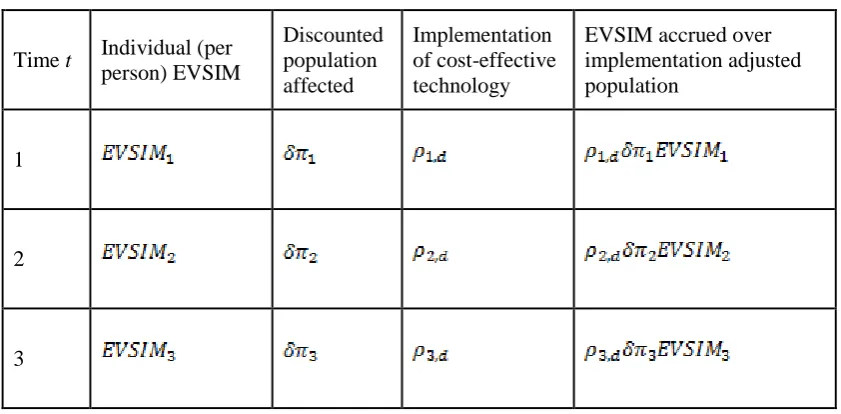
Health technology implementation changes over time, following a process that is called diffusion(3, 24). With implementation levels varying over periods of time, the different value of implementation measures (Table 1) will also vary across each period. We use the EVSIM as an illustrative example for how diffusion can be incorporated in the calculations of value of implementation measures in Table 2. If utilisation of intervention A was at 2% in the first year, then utilisation of comparators B and C would be at 49% each (assuming equal utilisation for the two remaining technologies, due to a lack of knowledge that suggests otherwise), and the EVSIM would be calculated accordingly. In the second year, implementation of A might be at 10%, resulting in 45% of implementation of B and C, and so on. When accrued over the population, the population size needs to be adjusted by the proportion of patients that receives the new intervention. If this is not done, the population value of the EVSIM that the payer will incur is over-estimated because it is accrued over patients that do not benefit from the implementation measure.
8
𝐸𝑉𝑆𝐼𝑀𝑑𝑦𝑛 =1
𝑇∑ 𝜌𝑡,𝑑𝑋 𝜋𝑡𝐸𝑉𝑆𝐼𝑀𝑡 𝑇
𝑡=1
(4)
with 𝜌𝑡,𝑑𝑋 being the mix of achievable implementation of technologies d with research evidence X in each time period t, where t=1,…,T is the time period up to the defined time horizon T, in years, and 𝜋𝑡 is the estimate of the eligible population in each t.
The dynamic EVR analysis applied in a case study in pre-term birth screening
The dynamic EVR analysis is applied in a genuine but anonymised case study of a new pre-term birth screening technology that is currently in development. We refer to the new technology as technology A and the comparators are technologies B and C, where technology C is no screening. When patients are tested positive, they undergo treatment that could help prevent pre-term birth. Three health states are possible outcomes of the model. The screening technologies, treatments and health states are associated with costs, and the health states are associated with utilities presented as quality-adjusted life years (QALYs). The expected incremental cost-effectiveness ratios (ICERs) and net monetary benefits are calculated using probabilistic sensitivity analysis (PSA), based on 10,000 simulations. All costs and QALYs are scaled to a per person level and costs are presented in GBP (the exchange rate was GBP £1 = USD $1.53 on 28 Oct 2015).
Two research studies have previously been identified to be relevant to the adoption decision of technology A (subsequently referred to as Study I and Study II). Study I studies the predictive ability of technology A and Study II the response to treatment after screening with technology A. To
facilitate assessing the EVR, information is needed on implementation estimates for the counterfactual cases with and without these research studies. We drew on diffusion theory that suggests that
cumulative diffusion of new technologies typically follows a sigmoid curve(17). Implementation estimates following such curves were obtained from an elicitation of experts’ beliefs about parameters that informed an established model of technology diffusion, i.e. the Bass model of technology
9 generated. This process was undertaken for the following scenarios: 1. baseline diffusion scenario (the counter-factual without executing any implementation initiatives), 2. diffusion scenario with Study I completed, 3. diffusion scenario with Study II completed, and 4. diffusion scenario with both studies I and II completed.
For comparisons with the static analysis, we use the estimate of the maximum attainable number of adoptions for the four scenarios that were obtained from the same elicitation study. A diffusion scenario for perfect information that is relevant to the calculation of the research EVPIM is generated using modifying assumptions on the elicited diffusion curves. To extrapolate the per person values to the population, we use the population of women with a pre-term birth (approximately 20,000 per year, based on the prevalence of pre-term birth(27) and the number of births in England(28)). We use a time horizon of five years, reflecting the relatively quick change in the medical devices landscape(29). The EVSI is calculated using clinical trial simulation(22, 23, 30). We use sample sizes of 300 patients in both studies and generate a sample of data from a binomial distribution for each draw from the PSA for each study. In Study I, we simulate the proportion of those tested positive with a pre-term birth and those tested negative with no pre-term birth (sensitivity and specificity). In Study II, we simulate the proportion of women responding to treatment compared with no treatment, with patients
randomised equally to the two trial arms. We then calculate the EVSI values for both research studies using the GAM regression method(23). The funding source had no role in this study.
Results
Results of baseline cost-effectiveness analysis
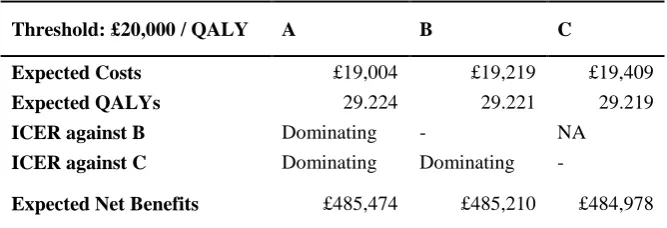
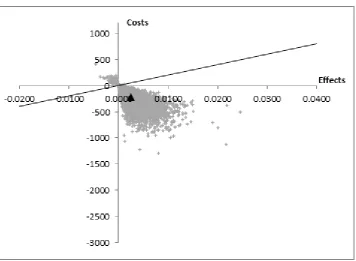
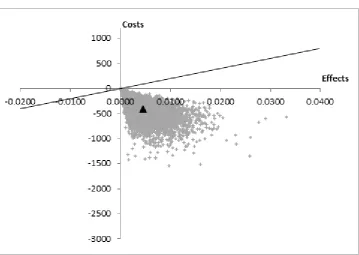
Based on the PSA, technology A is expected to be dominating against both technologies B and C, reflecting that it is cost-saving and providing a QALY gain. Technology A is therefore the technology with the highest expected net monetary benefit (Table 3). The results presented in Table 3 are
associated with little uncertainty as shown in Figures 1 and 2. Only three percent of the joint
10 of individual organisations that pay more upfront and do not gain from cost reductions associated with the effectiveness of the intervention.
Results of the dynamic EVR analysis
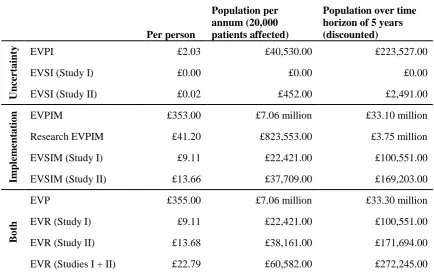
The above analysis shows that decision uncertainty is small. This is supported by the small per person EVPI (Table 4). However, the magnitude of the affected population means that the population EVPI is not negligible. The opportunity loss caused by low implementation is larger than that caused by uncertainty (Table 4). This is because implementation of the dominating technology A is going to be low (at 30%) and there is little uncertainty that technology A is much better than its alternatives. The low implementation in this case study is caused by a variety of issues, including the limited evidence base for technology A in spite of the small decision uncertainty. Not resolving low implementation would represent an opportunity cost to the payer of up to £33 million at the population level (Table 4). A significant part of the EVPIM could be addressed through additional research because of the large research EVPIM. The EVPI and EVPIM alone are not sufficient conditions for decision-making, as research could have zero cost(21). The value of further research can thus only be assessed using the EVR and comparing this to its cost(21).
The EVR (that consists of both the EVSIs and EVSIMs) relating to Studies I and II is £100,000 and £172,000, respectively. Assuming research costs of £300,000 for both Study I and Study II, both studies would yield a negative expected net gain and are thus not worth pursuing. At cheaper costs or longer time horizons, these studies may become feasible. The EVR of both research studies amounts to 7% of the EVP at the per person level but to less than 1% of the EVP at the population level. This reduction in the value of the research studies compared to the EVP at the population level is caused by the EVR only being accrued for those patients who receive technology A. The largest part of the EVP is explained by the EVSIM because the EVSI is small for both Studies I and II. The EVSIM values are larger than the EVSI of the trials, demonstrating that the value of the research studies relate mainly to their associated increase in implementation of the most cost-effective technology A. This is a result of the little decision uncertainty and of the experts’ beliefs on diffusion of technology A with and without further research.
Comparison of static and dynamic analyses
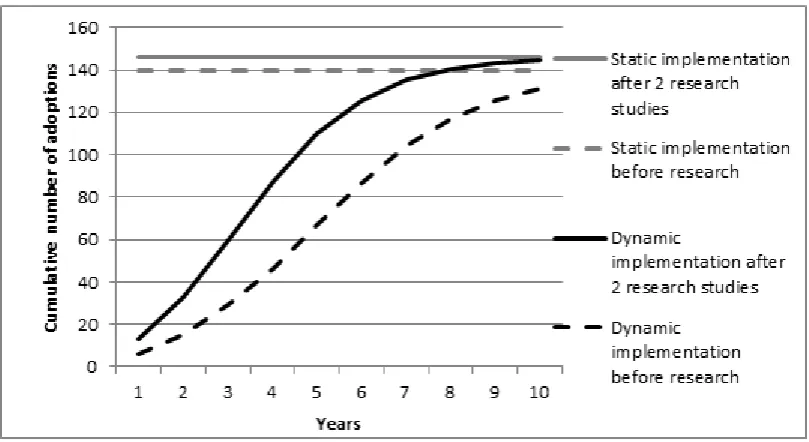
11 both EVSIMs) and in one case the dynamic value is smaller (research EVPIM). The reason for the differing values is that they are driven by the difference between the counterfactual with and without research implementation. Static estimates only capture a temporary snapshot of the dynamic
development of implementation over time that may not accurately reflect the dynamic average difference between the counterfactual with and without curves. An example of this is illustrated through the combined effect of both research Studies I and II on implementation in Figure 3. In the static analysis, it was assumed that the recommendation decision was followed by an immediate jump to the baseline scenario maximum attainable number of adoptions, shown by the dashed grey line. Further research studies on the treatment effect and the predictive ability of A before the research recommendation would result in immediate implementation shown by the solid grey line in Figure 3. Taking the difference of these estimates resulting from this “snapshot” is clearly not representative of the average difference between the two dynamic implementation curves (shown in dashed black for no further research and solid black for Studies I and II in Figure 3). The difference between the dynamic curves is driven more by the timing at which gains in implementation occur rather than the gain in absolute numbers of cumulative adoptions.
Discussion
We have presented an extension to an existing framework for estimating the value of research studies when considering the effect of new research evidence on implementation(8) by allowing
implementation to be dynamic through the incorporation of diffusion curves and by replacing
assumptions surrounding the functional relationship between strength of evidence and implementation by evidence obtained from elicitation of expert opinion. As such, the value of this study lies in both, the further development of EVSI methods as well as in providing an extension to applications of the expected value of implementation(14, 16, 18) that have not quantified the dynamics of
12 research: its effect on the reduction of decision uncertainty as well as its effect on the improvement of implementation, as was done in this study and has been done previously(8).
In practical terms this analysis could have a substantial effect on recommendation with research decisions, which are a type of managed entry agreement used by reimbursement authorities and manufacturers to agree on a process of recommending a new technology(5-7). With this analysis, the value of research is not limited to its impact on decision uncertainty, which can be estimated by the EVSI, but includes the associated value of increased implementation. Of course, a RwR decision requires other preceding analyses(5, 6) to ensure it produces a positive net monetary benefit,
13 dynamic estimates of research value are greatest. This would help with prioritising any use of the dynamic EVR analysis in future decision making processes.
Optimisation methods have previously been proposed to identify the optimal study design and sample size(8, 31). In further research, our proposed dynamic EVR analysis could be used to choose the best design among a set of designs, although an optimal design cannot be guaranteed, due to a lack of knowledge on the functional relationship between information and implementation. Despite this, we think that we have proposed an important improvement in how the value of research should be estimated. Functional relationships of proxies for strength of evidence and implementation are unlikely to capture the behavioural and information processing factors underlying institutional and individual decision-making. Our elicitation method is much more likely to capture these, but eliciting a large number of different diffusion curves may not be feasible due to time and resource constraints. Further research should be done on finding ways of quantifying the effects of different study designs on implementation, thus potentially enabling trial design optimisation.
14 References
1. OECD Health Project. Health Technologies and Decision Making. Paris and Washington, D C Organisation for Economic Co-operation and Development, 2005.
2. Department of Health. Innovation Health and Wealth, Accelerating Adoption and Diffusion in the NHS. Department of Health, NHS Improvement and Efficiency Directorate, Innovation and Service Improvement, 2011.
3. Packer C, Simpson S, Stevens A. International diffusion of new health technologies: a ten country analysis of six health technologies. Int J Technol Assess Health Care. 2006;22(4):419-28. 4. NICE. Guide to the methods of technology appraisal 2013. London: NICE; 2013.
5. Walker S, Sculpher M, Claxton K, Palmer S. Coverage with evidence development, only in research, risk sharing or patient access scheme? A framework for coverage decisions. York: Centre for Health Economics, University of York, 2012.
6. Walker S, Sculpher M, Claxton K, Palmer S. Coverage with evidence development, only in research, risk sharing, or patient access scheme? A framework for coverage decisions. Value in Health. 2012;15(3):570-9.
7. Grimm S, Strong M, Brennan A, Wailoo A. Framework for analysing risk in health technology assessments and its application to managed entry agreements. Sheffield: ScHARR, University of Sheffield, 2016.
8. Willan AR, Eckermann SB. Optimal Clinical Trial Design Using Value Of Information Methods With Imperfect Implementation. Health Economics. 2010;19(5):549-61.
9. Fenwick E, Claxton K, Sculpher M. The value of implementation and the value of information: combined and uneven development. Medical Decision Making. 2008;28(1):21-32. 10. Eckermann S, Pekarsky B. Can the Real Opportunity Cost Stand Up: Displaced Services, the Straw Man Outside the Room. Pharmacoeconomics. 2014;32(4):319-25. doi: 10.1007/s40273-014-0140-3. PubMed PMID: WOS:000335757400002.
11. Kent S, Briggs A, Eckermann S, Berry C. ARE VALUE OF INFORMATION METHODS READY FOR PRIME TIME? AN APPLICATION TO ALTERNATIVE TREATMENT
STRATEGIES FOR NSTEMI PATIENTS. Int J Technol Assess Health Care. 2013;29(4):435-42. doi: 10.1017/s0266462313000433. PubMed PMID: WOS:000327600700015.
12. Andronis L, Barton P. Adjusting estimates of the expected value of information for
implementation: theoretical framework and practical application. Med Decis Making. 2016;36(3):296-307. PubMed Central PMCID: PMCNovember 2015.
13. Eckermann S, Willan AR. Expected Value of Sample Information with Imperfect Implementation: Improving Practice and Reducing Uncertainty with Appropriate Counterfactual Consideration. Med Decision Making. 2016;36(3):282-3.
14. Hoomans T, Fenwick E, Palmer S, Claxton K. Value of Information and Value of
Implementation: Application of an Analytic Framework to Inform Resource Allocation Decisions in Metastatic Hormone-Refractory Prostate Cancer. Value in Health. 2009;12(2):315-24.
15. Walker S, Faria R, Whyte S, Dixon S, Palmer S, Sculpher M. Getting cost-effective technologies into practice: the value of implementation. Report on framework for valuing implementation initiatives. University of York: EEPRU, 2014 Contract No.: 24.
16. Faria R, Walker S, Whyte S, Dixon S, Palmer S, Sculpher M. Getting cost-effective
15 18. Whyte S, Dixon S, Faria R, Walker S, Palmer S, Sculpher M. Getting cost-effective
technologies into practice: the value of implementation: An application to B-type natriuretic peptide (BNP) testing in diagnosing chronic heart failure. University of Sheffield: EEPRU, 2014.
19. Serra-Sastre V, McGuire A. Diffusion of health technologies: evidence from the
pharmaceutical sector. The Economics of New Health Technologies: Incentives, organization, and financing. 1. New York: Oxford University Press; 2009.
20. Briggs AH, Claxton K, Sculpher M. Decision Modelling for Health Economic Evaluation. Gray A, Briggs AH, editors. New York: Oxford University Press; 2006.
21. Eckermann S, Karnon J, Willan AR. The Value of Value of Information Best Informing Research Design and Prioritization Using Current Methods. Pharmacoeconomics. 2010;28(9):699-709. PubMed PMID: WOS:000282157300001.
22. Brennan A, Kharroubi SA. Efficient computation of partial expected value of sample information using Bayesian approximation. J Health Econ. 2007;26(1):122-48. PubMed PMID: 16945438.
23. Strong M, Oakley J, Brennan A, Breeze P. Estimating the Expected Value of Sample Information Using the Probabilistic Sensitivity Analysis Sample: A Fast Nonparametric Regression-Based Method. Medical Decision Making. 2015;35(5):570-83.
24. Essat M, Faria R, Gomersall T, Grimm S, Keetharuth A, Walker S, et al. Getting
cost-effective technologies into practice: the value of implementation - Report on initial scoping review for Phase 1. Sheffield: EEPRU, 2013.
25. Bass FM. A new product growth model for consumer durables. Management Science. 1969;15:215-27.
26. Satoh D. A discrete Bass model and its parameter estimation. Journal of the Operations Research. 2001;44(1).
27. Honest H, Forbes CA, Duree KH, Norman G, Duffy SB, Tsourapas A, et al. Screening to prevent spontaneous preterm birth: systematic reviews of accuracy and effectiveness literature with economic modelling. Health Technol Assess. 2009;13(43):1-627. PubMed PMID: 19796569.
28. The Health and Social Care Information Centre. NHS Maternity Statistics 2011-12 Summary Report. NHS, 2012.
29. Chapman A-M, Taylor CA, Girling AJ. Are the UK Systems of Innovation and Evaluation of Medical Devices Compatible? The Role of NICE’s Medical Technologies Evaluation Programme (MTEP). Appl Health Econ Health Policy. 2014;2014(12):347-57.
30. Ades AE, Lu G, Claxton K. Expected Value of Sample Information Calculations in Medical Decision Modeling. Medical Decision Making. 2004;24:207-27.
31. Eckermann S, Willan AR. Expected value of information and decision making in HTA. Health Economics. 2007;16(2):195-209. doi: 10.1002/hec.1161. PubMed PMID:
16
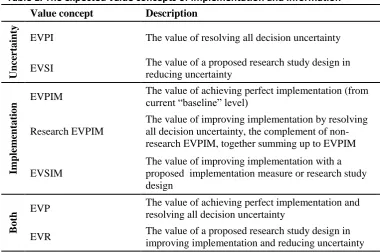
Table 1. The expected value concepts of implementation and information
Value concept Description
U
nce
rt
ai
nty EVPI The value of resolving all decision uncertainty
EVSI The value of a proposed research study design in reducing uncertainty
Im
pl
em
ent
at
ion
EVPIM The value of achieving perfect implementation (from current “baseline” level)
Research EVPIM
The value of improving implementation by resolving all decision uncertainty, the complement of non-research EVPIM, together summing up to EVPIM
EVSIM
The value of improving implementation with a proposed implementation measure or research study design
B
ot
h EVP
The value of achieving perfect implementation and resolving all decision uncertainty
17
Table 2. Accruing the EVSIM over the implementation-adjusted population
Time t Individual (per person) EVSIM
Discounted population affected
Implementation of cost-effective technology
EVSIM accrued over implementation adjusted population
1
2
18 Table 3. Cost-effectiveness results for case study example
Threshold: £20,000 / QALY A B C
Expected Costs £19,004 £19,219 £19,409
Expected QALYs 29.224 29.221 29.219
ICER against B Dominating - NA
ICER against C Dominating Dominating -
19 Table 4. Dynamic expected value of implementation and information results for case
study example
Per person
Population per annum (20,000 patients affected)
Population over time horizon of 5 years (discounted)
U
nce
rt
ai
nty EVPI £2.03 £40,530.00 £223,527.00
EVSI (Study I) £0.00 £0.00 £0.00
EVSI (Study II) £0.02 £452.00 £2,491.00
Im
pl
em
ent
at
ion EVPIM £353.00 £7.06 million £33.10 million
Research EVPIM £41.20 £823,553.00 £3.75 million
EVSIM (Study I) £9.11 £22,421.00 £100,551.00
EVSIM (Study II) £13.66 £37,709.00 £169,203.00
B
ot
h
EVP £355.00 £7.06 million £33.30 million
EVR (Study I) £9.11 £22,421.00 £100,551.00
EVR (Study II) £13.68 £38,161.00 £171,694.00
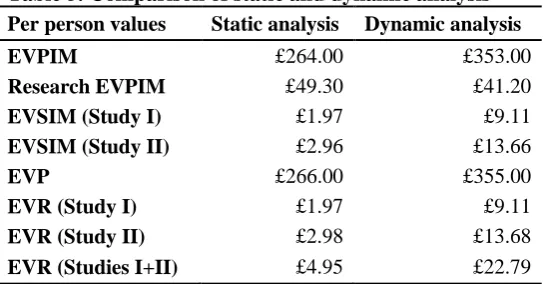
20 Table 5. Comparison of static and dynamic analysis
Per person values Static analysis Dynamic analysis
EVPIM £264.00 £353.00
Research EVPIM £49.30 £41.20
EVSIM (Study I) £1.97 £9.11
EVSIM (Study II) £2.96 £13.66
EVP £266.00 £355.00
EVR (Study I) £1.97 £9.11
EVR (Study II) £2.98 £13.68
24
Disclaimer:
The Policy Research Unit in Economic Evaluation of Health and Care interventions is funded by the
Department of Health Policy Research Programme. It is a collaboration between researchers from the University
of Sheffield and the University of York.
The Department of Health's Policy Research Unit in Economic Evaluation of Health and Care Interventions is a
5 year programme of work that started in January 2011. The unit is led by Professor John Brazier (Director,
University of Sheffield) and Professor Mark Sculpher (Deputy Director, University of York) with the aim of
assisting policy makers in the Department of Health to improve the allocation of resources in health and social
care.
This is an independent report commissioned and funded by the Policy Research Programme in the Department
25 Appendix
The EVR can be written as:
𝐸𝑉𝑅 = ∑ 𝜌𝑑𝑋 𝐷
𝑑=1
𝔼𝜃𝑁𝐵(𝑑, 𝜃) − ∑ 𝜌𝑑𝐶 𝐷
𝑑=1
𝔼𝜃𝑁𝐵(𝑑, 𝜃) + 𝔼𝑋[𝑚𝑎𝑥𝑑𝔼𝜃|𝑋{𝑁𝐵(𝑑|𝜃)}]
− 𝑚𝑎𝑥𝑑𝔼𝜃{𝑁𝐵(𝑑, 𝜃)}
(A.1)
where 𝜌𝑑𝑋 is implementation of technology d, given data X collected in the proposed research study.
The Research EVSIM can be written just like any other EVSIM because the effects of the reduction of uncertainty cancel out with the inclusion of implementation, as is shown in Equation (A.2):
𝐸𝑉𝑆𝐼𝑀𝑅= 𝔼
𝑋[∑ 𝜌𝑑𝑋 𝐷
𝑑=1
𝔼𝜃|𝑋{𝑁𝐵(𝑑, 𝜃)}] − ∑ 𝜌𝑑𝐶 𝐷
𝑑=1
𝔼𝑋[𝔼𝜃|𝑋{𝑁𝐵(𝑑, 𝜃)}]
= [∑ 𝜌𝑑𝑋 𝐷
𝑑=1
𝔼𝑋𝔼𝜃|𝑋{𝑁𝐵(𝑑, 𝜃)}] − ∑ 𝜌𝑑𝐶 𝐷
𝑑=1
𝔼𝑋[𝔼𝜃|𝑋{𝑁𝐵(𝑑, 𝜃)}]
= ∑ 𝜌𝑑𝑋 𝐷
𝑑=1
𝔼𝜃{𝑁𝐵(𝑑, 𝜃)} − ∑ 𝜌𝑑𝐶 𝐷
𝑑=1
𝔼𝜃{𝑁𝐵(𝑑, 𝜃)}
(A.2)
Where different results of the planned research result in very different diffusion curves and the analyst wishes to capture these effects, elicitation of probability distributions of diffusion curves that are conditional on these different study results is necessary. The Research EVSIM is then slightly more complex and has to be written as in Equation (A.3). The EVR can still be calculated by summing up the independent EVSI and Research EVSIM.
𝐸𝑉𝑆𝐼𝑀𝑅 = 𝔼
𝑋[∑ 𝜌𝑑𝑋 𝐷
𝑑=1
𝔼𝜃|𝑋{𝑁𝐵(𝑑, 𝜃)}] − ∑ 𝜌𝑑𝐶 𝐷
𝑑=1
𝔼𝑋[𝔼𝜃|𝑋{𝑁𝐵(𝑑, 𝜃)}]
= [∑ 𝔼𝑋 𝐷
𝑑=1
[𝜌𝑑𝑋𝔼𝜃|𝑋{𝑁𝐵(𝑑, 𝜃)}]] − ∑ 𝜌𝑑𝐶 𝐷
𝑑=1
𝔼𝜃{𝑁𝐵(𝑑, 𝜃)}