The Self-Reported Oral Health Status and
Dental Attendance of Smokers and
Non-Smokers in England
Julia Csikar1,2‡*, Jing Kang1‡, Ceri Wyborn3, Tom A. Dyer4, Zoe Marshman4,
Jenny Godson2
1School of Dentistry, University of Leeds, Leeds, LS2 9LU, United Kingdom,2Public Health England, Blenheim House, Leeds, LS1 4PL, United Kingdom,3Public Health England, West Offices, Station Rise, York, YO1 6GA, United Kingdom,4School of Clinical Dentistry, University of Sheffield, Claremont Crescent, Sheffield, S10 2TA, United Kingdom
‡These authors are co-first authors on this work.
*denjic@leeds.ac.uk
Abstract
Smoking has been identified as the second greatest risk factor for global death and disabil-ity and has impacts on the oral cavdisabil-ity from aesthetic changes to fatal diseases such as oral cancer. The paper presents a secondary analysis of the National Adult Dental Health Sur-vey (2009). The analysis used descriptive statistics, bivariate analyses and logistic regres-sion models to report the self-reported oral health status and dental attendance of smokers and non-smokers in England. Of the 9,657 participants, 21% reported they were currently smoking. When compared with smokers; non-smokers were more likely to report‘good oral health’(75% versus 57% respectively, p<0.05). Smokers were twice as likely to attend the dentist symptomatically (OR = 2.27, CI = 2.02–2.55) compared with non-smoker regardless the deprivation status. Smokers were more likely to attend symptomatically in the most deprived quintiles (OR = 1.99, CI = 1.57–2.52) and perceive they had poorer oral health (OR = 1.77, CI = 1.42–2.20). The present research is consistent with earlier sub-national research and should be considered when planning early diagnosis and management strate-gies for smoking-related conditions, considering the potential impact dental teams might have on smoking rates.
Introduction
Smoking (including second-hand smoke) has been identified as the second greatest risk factor for global death and disability [1]. Smoking increases the risk of heart disease, stroke, chronic lung disease and is the primary cause of cancer of the lungs, larynx, oesophagus, mouth, and bladder, and has been linked to cancer of the cervix, pancreas and kidneys [2,3]. In England, 18% of all deaths (aged 35 years and over) were attributed directly to smoking [4].
The impacts from smoking on the oral cavity can include aesthetic changes such as stained teeth, discoloured 'tooth-coloured' restorations and dentures. There are also more serious com-plications related to smoking such as an increased prevalence of periodontitis leading to tooth OPEN ACCESS
Citation:Csikar J, Kang J, Wyborn C, Dyer TA, Marshman Z, Godson J (2016) The Self-Reported Oral Health Status and Dental Attendance of Smokers and Non-Smokers in England. PLoS ONE 11(2): e0148700. doi:10.1371/journal.pone.0148700
Editor:Lion Shahab, University College London, UNITED KINGDOM
Received:July 20, 2015
Accepted:January 20, 2016
Published:February 10, 2016
Copyright:© 2016 Csikar et al. This is an open access article distributed under the terms of the
Creative Commons Attribution License, which permits unrestricted use, distribution, and reproduction in any medium, provided the original author and source are credited.
Data Availability Statement:All Adult Dental Health Survey data files are available from the
UKDataservice database (https://discover. ukdataservice.ac.uk/catalogue/?sn=6884&type=Data %20catalogue).
Funding:The authors received no specific funding for this work.
loss, increased bone loss, impaired wound healing [5] and adverse effects on connective tissue repair [6]. The most serious condition associated with smoking and tobacco use is oral cancer [7–9]. The England mortality rate for oral cancer (The International Classification of Diseases (ICD10) used the following codes: C00-06, C09-10, C12-14) was 1,883 (per 100,000 popula-tion) per year in 2011 (males 1,221, females 662) [10]. The dental team have been suggested as having a key role in identifying smokers and tobacco users and providing information on reducing risks and also onward referral to smoking cessation services [11]. Referring to smok-ing cessations services [12] increases a smoker’s chance of successful cessation four-fold [13].
Analysis of data gathered in Yorkshire and the Humber [14] found links between smoking status and perceived oral health and dental attendance [15]. The analysis revealed that per-ceived oral health and dental attendance of smokers differed from non-smokers, irrespective of deprivation. For example, those who smoked were less likely to attend for routine dental check-ups and more likely to perceive they had poor oral health and to attend the dentist symptomatically. As smoking has multiple impacts on the oral cavity, dental teams have been targeted to deliver measures aimed at reducing tobacco use. It is therefore essential to under-stand if smokers access routine care differently to non-smokers and if smokers are a potentially
‘hard to reach’group and how this may affect future policy recommendations development. A national dataset, The Adult Dental Health Survey (ADHS) 2009 [16], which sampled 13,400 households across England, Wales and Northern Ireland forms the basis of the present analy-sis. Thus, the aim of this paper is to report the self-reported oral health status and dental atten-dance of smokers and non-smokers in England.
Materials and Methods
Data
This was a secondary analysis of the National Adult Dental Health Survey (ADHS) (2009) [16], this de-annoymised data is openly available using an end user licence system (data can be obtained after registration:https://discover.ukdataservice.ac.uk/catalogue/?sn=6884&type= Data%20catalogue).
Survey design
The ADHS sampled 13,400 households across England, Wales and Northern Ireland, using a two-stage cluster sampling technique (268 primary sampling units (PSU) across the UK, and each PSU consisted of two postcode sectors with 25 addresses sampled from each). This survey is representative at the level of each of the former Strategic Health Authority (SHA) regions in England. This paper will focus on the England data only (10 SHA, and 23 PSU in each SHA, so total 11,500 addresses were sampled) (adults aged 16 years and over). The Index of Multiple Deprivation for England 2010 was matched to each respondent’s data.
Measures
The following measures were taken from the ADHS (2009) and are as follows:
• Age: 7 categories (16–24, 25–34, 35–44, 45–54, 55–64, 65–74, and 75 and over)
• Gender: male and female
• Deprivation status: IMD was assigned to the participant’s postcode post interview (IMD for England (2010) [17]). Quintile 1 means most deprived, and quintile 5 means least deprived
• Smoking status (Yes or no):‘do you smoke cigarettes at all nowadays?’
• English regions: 10 regions (North East, North West, Yorkshire & the Humber, East Midlands, West Midlands, East of England, London, South East coast, South Central, and South West)
• Self-reported oral health status (good/poor):‘Would you say your dental health (mouth,teeth and/or dentures) is very good,good,fair,poor,or very poor?’For analysis purposes we classi-fied‘very good’and‘good’as‘good’, and‘fair’,‘poor’, or‘very poor’as‘poor’
• Dental attendance:‘In general do you go to the dentist for a regular check-up,an occasional check-up,only when you're having trouble with your teeth/dentures?or never been to the dentist’. Our analysis focused on‘regular check-ups’versus‘symptomatic dental attendance’(those who only attend dental practice when they are having trouble with their teeth or dentures).
Analysis
The data analysis had three stages: firstly, descriptive statistics were used to understand the sur-vey samples’demographic features.
Secondly, bivariate analyses were undertaken using Chi-squared tests to investigate the asso-ciations between smoking and each demographic feature (such as participants’gender, age, region and IMD). The associations between smoking and self-reported poor oral health and symptomatic dental attendance were investigated using Chi-square tests.
Finally, logistic regression models were applied to identify significant explanatory variables (age, sex, ethnicity, area, smoking status, and deprivation) related to poor self-reported oral health outcome and symptomatic dental attendance. The correlation of the variables or the multicollinearity within the model was assessed using the variance inflation factor (VIF) [18]. All statistical tests were performed at 0.05 significance level, using statistical software Rstudio with its Survey Package and SPSS 19. A survey weight was employed in both the logistic regres-sion models to compensate for the differential sampling rates in each region and to reduce bias caused by non-response. Weighting information is presented in the extracted dataset which is derived from information of each PSU from 2001 Census (such as typical household type, social-economic status, ethnicity, age, sex) and each dentate adult (health status, dental behav-iour, self-reported dental health and anxiety) [19].
Results
Demographic information
The ADHS dataset of English respondents equalled 9,663 adults, however due to IMD codes missing on 6 respondents these were removed from the dataset leaving 9,657 eligible to be included analysis (4,311 males: 44.6%) who completed a structured interview, 5,622 partici-pants underwent a clinical dental examination.
The distribution of participants’socio-demographic features are presented inTable 1, alongside their smoking status.
Smoking status
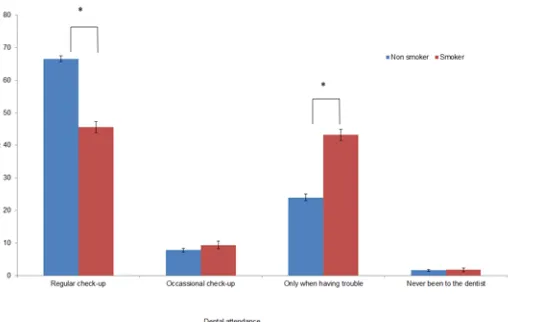
Dental attendance of non-smokers was statistically significantly different to that of smokers (Fig 2, Pearson’s Chi-square test, df = 3, p<0.001). Non-smokers were more likely to report attending for a regular check-up than smokers (67% vs 46%), while smokers were more likely to report attending when having symptoms (43% vs 24%).
[image:4.612.38.578.85.535.2]The self-reported oral health status of smokers and non-smokers within each deprivation quintile also differed (Pearson’s Chi-square tests, df = 1, all p-values<0.001). There was a sig-nificant difference in risk of having poor oral health for smokers compared with non-smokers for each IMD quintile. The overall risk for smokers reporting poor self-reported oral health was 17.5% higher than that of non-smokers. The odds for smokers reporting poor oral health was 2.21 times greater than non-smokers (Table 2). All deprivation quintiles indicated a signifi-cant high risk of reporting poor self-reported oral health if they were smokers when compared with non-smokers.
Table 1. Socio-demographic features of participants by smoking status.
Socio-demographic variables Whole sample n Smoker Non-smoker p-value (Chi-square)
n 9,657 2,019 7,628
Age band 16 to 24 865 11.9% 8.2%
25 to 34 1,306 18.8% 12.2%
35 to 44 1,730 20.5% 17.3%
45 to 54 1,731 18.5% 17.8% p<0.001
55 to 64 1,687 17.3% 17.5%
65 to 74 1,277 8.6% 14.5%
75 and over 1,051 4.4% 12.6%
Gender Male 4,304 45.9% 44.3%
Female 4,251 54.1% 55.7%
Ethnicity White British/other White 8,746 94.0% 89.9%
Mixed race 64 0.8% 0.6% p = 0.20
Asian-Indian 265 0.9% 3.2%
Asian-Pakistani & Bangladeshi 165 0.8% 2.0% p<0.001
Asian-Other 67 0.3% 0.8%
Black Caribbean 85 1.1% 0.8%
Black African 89 0.4% 1.1%
Other Black 4 0.1% 0.0%
Other ethnic group 149 1.4% 1.6%
Deprivation (IMD) 1most deprived 1,497 25.0% 13.0%
2 1,782 22.7% 17.3%
3 2,168 22.8% 22.4%
4 2,062 16.8% 22.6% p<0.001
5least deprived 2,138 12.7% 24.7%
Region North East 990 11.5% 9.9%
North West 969 11.9% 9.5%
Yorkshire & the Humber 1,020 12.5% 10.1%
East Midlands 1,130 11.3% 11.8% p<0.001
West Midlands 873 8.2% 9.3%
East of England 1,033 10.6% 10.7%
London 761 7.8% 7.9%
South East Coast 896 8.9% 9.4%
South Central 966 6.9% 10.8%
South West 1,009 10.4% 10.5%
Focusing on the participants who regularly attend the dentists for check-ups and those who only attend symptomatically (when they have problems) is outlined inTable 3Overall, smok-ers were more than twice as likely as non-smoksmok-ers to attend the dentist symptomatically (OR = 2.63). Smokers were significantly more likely to report attending symptomatically in all deprivation quintiles when compared with non-smokers (Table 2, Person’s Chi-square tests, df = 1, all p-values<0.001).
Predictors of poor self-reported oral health status and symptomatic
dental attendance
[image:5.612.205.436.72.211.2]A multivariate linear logistic regression model was used to assess the risk factors for poor self-reported oral health and symptomatic dental attendance, assuming independent sampling using complete-case analysis and weighted according to the survey weight provided in the ADHS dataset. The dependent variable was‘fair/poor/very poor (poor) self-reported oral health status’and‘only when having problem’in the dental attendance pattern, and the inde-pendent variables were listed in column 1 along with the reference case (as denoted by this symbol:†) (Table 4). Full models including interaction terms between independent predictors, such as interaction between deprivation index and smoking status, had been considered, but no significance of interactions are detected in both models. For example, the effect of smoking Fig 1. Self-reported oral health status by smoking status (percentage).(error bars indicated 95% confidence intervals)*Significance level 0.05 after Bonferroni correction.
doi:10.1371/journal.pone.0148700.g001
Fig 2. Dental attendance by smoking status (percentage).(error bars indicated 95% confidence intervals)
*Significance level 0.05 after Bonferroni correction.
[image:5.612.203.470.519.680.2]status on poor dental health is independent of deprivation quintile and so the original multi-variate linear models was used. Multicollinearities within both models were tested and all vari-ables showed low correlation measured by variance inflation factor VIF (VIF: 1 means low or no correlation of variables; VIF>5 indicates high multicollinearity) [18]. Both self-reported oral health status model and dental attendance model the VIF was around one which indicated that we do not have multicollinearity issue in our models (Oral health model: VIFIMD= 1.33,
VIFGender= 1.01, VIFEthnicity= 1.41, VIFAge= 1.15, VIFSmoking status= 1.09 and VIFRegion= 1.50;
Dental attendance model: VIFIMD= 1.27, VIFGender= 1.02, VIFethnicity= 1.36, VIFAge= 1.16,
VIFSmoking status= 1.10 and VIFRegion= 1.43. There were 13 missing entries for participant’s
eth-nicity out of 9657, but coefficients obtained in the multiple logistic regression models for both self-reported oral health and dental attendance were very similar to the original outputs (all have the same value to 2 decimals), after multiple imputation.
Predictors of poor self-reported oral health. Table 4shows the coefficient of each predic-tor in the logistic regression model of poor self-reported oral health as the outcome. Every cate-gorical predictor is significant. The largest odds ratio to have poor oral health is smoker compared with non-smoker (OR = 2.29), and the second largest odds ratio is to be Asian Paki-stani & Bangladeshi compared with being White British (OR = 2.16), when controlling other risk factors. By age band, older people were more likely to have poor self-reported oral health compared with younger participants, and females were less likely to have self-reported poor oral health. IMD showed that the higher socio-economic class was, the less likely they would self-report poor oral health. Compared with North East, people in London and the south are more likely to self-report poor oral health.
[image:6.612.34.577.89.182.2]Predictors of symptomatic dental attendance. In order to assess the behaviour difference between smokers and non-smokers in terms of their dental attendance pattern, we focused on the participants who attend dentist regularly (62.2% of the total responses) and those who only attend symptomatically (28.0%) (these two types of attendance make up over 90% of the total sampled subjects).Table 5shows predictors of symptomatic attendance using a multivariate logistic regression model. Again, every categorical predictor is significant. The largest odds Table 2. Risks of self-reported poor oral health for smokers and non-smokers, their risk difference and odds ratio by deprivation quintile.
IMD quintile Risk for smokers (%) Risk for non-smokers (%) Risk difference (%) p-value ORs (95% CIs)
1most deprived 48.5 34.6 13.9 P<0.001 1.77 (1.42, 2.20)
2 46.2 25.1 21.1 P<0.001 2.56 (2.05, 3.20)
3 39.1 26.2 12.9 P<0.001 1.81 (1.46, 2.24)
4 38.3 22.5 15.8 P<0.001 2.14 (1.67, 2.74)
5least deprived 36.7 21.5 15.2 P<0.001 2.12 (1.61, 2.80)
Overall 42.6 25.1 17.5 P<0.001 2.21 (2.00, 2.45)
[image:6.612.37.577.610.702.2]doi:10.1371/journal.pone.0148700.t002
Table 3. Risk of symptomatic dental attendance for smokers compared with non-smokers, their risk difference and odds ratio by deprivation quintile.
IMD 2010 quintile Risk for smokers (%) Risk for non-smokers (%) Risk difference (%) p-value ORs (95% CIs)
1most deprived 63.2 46.3 16.9 P<0.001 1.99 (1.57, 2.52)
2 51.3 34.9 16.4 P<0.001 1.96 (1.56, 2.47)
3 43.0 25.1 17.9 P<0.001 2.25 (1.79, 2.83)
4 43.2 19.9 13.3 P<0.001 3.07 (2.37, 3.96)
5least deprived 33.6 18.0 15.6 P<0.001 2.03 (1.71, 3.12)
Overall 48.6 26.5 21.1 P<0.001 2.63 (2.36, 2.93)
ratio to have symptomatic dental attendance is ethnicity (Asian-other, Asian-Indian and Black Africa compared with White British). Smokers compared with non-smokers had an odds ratio of 2.27 for symptomatic dental attendance. By age, those considered‘middle aged’were more Table 4. Risk factors for poor self-reported oral health status -multivariate logistic regression.
Risk factor p-value ORs (exp(B)) to have poor oral health compared with reference category (95% Confidence interval)
Age band 16 to 24†
25 to 34 p<0.001 1.54 (1.24, 19.1) +++ 35 to 44 p<0.001 1.62 (1.30, 2.00)+++ 45 to 54 p<0.001 2.25 (1.81, 2.79)+++ 55 to 64 p<0.001 2.20 (1.78, 2.73)+++ 65 to 74 p<0.001 1.72 (1.36, 2.17)+++ 75 and over p<0.001 2.10 (1.66, 2.65)+++
Gender Male†
Female p<0.001 0.82 (0.74, 0.90)+++ Ethnicity White British/other White†
Mixed race p = 0.05 0.49 (0.24, 1.00) Asian-Indian p = 0.17 0.79 (0.56–1.10) Asian-Pakistani &
Bangladeshi
p<0.001 2.16(1.52–3.07)+++
Asian-Other p = 0.64 0.86(0.47,1.58) Black Caribbean p = 0.88 1.04 (0.61, 1.77) Black African p = 0.46 0.82 (0.47, 1.42) Other Black p = 0.55 0.50 (0.05, 5.02) Other ethnic group p = 0.24 0.81 (0.53, 1.25) Deprivation
(IMD)
1most deprived†
2 p<0.001 0.68 (0.57, 0.82)+++
3 p<0.001 0.64 (0.54, 0.77)+++
4 p<0.001 0.55 (0.46, 0.65) +++
5least deprived p<0.001 0.51 (0.42, 0.60)+++
Smoke No†
Yes p<0.001 2.29(2.02, 2.55) +++ Region North East†
North West p = 0.25 1.14 (0.92, 1.41) Yorkshire & the Humber p = 0.10 1.20 (0.97, 1.49) East Midlands p = 0.91 0.99 (0.80, 1.23) West Midlands p = 0.17 0.85 (0.67, 1.08) East of England p = 0.02 1.30 (1.05, 1.61)+ London p = 0.006 1.39 (1.10, 1.76) ++ South East Coast p = 0.03 1.28 (1.03, 1.59)++ South Central p = 0.05 1.26 (0.99, 1.59) South West p = 0.008 1.34 (1.08, 1.66)++
†reference category Significance levels: +++<0.001 ++<0.01 +<0.05
likely to attend dental practice regularly, while the oldest participants (75 and over) and the younger group (25–34) were more likely to go to dental practice when they had symptoms (16–24 were the reference age group). Women are less likely to attend dental care
Table 5. Risk factors for symptomatic dental attendance versus regular check-up -multivariate logistic regression.
Risk factor p-value OR (exp(B)) to have poor oral health compared with the reference category (95% CI)
Age band 16 to 24†
25 to 34 p = 0.04 1.24 (1.01, 1.50)+ 35 to 44 p<0.001 0.72 (0.59, 0.87)+++ 45 to 54 p<0.001 0.57 (0.47, 0.69)+++ 55 to 64 p<0.001 0.53 (0.44, 0.65)+++ 65 to 74 p<0.001 0.66 (0.55, 0.81)+++ 75 and over p<0.001 1.56 (1.26, 1.95)+++
Gender Male†
Female p<0.001 0.58 (0.53, 0.64)+++ Ethnicity White British/other White†
Mixed race p = 0.13 1.52 (0.90, 2.58) Asian-Indian p<0.001 3.42(2.50, 4.86)+++ Asian-Pakistani &
Bangladeshi
p<0.001 2.76 (1.87, 4.10)+++
Asian-Other p<0.001 3.75(2.12, 6.61)+++ Black Caribbean p = 0.44 1.21(0.74, 1.97) Black African p = 0.002 2.67(1.45, 4.89)++ Other Black p = 0.94 0.93(0.14, 6.06) Other ethnic group p = 0.008 1.78 (1.16, 2.75)++ Deprivation
(IMD)
1most deprived†
2 p<0.001 0.66 (0.56, 0.79) +++
3 p<0.001 0.48 (0.41, 0.56)+++
4 p<0.001 0.39 (0.33, 0.47)+++
5least deprived p<0.001 0.35 (0.29, 0.42)+++
Smoke No†
Yes p<0.001 2.27 (2.02, 2.55)+++
Region North East†
North West p = 0.35 1.11 (0.89, 1.37) Yorkshire & the Humber p = 0.47 1.08 (0.87, 1.34) East Midlands p = 0.48 0.93 (0.74, 1.15) West Midlands p = 0.40 1.09 (0.88, 1.36) East of England p = 0.17 1.16 (0.94, 1.44) London p<0.001 1.75 (1.38, 2.21) +++ South East Coast p = 0.006 1.35 (1.09, 1.67)++ South Central p = 0.69 1.05 (0.83, 1.33) South West p = 0.20 1.15 (0.93, 1.43)
†reference category Significance levels: +++<0.001 ++<0.01 +<0.05
symptomatically. IMD also showed those in higher socio-economic groupings were more likely to attend on a regular basis. Compared with North East, those from London and South East Coast were more likely to go to dentist when they had problems.
Discussion
This study is the first to examine the self-reported oral health status and dental attendance of smokers and non-smokers in England. The study explored if a relationship between perceived oral health status and dental attendance of smokers noted within a previous study at a regional level [15] were evident nationally. The present study’s findings are broadly consistent with those of the regional study [15] which identified that being a smoker best predicted self-reported poorer oral health and symptomatic dental attendance. A strength of the current paper that it has built on localised findings from Yorkshire and the Humber, UK and has repli-cated some of these findings at a national level. This begins to construct an evidence base regarding smokers’dental attendance and self-reported oral heath differing from those who do not smoke. Another strength of the present analysis is it uses a national dataset which has been standardised and validated since 1968 [16]. The Adult Dental Health Survey dataset is available centrally by registered users; this adds to the credibility to the present research and strengthens the external validity.
The dataset used was the Adult Dental Health Survey 2009 which reported a smoking preva-lence of 21% of the respondents, which this is consistent with another UK lifestyle survey [20]. The South Central region had the lowest smoking prevalence and the North West the highest, which correlates with the deprivation status of each area [17]. The existence of such a correla-tion has been repeatedly reported with higher smoking prevalence in areas of greater disadvan-tage [21–23]. One surprising finding was the perception of poor oral health in the South West and South East Coast as this is an area of lower deprivation and therefore we would expect a higher self-perceived oral health. The reason for this finding is unclear, it may be related to how different groups in different areas of the country perceive and assess oral health, which has been identified as an under-researched area [24].
Overall smokers were more than twice as likely to report poor oral health compared with non-smokers. Participants in the least deprived areas who smoked were 1.7 times more likely to report poor oral health than non-smokers. Irrespective of deprivation status, those who smoked were more likely to report poor oral health than non-smokers. Logistic regression showed that smoking status yields the largest odds ratio (2.27) for predicting self-reported oral health status. Millar and Locker [25] reported similar findings, they found smokers were more likely to report oral pain than never smokers within a multivariate logistic model controlling for gender, age, household income, education and dental insurance. They found that current smokers and former smokers had higher odds of oral–facial pain than never smokers. An American study which analysed a national dataset found that current cigarette smokers were more likely to have higher levels of perceived dental needs when compared with non-smokers [26]. The importance of these findings extend to those delivering dental health services, those developing public health policies and those researching such issues to inform the evidence base of what works. Understanding the predictors to self-perceived dental need and self-reported oral health status (how people feel about their mouths) may improve our understanding of what encourages people to seek dental care.
seems to be a public health challenge. More research is required to identify the best way to reach this group of the population to ensure they have the advice and access to cessation ser-vices necessary to reduce their risk from smoking. The challenge of the‘inverse care law’[28] where individuals with the greatest health inequalities (need) have the lowest access services has been further developed by assessing access to preventative services and care. The‘inverse prevention law’focuses on preventative service uptake by those in most need and follows the same principle: those who could benefit most from preventive interventions are least likely to receive them thus increasing health inequalities [29].
There was variation found in the perceived oral health and dental attendance in different ethnic groups. Asian-Pakistani & Bangladeshi participants were more likely to report poor oral health compared with participants from other ethnic groups and were more likely to report symptomatic attendance. The importance of ethnicity related to oral health has been hotly debated. A recent model of oral inequalities suggest ethnicity is only one factor contributing to oral health inequalities [30] and empirical evidence suggests much of this is socioeconomically driven [31]. Highlighting ethnicity as the sole predictor of self-reported oral health status and dental attendance may distract from the root causes of inequalities and risk stigmatising some groups [30].
The findings of this analysis and the regional study published in 2013 [15] have implications for dental teams’ability to access smokers and therefore any effect they might have on helping smokers quit. Smokers are more likely to attend symptomatically and opportunities for smok-ing cessation interventions by the dental team may therefore be limited or unwelcome espe-cially if patients are seeking pain relief. In addition, smokers perceived their oral health to be poorer than non-smokers and therefore support, guidance and clinical interventions necessary to improve the health of their mouths may be challenging to deliver if they only attend when having problems with their mouths. Oral health messages are more likely to have impact and be effective if part of continual care, are communicated clearly and are tailored to the patient [32]. Working with patients in this way builds familiarity and trust and supports a tailored pre-vention approach which improves the effectiveness of preventative advice [32].
The importance of continued“upstream”population approaches outside of the clinical environment are essential to consider given the limitation dental teams may face attempting to reach smokers. Although the impact dental teams can have on smoking cessation has been demonstrated [12], the present findings suggest that contact with smokers within a dental set-ting may be limited as they are less likely to attend regularly and more likely to be symptomatic. Smoking not only increases the risk of oral cancer and periodontal disease but also stroke and heart disease [37], a common risk factor approach is necessary to target those at increased risk of a multitude of conditions and diseases and should be utilised across the spectrum health practitioners. If this model is applied, a joined up approach to the prevention of ill health could be achieved. The common risk factor approach focuses on healthy choices that not only impact on oral health but general health; giving health and social care workers multiple opportunities to work with smokers when they present themselves to‘make every contact count’[38].
One limitation within the analysis should be raised when considering the Index of Multiple Deprivation (IMD 2010). IMD was used to estimate deprivation and as a composite index incorporates a range of data from a neighbourhood of up to 6000 households. This index does not necessarily indicate the level of deprivation experienced by each participant and conse-quently, participants in this study may or may not experience the estimated deprivation for that area. The indices are a measure of area deprivation, within this analysis deprivation scores were allocated into quintiles (least, less, average, more and most deprived) as this is commonly used in such a way within the field of health and social care [39]. Within the present research retrospective data was used, it is difficult to be wholly confident that respondents categorised into deprivation quintiles do in fact experience the level of deprivation assigned, caution there-fore should be applied when interpreting results. Future research could consider collecting pro-spective data and therefore establish the deprivation status of each participant more
confidently.
The oral health status and dental attendance data were self-reported, participants were vol-unteers and this increases the risk that“self-selecting”samples will not be representative of the source population [40]. As smoking prevalence was similar to another large UK survey [20], any sampling bias is likely to be similar, but the impact of such bias is unclear. However, the use of self-reported measures has been validated as robust measure when assessing the needs at a population level but there are limitations [41]. For example, self-reported measures could under or overestimate treatment need. Within the present study, unpicking variables related to dental attendance and perceptions of oral health status were necessary as personally derived oral health status is one factor that stimulates an individual to seek care and advice [42].
Conclusions
This paper has reported the self-reported oral health status and dental attendance of smokers and non-smokers in England. Smokers perceived they had poorer oral health and were more likely to attend symptomatically than non-smokers even when considering the deprivation sta-tus of the participant. The present study’s findings are consistent with earlier sub-national research. These findings should be considered when planning early diagnosis and management strategies for smoking-related conditions, considering the potential impact dental teams might have on smoking rates.
Author Contributions
References
1. Lim SS, Vos T, Flaxman AD, Danaei G, Shibuya K, Adair-Rohani H, et al. A comparative risk assess-ment of burden of disease and injury attributable to 67 risk factors and risk factor clusters in 21 regions, 1990–2010: a systematic analysis for the Global Burden of Disease Study 2010.[Erratum appears in Lancet. 2013 Apr 13;381(9874):1276], [Erratum appears in Lancet. 2013 Feb 23;381(9867):628 Note: AlMazroa, Mohammad A [added]; Memish, Ziad A [added]]. Lancet. 2012; 380(9859):2224–60. PMID: 23245609. doi:10.1016/S0140-6736(12)61766-8
2. World Health Organization. Smoking Statistics: World Health Organization; 2005 [cited 2005 June 15 2005]. Available from:http://www.wpro.who.int/media_centre/fact_sheets/fs_20020528.htm. 3. Ezzati M, Lopez A, Rodgers A, Vander Hoorn S, Murray C. Selected major risk factors and global and
regional burden of disease. The Lancet. 2002; 360(9343):1347–60.
4. The Health and Social Care Information Centre. Statistics on Smoking: England, 2012. London: The Health and Social Care Information Centre., 2012.
5. Hilgers K, Kinane D. Smoking, periodontal disease and the role of the dental profession. International Journal of Dental Hygiene. 2004; 2:56–63. PMID:16451463
6. Rivera-Hidalgo F. Smoking and periodontal disease. Periodontology. 2000; 32:50–8.
7. Johnson N, Bain C. Tobacco and oral disease. British Dental Journal. 2000; 189(4):200–6. PMID: 11036748
8. Cancer Research UK. Oral cancer London2012 [March 2012]. Available from:http://info. cancerresearchuk.org/print/?files=CRUKMIG_100019782,CRUKMIG_100019784,CRUKMIG_ 100019787,CRUKMIG_100019786,CRUKMIG_100019788,CRUKMIG_100019783,CRUKMIG_ 100019785&parentfile=CRUKMIG_100019788.
9. Tilakaratne WM, Klinikowski M, Saku T, Peters T, Warnakulasuriya S. Oral submucous fibrosis: review on aetiology and pathogenesis. Oral Oncology. 2006; 42(6):561–8. PMID:16311067.
10. The Office of National Statistics. Cancer Registration Statistics, England 2011 2013. Available from: http://www.ons.gov.uk/ons/rel/vsob1/cancer-statistics-registrations—england—series-mb1-/no—42— 2011/rft-main-tables.xls.
11. Public Health England. Smokefree and smiling: Helping dental patients to quit tobacco. London: 2014. 12. Carr AB, Ebbert J. Interventions for tobacco cessation in the dental setting. Cochrane Database of
Sys-tematic Reviews. 2012; 6:CD005084. PMID:22696348. doi:10.1002/14651858.CD005084.pub3 13. West R, Brown J. Smoking and Smoking Cessation in England 2011 2012. Available from:www.
smokinginengland.info.
14. Yorkshire and Humber Dental Public Health Observatory. The Dental Health of Adults in Yorkshire and the Humber 2008. York: 2009.
15. Csikar JI, Wyborn C, Dyer T, Marshman Z, Godson J. The self-reported oral health status and dental attendance of smokers and non-smokers. Community Dental Health. 2013; 30(1):26–9. PMID: 23550503
16. Office for National Statistics Social Survey Division and Information Centre for Health and Social Care. Adult Dental Health Survey Colchester, Essex 2009. Available from:http://www.esds.ac.uk/
findingData/snDescription.asp?sn=6884#doc.
17. Department for Communities and Local Government. English indices of deprivation 2010 2011 [11/11/ 12]. Available from:https://www.gov.uk/government/publications/english-indices-of-deprivation-2010. 18. O’Brien R. A Caution Regarding Rules of Thumb for Variance Inflation Factors. Quality & Quantity.
2007; 41:673–90.
19. The Health and Social Care Information Centre. Foundation Report: Adult Dental Health Survey 2009 (Technical information) 2011.
20. Office for National Statistics. General Lifestyle Survey 2010 London: ONS; 2010 [05/04/2010]. Avail-able from:http://www.ons.gov.uk/ons/rel/ghs/general-lifestyle-survey/2010/index.html.
21. Department of Health. Smoking kills: a white paper on tobacco. London: Stationery Office; 1998. 22. Tomintz M, Clarke G, Rigby J. The geography of smoking in Leeds: estimating individual smoking rates
and the implications for the location of stop smoking services. Area. 2008; 40(3): 341–53. 23. Acheson D. Independent inquiry into inequalities in health report. London: The Stationary Office,
1998.
25. Millar W, Locker D. Smoking and oral health status. Journal of the Canadian Dental Association. 2007; 73(2):155. PMID:17355806.
26. Dye B, Morin N, Robison V. The relationship between cigarette smoking and perceived dental treat-ment needs in the United States, 1988–1994. The Journal of the American Dental Association. 2006; 137(2):224–34. PMID:16521389
27. Jorm L, Shepherd L, Rogers K, Blyth F. Smoking and use of primary care services: findings from a pop-ulation-based cohort study linked with administrative claims data. BMC Health Services Research. 2012; 12:263. PMID:22900643; PubMed Central PMCID: PMCPMC3502263. doi: 10.1186/1472-6963-12-263
28. Tudor-Hart J. The inverse care law. Lancet. 1971; 1(7696):405–12. PMID:4100731
29. Lorenc T, Petticrew M, Welch V, Tugwell P. What types of interventions generate inequalities? Evi-dence from systematic reviews. Journal of Epidemiology & Community Health. 2013; 67():(2):190–3. 30. Watt RG, Sheiham A. Integrating the common risk factor approach into a social determinants
frame-work. Community Dentistry & Oral Epidemiology. 2012; 40(4):289–96.
31. Guarnizo-Herreño CC, Wehby GL. Explaining racial/ethnic disparities in children's dental health: a decomposition analysis. American Journal of Public Health. 2012; 102(5):859–66. doi:10.2105/AJPH. 2011.300548PMID:22420801
32. Daly B, Batchelor P, Treasure ET, Watt R. Essential dental public health. Oxford: Oxford University Press; 2013.
33. Public Health England. Delivering Better Oral Health: An evidence-based toolkit for prevention (Third Edition). London: 2014.
34. Csikar JI, Douglas GV., Pavitt S, Hulme C. The cost effectiveness of smoking cessation services pro-vided by general dental practice, general medical practice, pharmacy and NHS Stop Smoking Services in the North of England. Community Dentistry and Oral Epidemiology. 2015;(In Press). doi:10.1111/ cdoe.12195
35. Public Health England. Commissioning Better Oral Health. London: 2014. 36. Department of Health. Dental Contract Reform: Prototypes. 2015.
37. Johnson G, Slach N. Impact of tobacco use on periodontal status. Journal of Dental Education. 2001; 65:313–21. PMID:11336116
38. NHS Yorkshire & Humber. Making Every Contact Count. Leeds: Strategy Health Authority, 2008. 39. Yorkshire & Humber Public Health Observatory. IMD 2010: Bradford. York: 2011.
40. Geneletti S, Richardson S, Best N. Adjusting for selection bias in retrospective, case-control studies. Biostatistics. 2009; 10(1):17–31. doi:10.1093/biostatistics/kxn010PMID:18482997
41. Robinson P, Nadanovsky P, Sheiham A. Can questionnaires replace clinical surveys to assess dental treatment needs of adults? Journal of public health dentistry. 1998; 58(3):250–3. PMID:10101703 42. Baker S. Applying Andersen’s behavioural model to oral health: what are the contextual factors shaping