The harmonized INFOGEST
in vitro
digestion method: From knowledge
to action
Lotti Egger
a,⁎
, Olivia Ménard
b, Cristina Delgado-Andrade
c, Paula Alvito
d, Ricardo Assunção
d, Simon Balance
e,
Reyes Barberá
f, Andre Brodkorb
g, Thomas Cattenoz
h,i,j, Alfonso Clemente
c, Irene Comi
k, Didier Dupont
b,
Guadalupe Garcia-Llatas
f, María Jesús Lagarda
f, Steven Le Feunteun
h,i,j, Lonneke JanssenDuijghuijsen
l,
Sibel Karakaya
m, Uri Lesmes
n, Alan R. Mackie
o, Carla Martins
d, Anne Meynier
p, Beatriz Miralles
q,
Brent S. Murray
r, Anne Pihlanto
s, Gianluca Picariello
t, Claudia N. Santos
u,v, Sebnem Simsek
m, Isidra Recio
q,
Neil Rigby
o, Laurie-Eve Rioux
w, Helena Stoffers
a, Ana Tavares
d, Lucelia Tavares
u,v, Sylvie Turgeon
w,
Ellen K. Ulleberg
k, Gerd E. Vegarud
k, Guy Vergères
a, Reto Portmann
aa
Agroscope, Institute for Food Sciences, Schwarzenburgstr. 161, 3003 Bern, Switzerland b
INRA-Agrocampus Ouest-UMR 1253 STLO, Rennes, France c
Department of Physiology and Biochemistry of Animal Nutrition, Estacion Experimental del Zaidin (CSIC), Profesor Albareda 1, Granada 18008, Spain d
National Institute of Health Doutor Ricardo Jorge, I.P., Food and Nutrition Department, Av. Padre Cruz, 1649-016 Lisboa, Portugal eNofima AS, Osloveien 1, NO-1430Ås, Norway
fNutrition and Food Science Area, University of Valencia, Avda. Vicente Andrés Estellés s/n, 46100 Bujassot, Valencia, Spain gTeagasc Food Research Centre, Moorepark, Fermoy, County Cork, Ireland
h
INRA, UMR782 Génie et Microbiologie des Procédés Alimentaires, F-78850 Thiverval Grignon, France i
AgroParisTech, UMR782 Génie et Microbiologie des Procédés Alimentaires, F-78850 Thiverval Grignon, France j
AgroParisTech, UMR GMPA 782, 78850 Thiverval grignon, France k
Department of Chemistry, Biotechnology and Food Science, Norwegian University of Life Sciences, 1432 Aas, Norway
lWageningen University and Research Centre, Food and Biobased Research, Bornse Weilanden 9, 6708 WG Wageningen, Netherlands mEge University, Engineering Faculty Department of Food Engineering, 35100 Izmir, Turkey
n
Department of Biotechnology and Food Engineering, Technion—Israel Institute of Technology, Haifa 32000, Israel o
Institute of Food Research, Norwich, NR4 7UA, Norfolk, UK p
INRA, UR1268 Biopolymères Interactions Assemblages, F-44316 Nantes Cedex 3, France q
Instituto de Investigaciòn en Ciencias de la Alimentaciòn (CIAL, CSIC-UAM), Nicolas Cabrera 9, 28049 Madrid, Spain r
School of Food Science and Nutrition, The University of Leeds, Leeds LS2 9JT, UK
sNatural Resource Institute Finland (LUKE) New Business Opportunities, Myllytie 1, FI-31600 Jokioinen, Finland tInstitute of Food Sciences, National Research Council of Italy (CNR), Via Roma 64, 83100 Avellino, Italy u
Instituto de Tecnologia Química e Biológica António Xavier, Universidade Nova de Lisboa, Av. da República, 2780-157 Oeiras, Portugal v
iBET, Instituto de Biologia Experimental e Tecnológica, Apartado 12, 2781-901 Oeiras, Portugal w
STELA Dairy Research Centre, Institute of Nutrition and Functional Foods, Pavillon Paul-Comtois 2425, rue de l'Agriculture, Université Laval, Québec, QC G1V 0A6, Canada
a b s t r a c t
a r t i c l e i n f o
Article history: Received 30 July 2015
Received in revised form 3 December 2015 Accepted 5 December 2015
Available online 8 December 2015
Within the activefield ofin vitrodigestion in food research, the COST Action INFOGEST aimed to harmonize in vitroprotocols simulating human digestion on the basis of physiologically inferred conditions. A harmonized staticin vitrodigestion (IVD) method was recently published as a primary output from this network. To validate this protocol, inter-laboratory trials were conducted within the INFOGEST network. Afirst study was performed using skim milk powder (SMP) as a model food and served to compare the different in-house digestion protocols used among the INFOGEST members. In a second inter-laboratory study applying the harmonized protocol, the
⁎ Corresponding author.
E-mail addresses:[email protected](L. Egger),[email protected](O. Ménard),[email protected](C. Delgado-Andrade), [email protected](P. Alvito),[email protected](R. Assunção),simon.ballance@nofima.no(S. Balance),[email protected](R. Barberá), [email protected](A. Brodkorb),[email protected](T. Cattenoz),[email protected](A. Clemente),[email protected](I. Comi), [email protected](D. Dupont),[email protected](G. Garcia-Llatas),[email protected](M.J. Lagarda),[email protected](S. Le Feunteun), [email protected](L. JanssenDuijghuijsen),[email protected](S. Karakaya),[email protected](U. Lesmes),[email protected](A.R. Mackie), [email protected](C. Martins),[email protected](A. Meynier),[email protected](B. Miralles),[email protected](B.S. Murray), anne.pihlanto@luke.fi(A. Pihlanto),[email protected](G. Picariello),[email protected](C.N. Santos),[email protected](S. Simsek),[email protected](I. Recio),
[email protected](N. Rigby),[email protected](L.-E. Rioux),[email protected](H. Stoffers),[email protected](A. Tavares),[email protected] (L. Tavares),[email protected](S. Turgeon),[email protected](E.K. Ulleberg),[email protected](G.E. Vegarud),[email protected](G. Vergères), [email protected](R. Portmann).
http://dx.doi.org/10.1016/j.foodres.2015.12.006
0963-9969/© 2015 The Authors. Published by Elsevier Ltd. This is an open access article under the CC BY license (http://creativecommons.org/licenses/by/4.0/). Contents lists available atScienceDirect
Food Research International
degree of consistency in protein hydrolysis was investigated. Analysis of the hydrolyzed proteins, after the gastric and intestinal phases, showed that caseins were mainly hydrolyzed during the gastric phase, whereas β-lactoglobulin was, as previously shown, resistant to pepsin. Moreover, generation of free amino acids occurred mainly during the intestinal phase.
The study also showed that a few critical steps were responsible for the remaining inter-laboratory variability. The largest deviations arose from the determination of pepsin activity. Therefore, this step was further clarified, harmonized, and implemented in a third inter-laboratory study.
The present work gives an overview of all three inter-laboratory studies, showing that the IVD INFOGEST method has led to an increased consistency that enables a better comparability ofin vitrodigestion studies in the future. © 2015 The Authors. Published by Elsevier Ltd. This is an open access article under the CC BY license (http://creativecommons.org/licenses/by/4.0/). Keywords:
In vitrodigestion Dairy proteins Peptides Mass spectrometry Inter-laboratory trial Harmonized IVD protocol
1. Introduction
One major aim of the COST Action INFOGEST FA1005 INFOGEST (http://www.cost-INFOGEST.eu/) was the elaboration and harmoniza-tion ofin vitroprotocols simulating human digestion. A basic static model was developed and published in 2014 (Minekus et al., 2014).
Many different models have previously been described (Hur, Lim,
Decker, & McClements, 2011; Kopf-Bolanz et al., 2012; McClements & Li, 2010; Picariello et al., 2010; Versantvoort, Oomen, Van de Kamp, Rompelberg, & Sips, 2005; Wickham, Faulks, & Mills, 2009). In this con-text, specific aims of the INFOGEST network were i) tofind harmonized digestion conditions, ii) to develop a static model that was easy to set up and apply for a large research community, and iii) to be able to compare study results. The parameters proposed by this method were discussed among experts in thefield and were chosen based on previously pub-lishedin vivovalues. The harmonized method comprises three steps, namely an oral, gastric, and intestinal phase, similar to earlier published models. However, in the past, a major source of discrepancy of results among laboratories, even when applying the same method, was the dif-ferences in digestive enzyme activities used for IVD. In most cases, di-gestive enzymes were added based on weight or non-standardized activity units. To overcome these problems, the new harmonized meth-od proposes a standardized assay for activity determination for each added enzyme and therefore is expected to improve the comparability of experimental results between laboratories.
In this study, the increase in harmonization of IVD results between laboratories of the INFOGEST community was investigated. For that pur-pose, three rounds of inter-laboratory studies were performed applying IVD to skim milk powder (SMP). SMP was chosen because it is an easy to ship, stable, and complex food matrix. For thefirst study, the partici-pants digested the SMP with their previously used in-house IVD protocols, and the two following studies were performed with the har-monized method. All three studies were analyzed with the same methods, focusing on protein hydrolysis. Whole proteins were analyzed by SDS-PAGE, peptides by mass spectrometry, and free amino acids by HPLC. In the course of the inter-laboratory trials, pepsin activity was identified as the critical factor in the gastric phase, causing variabilities in protein hydrolysis during this step. Pepsin activity is highly suscepti-ble to pHfluctuations (Piper & Fenton, 1965). The determination of pepsin activity with a classic enzymatic assay adapted from Anson (Anson, 1938; Anson & Mirsky, 1932) was therefore investigated to reduce the variability in the gastric hydrolysis.
2. Materials and methods
2.1. Chemicals and reagents
SMP (Fonterra, NZ, low-heat organic, protein 42.34%, fat 0.89%, lactose 49.8% (w/w)) was shipped to the INFOGEST members. All chemicals and enzymes were from Sigma Aldrich. Three different pepsins were used: P1, Sigma P6887; P2, Sigma P7012; and P3, Sigma P7000. Enzymes and bile extracts used for IVD were of porcine origin.
2.2. Inter-laboratory trials
In total, three inter-laboratory IVD trials were performed, each with SMP as food matrix. The participating laboratories were different be-tween the inter-laboratory trials, therefore the numbering refers only to the corresponding trial (Table 1). The powder from one single batch was shipped to the participating laboratories at ambient temperature. For thefirst inter-laboratory trial, the participants digested the SMP ac-cording to their in-house IVD method using enzymes from different sources. For the second and third trial, the harmonized protocol was followed. Between the second and third trials, the protocols for the en-zyme activity measurements and the IVD itself were described in more detail, and the participants in the third study attended a special training school during which they learned to apply the enzymatic activity methods and the harmonized IVD protocol. The same enzyme batches of pepsin P2 and pancreatin were sent to the participants to reduce batch-dependent variability.
2.3. In vitro digestion
SMP was digestedin vitrousing in-house methods (Table 1) or ac-cording to the harmonized protocol (INFOGEST, 2014; Minekus et al., 2014). The in-house methods were diverse, and the main known pa-rameters are summarized inTable 1. For the harmonized protocol, the SMP (5 mL of a 1/10 dilution of SMP in H2O, w:v) was mixed with
5 mL of simulated saliva without amylase (due to the absence of starch in SMP), for 2 min and then was mixed with 10 mL of simulated gastric juice containing pepsin (2000 U/mL of digesta, P1, P2 or P3) for 120 min. Subsequently, 20 mL of simulated intestinal juice containing pancreatin (100 U trypsin activity/mL of digesta) and bile (10 mmol/L in the total digesta) was added and incubated for 120 min. The oral, gastric and in-testinal steps were performed at 37 °C under constant gentle mixing. The enzyme activities and the bile concentration were measured ac-cording to the assays described in the harmonized protocol (Minekus et al., 2014). The participants were asked to collect samples after the gastric and the intestinal phases. For thefirst and second trials, the reac-tions were stopped by the addition of Pefabloc® (Roche, 1 mM) imme-diately followed by snap freezing (liquid nitrogen) and freeze-drying of the samples. For the third trial, the stopping reactions were improved and consisted of an adjustment of the pH to 7.0 after the gastric phase and by the addition of Pefabloc® (5 mM) at the end of the intestinal phase, prior to the snap freezing and freeze-drying of the samples. The pH shift after the gastric phase is more effective in stopping pepsin activity and at the same time closer toin vivoconditions found in the duodenum (Kalantzi et al., 2006). For all three trials, the samples were shipped to one analyzing laboratory (Agroscope, Switzerland) at ambi-ent temperature.
2.4. Sample preparation and gel electrophoresis
The freeze dried samples were reconstituted in ammonium bicar-bonate buffer (100 mM) at 1:2 for gastric and 1:1 for intestinal samples
Gastric Phase Intestinal Phase
Trial No. of partici-pants
Laboratory Short: 30-60 min
Long: 120-180 min
Dynamic Short: 30-60 min
Long: 120-180 min
Dynamic Pancreatin, Enzymes, Human Duodenal Juice
References
In-house protocols
1 12 1 x x P (Versantvoort et al., 2005)
2 x x P (Kopf-Bolanz et al., 2012)
3 x x P (Versantvoort et al., 2005)
4 x x P (Kopf-Bolanz et al., 2012)
5 x x E (Dupont et al., 2010)
6 x x x x P (Menard et al., 2014)
7 x x J (Ulleberg et al., 2011)
8 x x x x E (Shani-Levi, Levi-Tal, & Lesmes, 2013)
9 x x P (Vreeburg, van Wezel, Ocana-Calahorro, & Mes, 2012)
10 x x E (Martos, Contreras, Molina, & Lopez-Fandino, 2010)
11 x x P (Alemany et al., 2013)
12 x x P (Kenmogne-Domguia, Meynier, Boulanger, & Genot, 2012;
Kenmogne-Domguia, Meynier, Viau, Llamas, & Genot, 2012) Harmonized
protocol 2. and
3.
10 1.1 -1.10 x x P (Minekus et al., 2014)
7 2.1-2.7
21
9
L.
Eg
ger
et
al
./
Fo
od
Re
se
ar
ch
In
te
rn
at
io
n
al
88
(20
1
6)
2
1
7
–
[image:3.595.47.769.190.375.2]corresponding to the original volume of SMP input. For gel
electropho-resis, equal volumes were mixed with a sample buffer (Tris–HCl
350 mM, pH 6.8, SDS 10%, DTT 100 mM, glycerol 50%) and were separat-ed by SDS-PAGE (15% polyacrylamide). A molecular weight marker
(Benchmark™, Invitrogen) and undigested SMP (1:400, mixed with
sample buffer) were included on each gel. Thereafter, the gels were stained with colloidal Coomassie Blue (Kang, Gho, Suh, & Kang, 2002).
2.5. LC–MS peptide identification and length analysis
MS analysis was performed as previously described (Kopf-Bolanz et al., 2012). Briefly, samples werefiltered through Microcon columns (Ultracel YM-30, Millipore), and the peptides were separated on a Rheos 2200 HPLC (Flux Instruments, Switzerland) equipped with an
XTerra MS C18 column (3.5μm, 1.0 mm × 150 mm, Waters). The
HPLC was directly coupled to a linear ion trap mass spectrometer (LTQ, Thermo Scientific, Switzerland) using an ESI interface. The sam-ples were measured in multiple overlapping narrow mass windows
spanning an m z−1between 100 and 1300, and all rawfiles were
merged for an identification search with Mascot (Matrix Science), using a database containing the major milk proteins of different origin. The search engine parameters were set as follows: instrument configuration ESI-trap, consideration of average masses, peptide charge 1+, 2+, 3+, enzyme: none, variable peptide modifications were Gln→
pyro-Glu(N-term Q), oxidation (M), phosphor (S, T), peptide and MS/ MS tolerance 0.8 Da. Peptides from thefive major milk proteins (β -ca-sein,αs1-casein,αs2-casein,κ-casein,β-lactoglobulin) with a minimal
length offive amino acids (AA) were considered. The identification re-sults were verified manually. For better visualization of peptide abun-dance, colored peptide patterns were generated by summing up the number of individual amino acids within the identified peptides from the above mentioned dairy proteins. The colors are ranging from green to red, indicating low and high recurrence of specific amino acids, respectively. Unidentified protein sequences are shown as white stretches. The colors were normalized to the maximal number of iden-tifications within the corresponding protein and digestion phase,
e.g.red inαs1-casein can correspond to a different number for red in
β-lactoglobulin.
2.6. HPLC analysis
For determination of free amino acids, the freeze dried samples were reconstituted, normalized to SMP input as described for gel electropho-resis and equal volumes were analyzed by HPLC according to the meth-od published by Bidlingmeyer and coworkers (Bidlingmeyer, Cohen, & Tarvin, 1984).
2.7. Determination of pepsin activity
Pepsin activity was measured as described in the Supplemental ma-terial of the harmonized protocol (Minekus et al., 2014). Briefly, hemo-globin 2% (w/v) served as substrate, pepsin 1 mg/mL stock solution was dissolved in NaCl 150 mM at pH 6.5 and several dilutions (5–35μg/mL) were prepared with HCl 10 mM just before the activity test. For the test, 500μL of substrate solution was incubated at 37 °C for 4 min, 100μL of enzyme solution was added and after precisely 10 min the reaction was stopped with trichloroacetic acid (TCA, 5%). The samples were centri-fuged at 6000gfor 30 min and the absorbance (280 nm) was measured. For each sample, a blank was run in parallel, to which the corresponding pepsin solution was added after the TCA. AΔA280of 0.001 at pH 2.0 and
37 °C corresponded to 1 U. It was monitored that the activities from each tested pepsin concentration were the same, to ensure that only the linear part of the curve was considered.
2.8. Spearman correlation
Spearman correlations were calculated for the gastric and intestinal phase considering thefive investigated proteins (β-casein,αs1-casein,
αs2-casein,κ-casein, andβ-lactoglobulin) based on the data of the
pep-tide patterns shown inFig. 2. The number of times an amino acid was found within an identified peptide was summed up, aligned according to the amino acid sequence and compared with each other laboratory within a trial.
2.9. Replication of experiments and statistical analysis
The samples obtained from the participants were analyzed at least three times by gel electrophoresis, analyzed in triplicate by mass spec-trometry and in duplicate by HPLC. Representative gels are shown as well as the average values of the results. The Spearman correlation ma-trix was calculated with SYSTAT 13 software (SYSTAT, Inc. Richmond, CA) using the following settings: one set of variables, rank order data (Spearman).
3. Results and discussion
The COST Action FA1005 INFOGEST (http://www.cost-INFOGEST.eu/) aimed at the harmonization of IVD methods. The work of one subgroup (WG 2) was dedicated to the elaboration of a general standardized and practical static IVD protocol allowing a better comparability of experi-mental data. The methods were established based on availablein vivo
data and published in 2014 (Minekus et al., 2014). Meanwhile, the com-parability of IVD experiments was studied in three inter-laboratory trials using SMP and analyzing the hydrolysis of proteins with SDS-PAGE, mass spectrometry and HPLC. The latter analysis was only performed for the harmonized protocol, as it detects total free amino acids and the ratios be-tween SMP substrate and added enzymes were not comparable in the
first trial with in-house IVD protocols.
3.1. Protein hydrolysis during in vitro digestion
Protein hydrolysis was analyzed with Coomassie-stained SDS PAGE after the gastric and intestinal digestion phases (Fig. 1). To obtain an equal loading of SMP protein in each lane, the samples were reconstituted according to their dilution duringin vitrodigestion. A mo-lecular weight marker and an undigested SMP control were included. For thefirst inter-laboratory trial, the participants were asked to per-form their in-house IVD protocol, and for the second and third inter-laboratory trials, the harmonized IVD method (Minekus et al., 2014) was applied. Bands indicated by arrows are proteins that were previous-ly identified by mass spectrometry (data not shown). In a majority of the samples from all three trials, i) a band of intactβ-lactoglobulin was present after the gastric phase as well as ii) a doublet band corre-sponding to pepsin (Fig. 1a, b and c, arrow), and iii) caseins were mostly hydrolyzed.α-Lactalbumin (α-la, 15–19 kDa) was visible in the undi-gested sample (SMP) but was not detected after the gastric phase (Fig. 1a, b, c). In contrast to that, the protein pattern of the intestinal phase was more diverse after thefirst inter-laboratory trial (Fig. 1d), compared to the two trials performed with the harmonized method (Fig. 1e, f). Thus for example, in some samples from thefirst inter-laboratory trial (5, 6, 11),β-lactoglobulin was still visible after the intes-tinal phase. One strong band in the intesintes-tinal phase, shown with an
arrow, was identified by mass spectrometry (data not shown) as
α-amylase (Fig. 1d, e, f). The other bands were previously identified as digestive enzymes originating from pancreatin (data not shown).
The improvement in consistency with the harmonized method was clearly visible at the protein level compared to thefirst inter-laboratory trial (in-house protocols) where discrepancies in the degree of
β-lactoglobulin hydrolysis were clearly visible. In some samples, the protein was completely hydrolyzed during the gastric phase, while in
others, it was still present. The harmonized method clearly improved this discrepancy. It was previously shown thatβ-lactoglobulin was resistant toin vitrodegradation by pepsin (Mandalari et al., 2009; Reddy, Kella, & Kinsella, 1988), and this observation was confirmed by using the harmonized method. The simulated gastric hydrolysis of ca-seins was also heterogeneous in the gastric phase in thisfirst trial. Inter-estingly, this heterogeneity in casein hydrolysis was persistent in some of the samples of the later trials using the harmonized method. These discrepancies were most probably due to variable pepsin activities in the gastric phase. As pepsin is the key enzyme for proteolysis during the gastric step, its activity during IVD and the enzymatic activity test was carefully assessed.
3.2. Pepsin activity as key step for gastric protein degradation
To reduce the observed differences in casein hydrolysis during the gastric phase, the participants in the second trial were asked to indicate the pepsin source and enzymatic activity they had measured before the IVD (Fig. 2). In total, three different products (Fig. 2, P1, P2, P3) were
[image:5.595.122.485.51.249.2]used and for all three a high variability in activity was reported. In par-ticular the sample digested with P3 (Fig. 2), for which a very low activity was reported, had very few peptides released during the gastric phase, as could be observed by peptide analysis (Fig. 2, sample 1.7). Two pos-sible explanations for the high variability could be advanced. Firstly, to exclude the possibility that the variability originated from the different pepsins preparations, the third inter-laboratory trial was performed using one pepsin from the same batch (Fig. 2, P2), which was shipped between the participants and analyzed for its activity beforehand. How-ever, although the laboratories all applied the same protocol ((Minekus et al., 2014), Supplemental Data) for this determination, the results were again highly variable. The third inter-laboratory trial was per-formed with the average pepsin activity determined by nine different laboratories, excluding two outliers (2976 ± 591 U/mg). Pepsin activity is known to be strongly dependent on pH and autolysis occurs in the ab-sence of substrate (Cornish-Bowden & Knowles, 1969; Galea, Dalrym-ple, Kuypers, & Blakeley, 2000). Its optimal activity is between pH 2 and pH 4, it is essentially inactive above pH 6, and it is irreversibly inactivated at higher pH (Piper & Fenton, 1965). Therefore, a second
Fig. 1.Protein hydrolysis after gastric and intestinal phases of IVD. Representative Coomassie-stained SDS-PAGE gels of the three inter-laboratory trials; upper gels are samples stopped after the gastric and lower gels after the intestinal phase. Thefirst inter-laboratory trial was performed with in-house IVD protocols, while for the two other trials, the participants applied the harmonized protocol (Minekus et al., 2014). The sample numbering refers only to the corresponding participant in the trial. Bands indicated with arrows have been previously iden-tified as milk protein (β-lactoglobulin,α-lactalbumin (α-la)) or enzymes present in gastric (pepsin) and pancreatic (amylase) juice (Kopf-Bolanz et al., 2012). SMP is the undigested skim milk powder; M is a protein marker.
[image:5.595.137.473.528.702.2]possibility for the variability in pepsin activity, namely the pH stability during pepsin activity determination was further investigated. The pH of the solution used for pepsin dilution (NaCl, 150 mM, pH 6.5) was measured several times during one day of analysis, and it changed from 6.02 to 6.46 (data not shown). To improve pH stability, Tris was added due to its buffering capacity (Tris-(hydroxymethyl)-aminomethane 10 mM, NaCl 150 mM, pH 6.5). Pepsin was dissolved in both solutions and the activity was measured in three independent experiments (Fig. 2, P1). The activity of pepsin in NaCl solution was slightly higher with a greater variability (Fig. 2, NaCl: 3434 ± 309 U/mg powder) than in the Tris buffer, which indeed reduced the variability of the measured activity (Fig. 2, Tris: 3057 ± 214 U/mg
powder). These additional tests were performed in one laboratory and need to be confirmed by a comparison within several laboratories. Note that the average activity of P2 was higher in the third inter-laboratory trial, which may possibly be due to batch variabilities.
3.3. Peptide generation during in vitro digestion
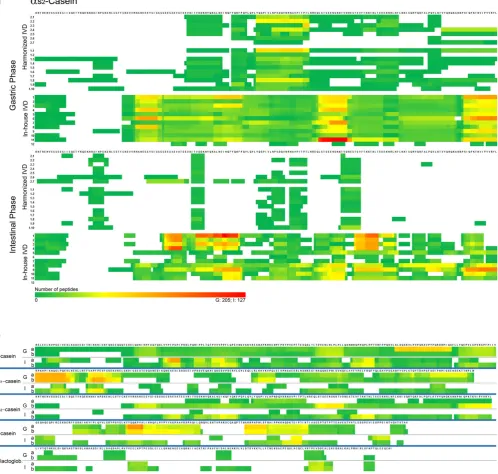
[image:6.595.49.548.56.530.2]Peptide generation during IVD was analyzed by mass spectrometry for all three inter-laboratory trials. To allow a comparison of the results among the different laboratories, a color code was introduced that simultaneously allowed a quantitative evaluation of how many times an amino acid was identified and also visualized regions within a
Fig. 3.Peptide patterns after gastric and intestinal phases of IVD. (a) Peptide pattern ofαs2-casein of all three inter-laboratory trials; upper block, two trials applying the harmonized pro-tocol (Harmonized), participants 1.1–7 and 2.1–10, and lower block, with in-house protocols, participating laboratories 1–12. (b) Average peptide patterns of thefive most abundant milk proteins,β-casein,αs1-casein,αs2-casein,κ-casein, andβ-lactoglobulin after the gastric (G) and intestinal (I) phases. Averages were calculated for two groups: harmonized protocol (a) and in-house protocols for IVD (b). The color code is green for low numbers and red for high numbers of detected amino acids. Red color was attributed depending on protein and digestion phase (gastric: G/intestinal: I) and was normalized to the maximal number of detected amino acids within a identified peptide of the corresponding protein:β-casein (G: 312/I: 127),αs1-casein (G: 92/I: 79),αs2-casein (G: 205/I: 127),κ-casein (G: 47/I: 30), andβ-lactoglobulin (G: 29/I: 54).
protein that were more resistant to digestion (Fig. 3a, Supplemental Data). For each sample from all three trials, after the gastric and intesti-nal digestion phases, a colored peptide pattern was generated according toSection 2.5, for thefive most abundant milk proteins (β-casein,
αs1-casein,αs2-casein,κ-casein, andβ-lactoglobulin). In general, the
peptide patterns obtained with the in-house protocols were different between laboratories, comprising a high number of peptides which cov-ered nearly the whole protein sequences (Fig. 3a, in-house 1–12). How-ever, both trials with the harmonized IVD had a similar inter-laboratory pattern with a lower number of peptides which covered only certain re-gions of the protein (Fig. 3a, harmonized, 1.1–10 and 2.1–7). The num-ber of peptides observed in the harmonized method decreased between the gastric and intestinal phases, indicating the expected progression in the digestion process. Both observations (protein coverage and number of peptides) point toward a higher degree of digestion in the harmo-nized method.
The differences between the in-house protocols and the harmonized IVD were observed in all investigated proteins in a similar way (Supplemental Data). These differences are summarized inFig. 3b,
which shows for each of thefive proteins an average peptide pattern for (a) the harmonized and (b) the in-house IVD, each time distinguishing the gastric (G) and the intestinal (I) phases. Several pep-tide sequences persisted at higher frequency after the intestinal phase and were consistent in all three trials, indicating that those sequences were resistant to hydrolysis, possibly because of intrinsic structural traits. Regions that are in yellow or orange in the average peptide pat-tern (Fig. 3b) indicate such highly resistant regions, and it would be in-teresting to investigate whether these regions are sources for bioactive peptides or allergenic epitopes. However, the goal of this study was to obtain a measure of the comparability of analytical results between dif-ferent laboratories.
3.4. Correlation of peptide patterns between in-house and harmonized IVD
[image:7.595.73.529.259.710.2]The peptide patterns of the different laboratories were aligned, and each peptide pattern was compared to every other pattern using a Spearman correlation between laboratories (Fig. 4). Thefirst two corre-lations compared the results from thefirst inter-laboratory trial, for
which the participants applied their in-house methods to simulate di-gestion of SMP, for the gastric and the intestinal phases, respectively (Fig. 4, in-house IVD). Two other correlations (gastric and intestinal phase, respectively) compared the results from the second and third inter-laboratory trials, applying the harmonized IVD method (Fig. 4, harmonized IVD).
For each matrix, the average correlation and the standard deviation were calculated. In addition, the matrix is shown in a color-coded pic-ture, where red indicates high correlation, and green indicates low cor-relation. Surprisingly, after the gastric phase, both correlations reached similar values, 84 ± 6% for the in-house protocols and 79 ± 7% for the harmonized method. This can be explained by a general lower degree of hydrolysis in these samples, as observed on SDS-PAGE (Fig. 1) as well as in lower numbers of peptides identified (Fig. 3, Supplemental Data). However most importantly, after the intestinal phase of diges-tion, the harmonized method generated a higher correlation of 64 ± 8% compared to the 48 ± 16% obtained with in-house IVD. This observa-tion allows the conclusion that the harmonized IVD indeed leads to a clear improvement in result comparability at the end of the intestinal phase.
For this analysis, in total six samples (total 29) were excluded due to inconsistencies with the protocol or high discrepancies of their results compared to the other laboratories. The following were reasons for the exclusion of results. Laboratory 12 (1. trial, in-house IVD) was ex-cluded from the calculation due to the lack of detectable proteins and peptides by gel electrophoresis and mass spectrometry. Laboratory 1.2 (2. trial, harmonized IVD) was excluded because it did not respect the IVD protocol (ratio of SMP compared to digestion juice). Laboratories 1.7 and 1.10 (2. trial, harmonized IVD) were excluded as outliers, due
to very low numbers of peptides after the gastric phase compared to all other laboratories, laboratories 2.6 and 2.7 (3. trial, harmonized IVD) were excluded due to very low casein hydrolysis, as observed by gel electrophoresis (Fig. 1c, lanes 2.6 and 2.7 on the upper right gel).
3.5. Release of free amino acids during harmonized IVD
[image:8.595.123.464.368.699.2]The degree of free amino acid release after the gastric and the intes-tinal digestion phase of the harmonized IVD was analyzed by HPLC (Bidlingmeyer et al., 1984) (Fig. 5). Overall, in the gastric phase, a very small amount of free amino acids was released, consisting of 1% of the total amino acids and was consistent between the second and third trial applying the harmonized method. In contrast, during the intestinal phase, most of the proteins were hydrolyzed to amino acids and the re-sults of thefirst trial applying the harmonized method were more het-erogeneous than thefinal inter-laboratory trial. The high release of free amino acids during the intestinal phase is consistent with the phys-iological situation in the gastrointestinal tract, where the liberated amino acids are absorbed mainly in the duodenal phase (Barbe et al., 2014; Clemente, 2000). Moreover, the reduction in heterogeneity could possibly be attributed to the better training of the participants during a practical course and a more detailed protocol. Interestingly, after the intestinal phase, the average total release of free amino acids was 88% for the second trial (Fig. 5a) and 60% for the third (Fig. 5b), both trials performed with the harmonized method. A possible explana-tion for this difference, that was statistically insignificant, could be the change in the procedure for stopping the IVD. For the second trial, a con-centration of 1 mM Pefabloc® was recommended, while for the third trial, this was increased to 5 mM due to the observation of incomplete
Fig. 5.Release of free amino acids after gastric and intestinal phases of IVD. HPLC analysis of samples from both inter-laboratory trials applying the harmonized protocol, trial 2 (a) and trial 3 (b), after the gastric phase (light gray bars) and after the intestinal phase (dark gray bars). SMP represents the free amino acids of undigested SMP, and SMP total is the theoretical value of amino acids present in the SMP. Average values (Av) with standard deviation (SD) are shown in logarithmic scale in mmol/kg of food, error bars are SD between all samples of the cor-responding digestion phase.
inhibition. This highlights the importance of stopping the reaction effec-tively after sampling. The release of free amino acids, determined at the third trial is in a close agreement (58%) with that recently measured after gastric-duodenal digestion of SMP with a model closely related to the harmonized IVD (Picariello et al., 2015).
3.6. Validation of IVD
The harmonized IVD method published by Minekus and coauthors (Minekus et al., 2014) has been established based on physiologically available and publishedin vivoenzyme and salt concentrations. Howev-er, static models are simplified models of a highly complexin vivo diges-tion process. In particular, the status of hydrolysis during the gastric phase is likely to differ from thein vivosituation, especially for solid and semi-solid food matrices, keeping in mind thatin vivo, the chyme is dynamically processed and gradually released to the duodenum dur-ing digestion rather than all at once and the pH is notfixed but gradually decreases. Therefore, it is difficult to fully mimic the kinetic behavior of thein vivosituation with a static model. The analyses presented in this article confirm that the harmonized method improves the comparabili-ty of IVD data and supports the advantages of this methodology as a ro-bust and simple tool to study the digestive fate of oral intake. However, true evaluation of digestive fate remains to be further investigated and corroborated byin vivotrials. Therefore, a direct comparison between results from IVD andin vivowould be a major step to validate the IVD model.
Supplementary data to this article can be found online athttp://dx. doi.org/10.1016/j.foodres.2015.12.006.
Acknowledgments
COST Action FA1005 INFOGEST (http://www.cost-INFOGEST.eu/) is acknowledged for providing funding for travel, meetings, and confer-ences. The work was also supported by the MycoMix project (PTDC/ DTP-FTO/0417/2012), funded by the Fundação para a Ciência e Tecnologia (FCT, Portugal) and by iNOVA4Health: UID/Multi/04462/ 2013 and IF/01097/2013 from FCT. We thank Urs Kämpfer from the De-partment of Chemistry and Biochemistry, University of Berne, for performing the HPLC analyses. The authors declare that they have no conflict of interest.
References
Alemany, L., Cilla, A., Garcia-Llatas, G., Rodriguez-Estrada, M. T., Cardenia, V., & Alegría, A. (2013).Effect of simulated gastrointestinal digestion on plant sterols and their oxides in enriched beverages.Food Research International,52(1), 1–7.
Anson, M. L. (1938).The estimation of pepsin, trypsin, papain, and cathepsin with hemo-globin.The Journal of General Physiology,22(1), 79–89.
Anson, M. L., & Mirsky, A. E. (1932).The estimation of pepsin with hemoglobin.The Journal of General Physiology,16(1), 59–63.
Barbe, F., Menard, O., Le Gouar, Y., Buffiere, C., Famelart, M. H., Laroche, B., ... Dupont, D. (2014).Acid and rennet gels exhibit strong differences in the kinetics of milk protein digestion and amino acid bioavailability.Food Chemistry,143, 1–8.
Bidlingmeyer, B. A., Cohen, S. A., & Tarvin, T. L. (1984).Rapid analysis of amino acids using pre-column derivatization.Journal of Chromatography,336(1), 93–104.
Clemente, A. (2000).Enzymatic protein hydrolysates in human nutrition.Trends in Food Science & Technology,11(7), 254–262.
Cornish-Bowden, A. J., & Knowles, J. R. (1969).The pH-dependence of pepsin-catalysed reactions.Biochemical Journal,113(2), 353–362.
Dupont, D., Mandalari, G., Molle, D., Jardin, J., Leonil, J., Faulks, R. M., ... Mackie, A. R. (2010).Comparative resistance of food proteins to adult and infant in vitro digestion models.Molecular Nutrition & Food Research,54(6), 767–780.
Galea, C. A., Dalrymple, B. P., Kuypers, R., & Blakeley, R. (2000).Modification of the sub-strate specificity of porcine pepsin for the enzymatic production of bovine hide gela-tin.Protein Science,9(10), 1947–1959.
Hur, S. J., Lim, B. O., Decker, E. A., & McClements, D. J. (2011).In vitro human digestion models for food applications.Food Chemistry,125(1), 1–12.
INFOGEST (2014). Static in vitro digestion method for food.https://www.youtube.com/ watch?v=LNSIIb-OJGc(In YouTube)
Kalantzi, L., Goumas, K., Kalioras, V., Abrahamsson, B., Dressman, J. B., & Reppas, C. (2006). Characterization of the human upper gastrointestinal contents under conditions sim-ulating bioavailability/bioequivalence studies.Pharmaceutical Research,23(1), 165–176.
Kang, D., Gho, Y., Suh, M., & Kang, C. (2002).Highly sensitive and fast protein detection with coomassie brilliant blue in sodium dodecyl sulfate-polyacrylamide gel electro-phoresis.Bulletin of the Korean Chemical Society, 2.
Kenmogne-Domguia, H. B., Meynier, A., Boulanger, C., & Genot, C. (2012a).Lipid oxidation in food emulsions under gastrointestinal-simulated conditions: The key role of en-dogenous tocopherols and initiator.Food Digestion,3(1–3), 46–52.
Kenmogne-Domguia, H. B., Meynier, A., Viau, M., Llamas, G., & Genot, C. (2012b).Gastric conditions control both the evolution of the organization of protein-stabilized emul-sions and the kinetic of lipolysis during in vitro digestion.Food & Function,3(12), 1302–1309.
Kopf-Bolanz, K. A., Schwander, F., Gijs, M., Vergeres, G., Portmann, R., & Egger, L. (2012). Validation of an in vitro digestive system for studying macronutrient decomposition in humans.The Journal of Nutrition,142(2), 245–250.
Mandalari, G., Adel-Patient, K., Barkholt, V., Baro, C., Bennett, L., Bublin, M., ... Mills, E. N. (2009).In vitro digestibility of beta-casein and beta-lactoglobulin under simulated human gastric and duodenal conditions: A multi-laboratory evaluation.Regulatory Toxicology and Pharmacology,55(3), 372–381.
Martos, G., Contreras, P., Molina, E., & Lopez-Fandino, R. (2010).Egg white ovalbumin digestion mimicking physiological conditions.Journal of Agricultural and Food Chemistry,58(9), 5640–5648.
McClements, D. J., & Li, Y. (2010).Review of in vitro digestion models for rapid screening of emulsion-based systems.Food & Function,1(1), 32–59.
Menard, O., Cattenoz, T., Guillemin, H., Souchon, I., Deglaire, A., Dupont, D., & Picque, D. (2014).Validation of a new in vitro dynamic system to simulate infant digestion.
Food Chemistry,145, 1039–1045.
Minekus, M., Alminger, M., Alvito, P., Ballance, S., Bohn, T., Bourlieu, C., ... Brodkorb, A. (2014).A standardised static in vitro digestion method suitable for food—An inter-national consensus.Food & Function,5(6), 1113–1124.
Picariello, G., Ferranti, P., Fierro, O., Mamone, G., Caira, S., Di Luccia, A., ... Addeo, F. (2010). Peptides surviving the simulated gastrointestinal digestion of milk proteins: Biological and toxicological implications.Journal of Chromatography. B, Analytical Technologies in the Biomedical and Life Sciences,878(3–4), 295–308.
Picariello, G., Miralles, B., Mamone, G., Sanchez-Rivera, L., Recio, I., Addeo, F., & Ferranti, P. (2015).Role of intestinal brush border peptidases in the simulated digestion of milk proteins.Molecular Nutrition & Food Research,59(5), 948–956.
Piper, D. W., & Fenton, B. H. (1965).pH stability and activity curves of pepsin with special reference to their clinical importance.Gut,6(5), 506–508.
Reddy, I. M., Kella, N. K. D., & Kinsella, J. E. (1988).Structural and conformational basis of the resistance ofβ-lactoglobulin to peptic and chymotryptic digestion.Journal of Agricultural and Food Chemistry,36(4), 737–741.
Shani-Levi, C., Levi-Tal, S., & Lesmes, U. (2013).Comparative performance of milk proteins and their emulsions under dynamic in vitro adult and infant gastric digestion.Food Hydrocolloids,32(2), 349–357.
Ulleberg, E., Comi, I., Holm, H., Herud, E., Jacobsen, M., & Vegarud, G. (2011).Human gastrointestinal juices intended for use in in vitro digestion models.Food Digestion,
2(1–3), 52–61.
Versantvoort, C. H., Oomen, A. G., Van de Kamp, E., Rompelberg, C. J., & Sips, A. J. (2005). Applicability of an in vitro digestion model in assessing the bioaccessibility of myco-toxins from food.Food and Chemical Toxicology,43(1), 31–40.
Vreeburg, R. A., van Wezel, E. E., Ocana-Calahorro, F., & Mes, J. J. (2012).Apple extract induces increased epithelial resistance and claudin 4 expression in Caco-2 cells.
Journal of the Science of Food and Agriculture,92(2), 439–444.
Wickham, M., Faulks, R., & Mills, C. (2009).In vitro digestion methods for assessing the effect of food structure on allergen breakdown.Molecular Nutrition & Food Research,