GENERAL AGREEMENT ON
RESTRICTED
C/RM/S/lOB
18 March 1991
Limited Distribution
TARIFFS AND TRADE
COUNCIL
TRADE POLICY REVIEW MECHANISM
EUROPEAN COMMUNITIES
Report by the Secretariat
In pursuance of the CONTRACTING PARTIES’ Decision of 12 April 1989
concerning the Trade Policy Review Mechanism (L/6490), the Secretariat
submits herewith Volume B (Tables and Appendices) of its report on the
European Communities. Volume A (Text) is presented in document C/RM/S/10A.
The report is drawn up by the Secretariat on its own responsibility.
It is based on the information available to the Secretariat and that
provided by the European Communities. As required by the Decision, in
preparing its report the Secretariat has sought clarification from the
European Communities on their trade policies and practices.
Document C/RM/G/10 contains the report submitted by the European
Communities.
NOTE TO DELEGATIONS
Until further notice, this document is subject to a press embargo.
C/RM/S/10B Page (i) I. 1.1
1.2
1.3
1.4 1.5 1.6 1.71.8
II.
II. 1
II. 2
IV.
IV. 1
IV.2
IV.3
IV.4
IV.5
IV.6
IV. 7
IV. 8
CONTENTS
THE ECONOMIC ENVIRONMENT
Major features of the European Communities economy
Major features of European Communities member States,
1988-89
Import penetration of the European Communities (EC12),
1982-87
Government financing deficit or surplus as percentage
of GDP, 1981-89
Balance on current account by EC member State, 1980-90
European Communities (EC12) external trade by product
group, 1981 and 1989
Intra-trade of the European Communities (EC10) by
product group, 1981 and 1988
Main trading partners of the European Communities,
(EC12), 1981 and 1989
TRADE POLICY REGIME: OBJECTIVES AND FRAMEWORK
Authorizations to restrict intra-EC trade under
Article 115 of the EEC Treaty, 1980-90
EC-internal notifications of draft technical
regulations on basis of Council Directive No. 83/189,
1 January 1984 - 31 May 1990
TRADE POLICIES AND PRACTICES BY MEASURE
Distribution of imports from m.f.n. sources into the
European Communities by range of tariff rates, 1988
European Communities imports from preferential sources
(EC12), 1977-79 and 1987-89
European Communities imports of food products by tariff
treatment, 1978 and 1988
Article XIX actions taken by the European Communities
and individual member States, 1960-1989
Article XIX actions of the European Communities and
member States in force as of 30 June 1990
Voluntary restraints, surveillance and similar measures
affecting imports into the EC and individual member
States, situation as of mid-1990
Duration of EC anti-dumping investigations, July 1980
to December 1989
Anti-dumping actions by the EC, 1980-89
C/RM/S/10B
Page (ii)
IV.9
IV. 10
IV. 11
IV. 12
IV. 13
IV. 14
IV. 15
V.
V.lV. 2
V. 3
V. A
V. 5
V. 6
V. 7
V. 8
V. 9
V.10 V.llV. 12
V. 13
V. 14
V. 15
Anti-dumping actions (price undertakings and definitive
duties) in the EC according to product categories,
July 1980 to December 1989
Notifications of new technical regulations and
certification systems under the GATT Code on Technical
Barriers to Trade by the European Communities
and individual member States, 1980-89
Public sector purchasing/procurement in EC member
States, 1987
Public sector import penetration in five EC member
States, 1985
State aid in the European Communities by member State
(EC12), average 1981-86 and 1986-88
State aid to manufacturing industry and to agriculture
in the European Communities by member State
State aid (subsidies) in EC member States by sector
and function, average 1986-88
TRADE POLICIES BY SECTOR
Abbreviations used in Tables in Chapter V
Trade measures applying in the EC by sector, 1988
Major features of agriculture in the European
Communities, 1960-89
Main agricultural policy instruments in the European
Communities
European Communities (EC10) imports of ten major
agricultural products (mainly food), 1979 and 1988
Intervention stocks of cereals, beef, butter and
skimmed milk powder in the EC, 1986-89
EC expenditure on agriculture by sector, 1980-90
Agricultural support in the European Communities in
main product areas, 1979-85 (EC10) and 1986-89 (EC12)
Production of main agricultural products and self-
sufficiency ratios in the European Communities,
1979-89
Share of cereals in EC compound feedingstuffs
production, 1980-87
European Communities external trade in textiles and
clothing (EC12), 1984-88
Major suppliers of textile products to the European
Communities (EC12), 1988
European Communities (EC12) imports of textiles and
clothing from 19 MFA restrained sources, 1984-88
Employment in the EC steel industry, 1974-88
Major features of EC steel industry, 1980-85
(EC9/EC10) and 1986-89 (EC12)
C/RM/S/IOB
Page (iii)
V. 16
V. 17
V. 18
V. 19
V.20
V. 21
V. 22
V. 23
V. 24
V. 25
VI.
VI. 1
VI.2
VI. 3
VI. 4
VI. 5
AVII.
AI. 1
AI. 2
AI. 3
AI. 4
State aid and total support (PSE estimates) for coal
production in EC member States, 1983-89
Supply and consumption of natural gas in the EC, 1978-89
Production and trade of crude oil in the EC, 1978-88
European Communities (EC12 and EC10) external trade
in road motor vehicles, 1984-88
European Communities (EC5) production, exports, imports
and apparent consumption of road motor vehicles,
1984-88
European Communities imports of road motor vehicles
from Japan, 1984-88
Employment and turnover in the EC aerospace industry,
1981-88
Aerospace trade of the EC (civil trade), 1981-88
Production of merchant ships in EC member States,
1975-88
Direct and indirect subsidies for shipbuilders in EC
member States
TRADE DISPUTES AND CONSULTATIONS
List of GATT Article XXIII complaints against the EC
and member States, 1960-90
Article XXIII complaints by the EC against other
contracting parties, 1960-90
Article XXIII complaints against the EC or individual
member States, 1960-90
Article XXIII complaints by the EC against other
contracting parties, 1960-90
Complaints under the Tokyo Round Agreements involving
the EC, 1980-90
APPENDIX CHARTS
1
Merchandise trade of the European Communities (EC12),
1958-89
APPENDIX TABLES
Leading products in European Communities (EC12)
external trade, 1981-88
Leading products in European Communities (EC10)
external trade, 1981-88
Leading products in intra-EC trade (EC12), 1981-88
Leading products in intra-EC trade (EC10), 1981-88
C/RM/S/10B
Page (iv)
AI. 5
European Communities (EC6, EC12) third country exports
by product group, 1968, 1978 and 1988
106
AI.6
European Communities (EC6, EC12 third country imports
by product group, 1968, 1978 and 1988
107
AI .7
Major components of Belgium-Luxembourg’s trade,
1981 and 1988
108
AI.8
Major components of Denmark’s trade, 1981 and 1988
109
AI.9
Major components of France’s trade, 1981 and 1988
110
AI ,10
Major components of Germany’s trade, 1981 and 1988
111
AI. 11
Major components of Greece’s trade, 1981 and 1988
112
AI. 12
Major components of Ireland’s trade, 1981 and 1988
113
AI. 13
Major components of Italy’s trade, 1981 and 1988
114
AI. 14
Major components of the Netherland’s trade,
1981 and 1988
115
AI. 15
Major components of Portugal’s trade, 1981 and 1988
116
AI. 16
Major components of Spain’s trade, 1981 and 1988
117
AI. 17
Major components of the United Kingdom’s trade,
1981 and 1988
118
AI. 18
Leading partners in European Communities (EC12)
C/RM/S/lOB
Page 1
Table 1.1
Major features of the European Co—inities econony
Absolute figures Index
(World-100)
Population mid 1985 321.9 million 7
of which: urban (80) per cent 174
Population mid 1989 326 million 6
Growth of population 1980-89 0.2 per cent 12
Life expectancy at birth, 1988 73 years 95
Area 2,254 thsd. sq. kms. 2
GDP, 1985 3,302 Billion ECU 20
GDP, 1989 4,400 Billion ECU 25
GDP per capita, 1985 10,325 ECU 305
GDP per capita. 1989 13,525 ECU
. . .
Percentage share in GDP, 1988
Agriculture 3 per cent 53
Industry 35 per cent 102
Manufacturing 25 per cent 111
Services 63 per cent 102
Percentage share in employment, 1988
Agriculture 7 per cent 94
Industry 33 per cent 108
Services 60 per cent 97
Merchandise exports,f.o.b., 1989 1,043 Billion ECU 38
Third countries 413 Billion ECU 19
Intra EC 626 Billion ECU 23
Merchandise imports,c.i.f., 1989 1,074 Billion ECU 38
Third countries 447 Billion ECU 20
Intra EC 624 Billion ECU 22
Merchandise exports to GDP ratio, 1988 23.8 per cent
. . .
Third countries 9.4 per cent
. . .
Intra EC 14.3 per cent
. . .
Merchandise imports to GDP ratio, 1988 24.5 per cent
. . .
Third countries 10.2 per cent
. . .
Intra EC 14.2 per cent
. . .
Commercial services: credits, 1988 118 Billion ECU
. . .
Cotmiercial services: debits, 1988 108 Billion ECU
. . .
Note: The "world data" for life expectancy and for output and employment structures underlying the index column refer to industrial countries only.
Index figures on total EC merchandise imports and exports and on intra EC trade are based on world trade, including intra EC trade. Index figures on EC
external exports and imports relate to world trade, excluding intra EC trade.
Not available.
C/RM/S/IOB
Page 2
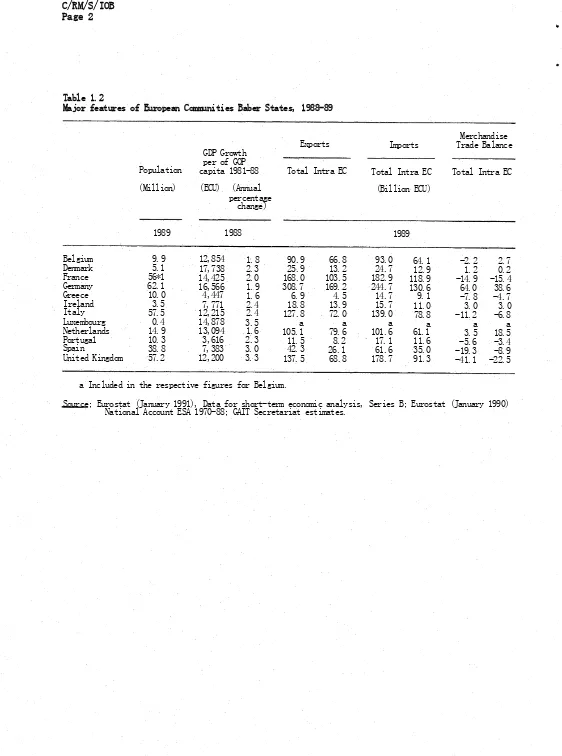
Table 1.2
Major features of European Communities Baber States, 1988-89
GDP Growth Exports Imports
Merchandise Trade Balance
Population capita 1981-88per of GOP Total Intra EC Total Intra EC Total Intra EC
(Million) (ECU) (Annual
percentage change)
(Billion ECU)
1989 1988 1989
Belgium 9.9 12,854 1.8 90.9 66.8 93.0 64.1 -2.2 2.7
Denmark 5.1 17,738 2.3 25.9 13.2 24.7 12.9 1.2 0.2
France 56*1 14,425 2.0 168.0 103.5 182.9 118.9 -14.9 -15.4
Germany 62.1 16,566 1.9 308.7 169.2 244.7 130.6 64.0 38.6
Greece 10.0 4,447 1.6 6.9 4.5 14.7 9.1 -7.8 -4.7
Ireland 3.5 7,771 2.4 18.8 13.9 15.7 11.0 3.0 3.0
Italy 57.5 12,215 2.4 127.8 72.0 139.0 78.8 -11.2 -6.8
Luxembourg 0.4 14,878 3.5 a a a a a a
Netherlands 14.9 13,094 1.6 105.1 79.6 101.6 61.1 3.5 18.5
Portuga1 10.3 3,616 2.3 11.5 8.2 17.1 11.6 -5.6 -3.4
Spain 38.8 7,383 3.0 42.3 26.1 61.6 35.0 -19.3 -8.9
United Kingdom 57.2 12,200 3.3 137.5 68.8 178.7 91.3 -41.1 -22.5
a Included in the respective figures for Belgium.
C/RM/S/IOB
Page 3
Table 1.3
Inport penetration of the European Coaaunities (EC12), 1982-87
(Imports as percentage of apparent consumption)
Intra-EC trade External trade
1982-83 1984-85 1986-87 1982-83 1984-85 1986-87
Primary products 11.31 13.07 12.78 40.20 38.08 27.80
Agriculture 11.17 12.05 13.16 18.10 18.58 14.75
Manufactures 17.03 18.31 19.29 10.51 11.67 11.15
Food, beverages, tobacco 9.91 10.23 10.79 4.28 4.10 3.63
Textiles 21.05 22.79 22.82 10,00 10.68 10.82
Clothing 26.60 29.03 30.37 20.68 22.86 25.14
Chemicals 21.35 23.19 23.28 8.93 9.75 8.92
Ferrous and non-ferrous metals 11,38 12.67 11.68 6.80 7.23 6.13
Transport equipment 24.43 24.89 26.09 8.05 9.28 9.20
Machinery and other manufactured goods 26.87 28.73 31.25 20.71 23.33 23.29
Note: Apparent consumption is defined as gross output plus external imports minus external exports.
C/RM/S/10B
Page 4
Table 1.4
Government financing deficit or surplus as percentage of GDP, 1981-89
1981 1983 1985 1987 1988 1989
European Communities -5.3 -5.3 -5.2 -4.2 -3.6 -3.0
EMS-member countries
Narrow-band countries -4.0 -3.9 -2.7 -2.6 -2.3 -1.3
Minimum (excl. Luxembourg) -1.9 -2.5 -1.1 -1.8 0.2 0.1
Maximum -13.7 -11.6 -11.1 -9.1 -6.5 -6.0
Others
Spain -3.9 -4.8 -7.0 -3.6 -3.2 -2.6
Italy -11.5 -10.7 -12.5 -11.2 -10.6 -10.3
Non-EMS countries
Greece -11.0 -8.3 -12.3 -14.9 -19.9 -14.5
Portugal -9.5 -9.1 -10.1 -6.9 -6.5 -6.0
United Kingdom -2.5 -3.4 -2.7 -1.5 0.8 1.5
C/RM/S/10B
Page 5
Table 1.5
Balance on current account fay EC member State, 1980-90
(Per cent of GDP)
1961-68 1969-79 1980 1985 1986 1987 1988 1989 1990
Belgium 0.3 0.6 -4.3
Denmark -1.8 -2.9 -3.7
France 0.3 0.3 -0.6
Germany 0.6 1.0 -1.7
Greece -3.0 -2.5 0.5
Ireland -1.7 -5.5 -11.8
Italy 1.7 0.4 -2.2
Luxembourg 3.3 17.0 18.7
Netherlands 0.2 1.1 -1.5
Portugal -1.4 -1.8 -5.9
Spain -0.8 -0.6 -2.4
United Kingdom -0.3 -0.5 1.5
0.3 2.0 1.2 1.0 1.0 0.3
-4.6 -5.5 -3.0 -1.8 -1.3 0.0
0.1 0.5 -0.3 -0.4 -0.2 -0.3
2.6 4.4 4.1 4.1 4.7 2.6
-8.2 -5.3 -3.1 -1.7 -4.8 -5.1
-4.0 -2.9 1.3 1.8 1.6 1.2
-0.9 0.5 -0.2 -0.6 -1.3 -1.3
43.5 39.4 31.6 34.3 31.5 27.3
4.1 2.7 1.4 2.4 3.6 3.3
0.4 2.4 -0.4 -4.4 -1.2 -1.2
1.6 1.7 0.1 -1.1 -2.9 -3.8
0.6 -0.8 -1.9 -4.1 -3.7 -2.8
0.7 1.4 0.7 0.2 0.2 r p Lo
Total 0.3 0.2 -1.2
Note: A positive figure denotes a current account surplus and a negative figure a current account deficit.
C/RM/S/lOB
Page 6
Table 1.6
European Communities (EC12) external trade by product group, 1981 and 1989
(Per cent and billion ECU)
Share in total merchandise exports
1981 1989
Per cent Per cent
Other non-electric machinery 13.8 13.6 Fuels 38.4 14.8
Chemicals 11.2 12.6 Office machinery and
Other consumer goods 8.6 11.3 telecommunications equi. 5.0 11.0
Other semi-manufactures 9.3 9.5 Food 11.4 9.2
Automotive products 8.8 8.8 Other consumer goods 2.7 9.2
Food 9.6 7.6 Other semi-manufactures 5.5 8.3
Office machinery and Chemicals 4.5 6.6
telecommunications equ. 3.4 5.2 Raw materials 5.3 5.5
Other transport equipment 4.8 5.0 Other non-electric machinery 3.4 5.5
Electric machinery and apparatus 4.0 4.4 Automotive products 2.1 4.4
Iron and steel 6.1 4.2 Clothing 5.4 4.1
Residual 2.4 3.2 Other transport equipment 2.3 3.3
Textiles 3.0 3.1 Electric machinery and apparatus 1.6 3.2
Fuels 7.1 2.9 Non-ferrous metals 2.3 3.2
Clothing 1.6 2.4 Ores and minerals 3.3 2.9
Power generating machinery 2.2 2.1 Residual 1.3 2.7
Non-ferrous metals 1.7 1.6 Textiles 2.6 2.4
Raw materials 1.4 1.4 Iron and steel 1.3 2.2
Ores and minerals 0.6 0.7 Power generating machinery 1.1 1.5
Billion ECU, f.o.b. BillionECU* c.i.'
Total merchandise exports 265.4 413.0 Total merchandise imports 318.3 446.7
Source: UNSO, Comtrade data base; Eurostat, External Trade Statistical Yearbook, and monthly statistics. Share in total merchandise imports
C/RM/S/lOB
Page 7
Intra-trade of the European Cownitles (EC10) by product group, 1961 and 1988
(Per cent and billion ECU) Table 1.7
Share in merchandise trade
1981 1988
Food 13.8 13.4
Chemicals 11.7 13.1
Automotive products 9.0 11.0
Other semi-manufactures 8.9 9.3
Other consumer goods 7.8 9.2
Other non-electric machinery 7.0 8.1
Office machinery and telecommunications equ. 4.1 6.5
Iron and steel 4.4 4.4
Textiles 4.0 4.0
Electric machinery & apparatus 3.2 3.9
Fuels 12.0 3.9
Clothing 2.7 2.8
Other transport equ i pment 3.0 2.4
Non-ferrous metals 2.3 2.3
Raw materials 2.3 2.2
Ores and minerals 1.3 1.1
Residual 1.4 1.1
Power generating machinery 0.9 0.9
Total merchandise exports 100 100
Memorandum:
Intra EC trade (billion ECU) 275.2 463.0
Intra EC trade as percentage of overall trade:
Exports 50.9 54.7
Imports 47.5 54.5
C/RM/S/10B
Page 8
Table 1.8
Main trading partners of the European Coraunities (EC12), 1981 and 1989
(Per cent)
Share in total Share in total
merchandise exports merchandise imports
1981 1989 1981 1989
United States 14.5 18.9 United States 17.2 18.7
Switzerland 8.4 9.7 Japan 5.4 10.4
Austria 4.4 6.1 Switzerland 5.3 7.2
Sweden 4.7 5.8 Sweden 4.0 5.7
Japan 2.2 5.1 Austria 2.4 4.3
Soviet Union 3.1 3.1 Norway 3.3 3.4
Canada 1.7 2.6 Soviet Union 4.5 3.4
Finland 1.5 2.3 Brazil 1.8 2.3
Norway 2.3 2.1 Finland 1.6 2.2
Saudia Arabia 4.1 2.1 Canada 2.2 2.2
Memorandum: Memorandum:
Developed countries 47.5 60.2 Developed countries 46.4 60.6
Developing countries 44.6 31.8 Developing countries 45.4 30.7
Asia 8.2 11.5 Asia 7.1 11.9
Latin America 6.2 7.4 Africa 11.9 7.6
Middle East 14.0 7.0 Middle east 20.0 6.1
Africa 16.2 4.0 Latin America 6.4 5.6
Eastern Trading Area 7.9 8.0 Eastern Trading Area 8.2 8.7
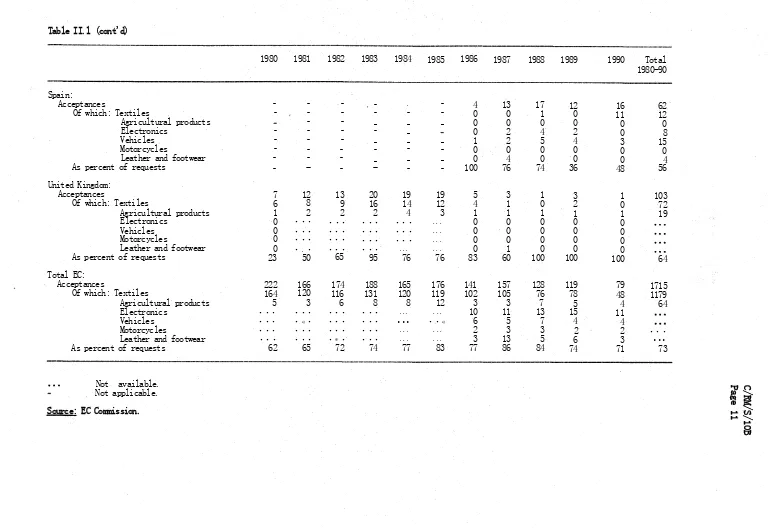
Authorizations to restrict intra-EC trade under Article 115 of the EEC Treaty, 1980-90 (Number and percent)
Table II.1
1980 1981 1982 1983 1984 1985 1986 1987 1988 1989 1990 Total
1980-90
Benelux:
Acceptances 25 17 19 22 14 4 0 1 2 0 0 104
Of which: Textiles 19 16 17 16 12 2 0 1 2 0 0 85
Agricultural products 2 1 1 1 1 1 0 0 0 0 0 7
Electronics
• • •
0• • •• • •• • •• • •
0 0 0 0 0. . .
Vehicles
• • •
0• • •• • •• • •• • •
0 0 0 0 0• • •
Motorcycles
• • •
0• • •• • . • • •• • •
0 0 0 0 0• • •
Leather and footwear
• • •
0* • •• • •• * •• • •
0 0 0 0 0• • •
As percent of requests 73 74 100 100 100 100 0 100 67 0 0 87
Denmark:
Acceptances 4 0 0 0 0 0 0 2 0 0 0 6
Of which: Textiles 4 0 0 0 0 0 0 2 0 0 0 6
Agricultural products 0 0 0 0 0 0 0 0 0 0 0 0
Electronics 0 0 0 0 0 0 0 0 0 0 0 0
Vehicles 0 0 0 0 0 0 0 0 0 0 0 0
Motorcycles 0 0 0 0 0 0 0 0 0 0 0 0
Leather and footwear 0 0 0 0 0 0 0 0 0 0 0 0
As percent of requests 100 0 0 0 0 0 0 100 0 0 0 100
France:
Acceptances 105 80 85 57 39 66 67 62 52 73 37 723
Of which: Textiles 63 55 55 39 26 43 52 44 32 54 22 485
Agricultural products 2 0 1 2 0 4 0 1 2 1 1 14
Electronics
• • •
• • •• • •• • •• • •• * •
10 9 9 13 11• • •
Vehicles
• • •
• • •• • •• • •• • •• • •
0 0 0 0 0• • •
Motorcycles
• • •
• • •• • •• • •• • •• • •
0 0 0 0 0» • •
Leather and footwear
• • •
• • •• • •• • •• • •• • •
1 5 4 4 2• • •
As percent of requests 84 73 76 59 68 80 78 86 87 83 80 77
Germany:
Acceptances 1 2 2 4 0 0 0 0 0 0 0 9
Of which: Textiles 1 2 2 4 0 0 0 0 0 0 0 9
Agricultural products 0 0 0 0 0 0 0 0 0 0 0 0
Electronics 0 0 0 0 0 0 0 0 0 0 0 0
Vehicles 0 0 0 0 0 0 0 0 0 0 0 0
Motorcycles 0 0 0 0 0 0 0 0 0 0 0 0
Leather and footwear 0 0 0 0 0 0 0 0 0 0 0 0
Table II.1 (cont'd)
1980 1981 1982 1983 1984 1985 1986 1987 1988 1989 1990 Total
1980-90
Greece:
Acceptances
-
0 0 0 0 0 0 0 2 2 1 5Of which: Textiles
-
0 0 0 0 0 0 0 0 0 0 0Agricultural products
-
0 0 0 0 0 0 0 2 2 1 5Electronics
-
0 0 0 0 0 0 0 0 0 0 0Vehicles
-
0 0 0 0 0 0 0 0 0 0 0Motorcycles
-
0 0 0 0 0 0 0 0 0 0 0Leather and footwear
-
0 0 0 0 0 0 0 0 0 0 0As percent of requests
-
0 0 0 0 0 0 0 100 100 100 100Ireland:
Acceptances 57 32 26 48 59 57 45 52 33 12 5 426
Of which: Textiles 47 28 26 47 57 55 43 49 33 12 5 402
Agricultural products 0 0 0 0 0 0 0 0 0 0 0
• • .
Electronics
• • •
• • •
0• • •• • •« • •
0 0 0 0 0• • •
Vehicles
• • •
• • •
0• • •• • •• • •
0 0 0 0 0• • •
Motorcycles
» • •
• * »
0. . .
• • •* • •
0 0 0 0 0• • •
Leather and footwear
• • •
« • •
0* • * * • « • * *
2 3 0 0 0• • •
As percent of requests 49 56 79 91 84 89 68 87 87 71 50 73
Italy:
Acceptances 23 23 29 37 34 30 20 23 19 17 18 273
Of which: Textiles 14 11 7 9 11 7 3 8 8 10 10 98
Agricultural products 0 0 0 0 2 4 2 1 2 1 1 13
Electronics
• • •
• • •* • •• • •• • •• • •
0 0 0 0 0• • •
Vehicles
• • •
• • •• • •• • *• • •• • •
5 3 1 1 1• • •
Motorcycles
* • •
• • •• • •• • •• • •• • •
2 2 2 1 1• • •
Leather and footwear
• • •
• • •• • •• • •• • •• • •
0 0 1 2 1• • •
As percent of requests 52 58 53 65 69 86 91 96 80 100 90 71
Portugal:
Acceptances
-
-
-
-
-
-
0 1 1 1 1 4Of which: Textiles
-
-
-
_
-
-
0 0 0 0 0 0Agricultural products
-
-
-
-
-
-
0 0 0 0 0 0Electronics
-
-
_
_
_
_
0 0 0 0 0 0Vehicles
_
_
_
_
_
0 0 0 0 0 0Motorcycles
-
-
-
-
-
-
0 1 1 1 1 4Leather and footwear
-
-
-
-
-
0 0 0 0 0 0As percent of requests
-
-
-
—
-
~
0 100 100 100 100 1007'(cont’d)
C/RM/S/10B
Table II.l (cont'd)
1980 1981 1982 1983 1984 1985 1986 1987 1988 1989 1990 Total
1980-90
Spain:
Acceptances - - - , - . - 4 13 17 12 16 62
Of which: Textiles - - - 0 0 1 0 11 12
Agricultural products - - _ _ _ 0 0 0 0 0 0
Electronics - - - - _ 0 2 4 2 0 8
Vehicles - - - _ _ _ 1 2 5 4 3 15
Motorcycles - - - 0 0 0 0 0 0
Leather and footwear - - - _ _ _ 0 4 0 0 0 4
As percent of requests - - - 100 76 74 36 48 56
United Kingdom:
Acceptances 7 12 13 20 19 19 5 3 1 3 1 103
Of which: Textiles 6 8 9 16 14 12 4 1 0 2 0 72
Agricultural products 1 2 2 2 4 3 1 1 1 1 1 19
Electronics 0 • • • • • • • • • • • • ... 0 0 0 0 0
Vehicles 0 • • • • • • • • • • • • ... 0 0 0 0 0
Motorcycles 0 • • • • • • • • • • • • ... 0 0 0 0 0
Leather and footwear 0 • . • • • • • • • ... ... 0 1 0 0 0
As percent of requests 23 50 65 95 76 76 83 60 100 100 100 64
Total EC:
Acceptances 222 166 174 188 165 176 141 157 128 119 79 1715
Of which: Textiles 164 120 116 131 120 119 102 105 76 78 48 1179
Agricultural products 5 3 6 8 8 12 3 3 7 5 4 64
Electronics • • • • • • • • • • • • ... ... 10 11 13 15 11
Vehicles • • • • « • • • • • • •
...
• • « 6 5 7 4 4Motorcycles • • • • • • • • • • • • ... ... 2 3 3 2 2 • • •
Leather and footwear • • • • • • • * • • • • ... ... 3 13 5 6 3
...
As percent of requests 62 65 72 74 77 83 77 86 84 74 71 73
Not available. Not applicable.
Source: EC Commission.
C/RM/S/10B
[image:16.841.43.811.43.571.2]EC-internal notifications of draft technical regulations on basis of Council Directive Mo. 83/189,
1 January 1984 - 31 Hay 1990
(Number of cases)
Table II.2
Notifications
Comments
£
Member States
Commission
Detailed opinions
û
Member States Commission
Intention of
EC Directive
Germany
338
71
72
124
125
24
France
196
64
31
38
40
12
United Kingdom
104
25
13
43
16
6
Denmark
96
32
16
27
24
9
Spain
73
35
18
24
28
4
Netherlands
72
30
6
32
7
9
Italy
60
9
3
8
15
0
Belgium
58
20
8
29
15
7
Greece
33
17
4
4
16
2
Ireland
26
5
3
3
3
1
Portugal
16
4
6
5
7
0
Luxembourg
3
2
0
1
0
0
TOTAL
1075
314
190
338
296
74
a Figures contain the total number of comments or of detailed opinions put forward by the individual member
States.
Source; EC Commission.
C/RM/S/10B
C/RM/S/10B
Page 13
Distribution of imports from m.f .n. sources into the European
Communities by range of tariff rates, 1988
(Per cent)
Table IV.l
Tariff
range
Agricultural
products
Industrial
products
All
products
Percent of m.f.n.
imports
Free
38.4
29.3
30.0
0 - 5Z
12.7
25.6
24.8
5.1 - 102
16.3
35.0
33.7
10.1 -
15Z
6.7
9.0
8.8
15.1 - 201
7.6
0.6
1.1
Over 20.1Z
2.9
0.0
0.2
Unspecified
15.4
0.5
1.4
Total
100
100
100
Note: In agriculture, variable levies substitute for tariffs
across a broad range of products.
C/RM/S/lOB
Page 14
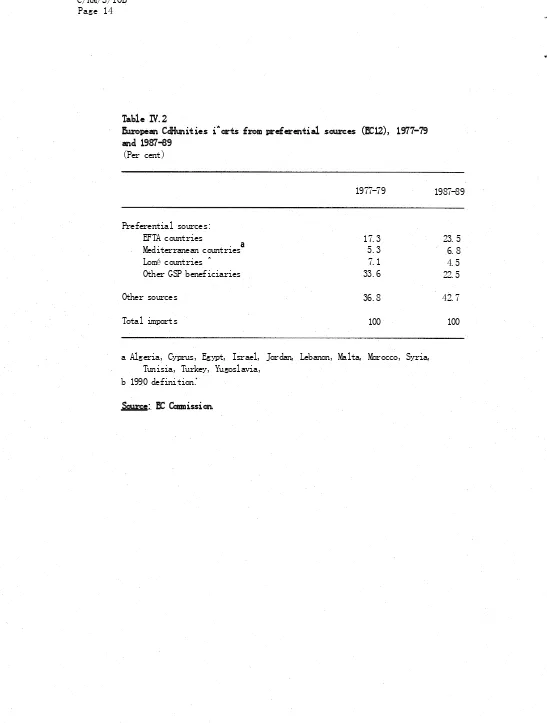
Table IV.2
European CdHunities i^orts from preferential sources (EC12), 1977-79
and 1987-89
(Per cent)
1977-79 1987-89
Preferential sources:
EFTA countries 17.3 23.5
Mediterranean countries 5.3 6.8
Lomé countries ^ 7.1 4.5
Other GSP beneficiaries 33.6 22.5
Other sources 36.8 42.7
Total imports 100 100
a Algeria, Cyprus, Egypt, Israel, Jordan, Lebanon, Malta, Morocco, Syria, Tunisia, Turkey, Yugoslavia,
b 1990 definition.
C/RM/S/IOB
Page 15
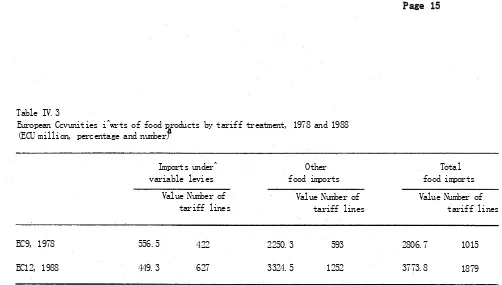
Table IV.3
European Ccvunities i^wrts of food products by tariff treatment, 1978 and 1988 (ECU million, percentage and number)
Imports under^ Other Total
variable levies food imports food imports
Value Number of Value Number of Value Number of
tariff lines tariff lines tariff lines
EC9, 1978 556.5 422 2250.3 593 2806.7 1015
EC12, 1988 449.3 627 3324.5 1252 3773.8 1879
a Calculations were made at tariff line level, including products under the SITC (Rev.3) categories 0, 1, 22 and 4. Basic tariff line data were allocated according to CCCN (1978) or HS (1988) nomenclature,
b All imports to which variable levies apply, whether or not in addition to tariffs.
C/RM/S/10B
Page 16
Table IV.4
Article XIX actions taken by the European Communities and individual member
States, 1960-1989
1960-69
1970-79
1980-89
1960-89
European Communities
0
4
13
17
(Member States)
(3)
(0)
(0)
(3)
Agriculture and food
01
9
10
Electrical and electronic
products
0
2
2
4
Textiles
0
1
1
2
Other products
0 (3)
o
1
1 (3)
Note: Figures for the European Communities include actions taken by the EC
which are confined to one or more member States.
C/RM/S/lOB
Page 17
Table IV.5
Article XIX actions of the European Communities and member States in force
as of 30 June 1990
Product
Measure
Date of
introduction
Reference
European Communities
(a) Dried grapes
Minimum import price
October 1982
L/5399 &
Adds.1-34
.(b) Morello cherries
Minimum import price
June 1985
L/5841 &
Adds. 1-3
(c) Processed cherries
Minimum import price
July 1989
L/6560 Sc
Add.1-2
Germany
(h) Hard coal and hard
coal products
Individual licensing
Sept. 1958
L/855,
L/920
C/RM/S/IOB
Page 18
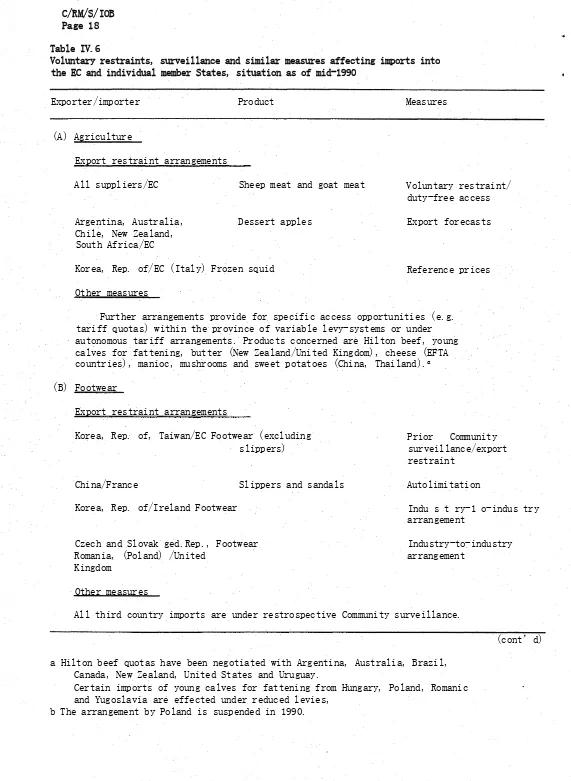
Table IV.6
Voluntary restraints, surveillance and similar measures affecting imports into
the EC and individual member States, situation as of mid-1990
Exporter/importer
Product
Measures
(A) Agriculture
Export restraint arrangements
All suppliers/EC
Sheep meat and goat meat
Argentina, Australia,
Dessert apples
Chile, New Zealand,
South Africa/EC
Korea, Rep. of/EC (Italy) Frozen squid
Other measures
Further arrangements provide for specific access opportunities (e.g.
tariff quotas) within the province of variable levy-systems or under
autonomous tariff arrangements. Products concerned are Hilton beef, young
calves for fattening, butter (New Zealand/United Kingdom), cheese (EFTA
countries), manioc, mushrooms and sweet potatoes (China, Thailand).
a(B) Footwear
Export restraint arrangements
Prior
Community
surveillance/export
restraint
Autolimitation
Indu s t ry-1 o-indus try
arrangement
Industry-to-industry
arrangement
All third country imports are under restrospective Community surveillance.
(cont’d)
a Hilton beef quotas have been negotiated with Argentina, Australia, Brazil,
Canada, New Zealand, United States and Uruguay.
Certain imports of young calves for fattening from Hungary, Poland, Romanic
and Yugoslavia are effected under reduced levies,
b The arrangement by Poland is suspended in 1990.
Korea, Rep. of, Taiwan/EC Footwear (excluding
slippers)
China/France
Slippers and sandals
Korea, Rep. of/Ireland Footwear
Czech and Slovak ged.Rep., Footwear
Romania, (Poland) /United
Kingdom
Other measures
Voluntary restraint/
duty-free access
Export forecasts
C/RM/S/IOB
Page 19
Table IV.6 (cont’d)
Exporter/importer
Product
Measures
(C) Textiles (outside MFA)
Exoort restraint arrangements
Bulgaria/EC
MFA Textiles and Clothing
Export restraints
(1987-91)
Soviet Union/EC
MFA Textiles and Clothing
Export restraints
(1980-92)
Japan/EC
Certain textiles and
clothing categories
£1
Export ceilings
Cyprus/EC
Certain textiles and
clothing categories
Informal restraint
arrangements
Egypt/EC
Certain textiles and
clothing categories
Informal restraint
arrangements
Malta/EC
Certain textiles and
clothing categories
Informal restraint
arrangements
Morocco/EC
Certain textiles and
clothing categories
Informal restraint
arrangements
Tunisia/EC
Certain textiles and
clothing categories
Informal restraint
arrangements
Turkey/EC
Certain textiles and
clothing categories
Informal arrangement
with Turkish
manufacturers
Yugoslavia
Certain textiles and
clothing categories
Formal restraint
arrangement
Chile, Bolivia,
Paraguay, Honduras,
Venezuela, Costa Rica,
Cuba, Ecuador, El Salvador,
Nicaragua/EC
Exchange of letters
a The EC Commission is not aware of these measures.
C/RM/S/IOB
Page 20
Table IV.6 (cont’d)
Exporter/importer
Product
Measures
(D) Steel and Steel ]Products
Export restraint arrangements
Austria/EC
Steel
Consultation mechanism
Brazil/EC
Pig iron and steel
Voluntary restraint/
price monitoring
Bulgaria/EC
Steel
Voluntary restraint/
price monitoring
Czech and Slovak F.R,./EC
Steel
Voluntary restraint/
price monitoring
Finland/EC
Steel
Consultation mechanism
Hungary/EC
Steel
Voluntary restraint/
price monitoring
Japan/EC
Steel
Export cartels
Poland/EC
Steel
Voluntary restraint/
price monitoring
Romania/EC
Steel
Voluntary restraint/
price monitoring
Sweden/EC
Steel
Consultation mechanism
EC/United States
Steel and steel products
Export restraint
arrangement
Other measures
Other suppliers are subject to a basic price mechanism. Price
undercuttings are taken as indication of dumping and may lead to anti-dumping
action or to the adoption of other restrictive measures.
C/RM/S/IOB
Page 21
Table IV.6 (cont’d)
Exporter/importer
Product
Measures
(E) Machinery
Export restraint
: arrangements
Japan/EC
Machine tools for planing,
gear cutting, etc.
Community surveillance/
export monitoring/
moderation
Japan/EC
Machining centres
Community surveillance/
export monitoring/
moderation
Japan/EC
NC lathes
Community surveillance/
export monitoring/
moderation
Japan/EC
Forklift trucks
Community surveillance/
export monitoring/
moderation
Japan/EC
Ball bearings
Exports restraints
a
Japan/France
Machine tools
(Machining centres,
NC lathes)
Restraint arrangement
Other measures
Imports of
under Community
personal computers and electropneumatic drills from Japan are
surveillance.
(cont*d)
a The EC Commission is not aware of these restraints.
C/RM/S/IOB
Page 22
Table IV.6 (cont * d)
Exporter/importer
Product
Measures
(F) Electrical and Electronic
Household Equipment
Export restraint arrangements
Japan/EC
Colour TV sets
Community surveillance/
export monitoring
Japan/EC
Colour TV tubes
Community surveillance/
export monitoring
Japan/EC
Video tape recorders
Community surveillance/
export monitoring
Korea, Rep. of/EC
Microwave ovens
Export moderation
(industry)
Korea, Rep. of/EC
Video tape recorders
Community surveillance/
export monitoring/
moderation
Japan/Germany
Colour TV sets
Export moderation
Japan/France
TV tubes
Indus try-to-indus try
arrangement
Japan/France
Video tape recorders
Industry-to-industry
arrangement
a The EC Commission is not aware of this measure.
C/RM/S/IOB
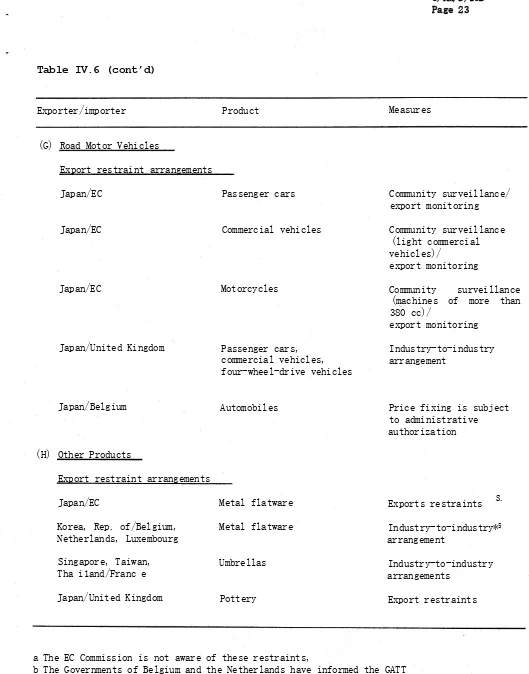
Page 23
Table IV.6 (cont’d)
Exporter/importer
Product
Measures
(G) Road Motor Vehicles
Export restraint arrangements
Japan/EC
Passenger cars
Community surveillance/
export monitoring
Japan/EC
Commercial vehicles
Community surveillance
(light commercial
vehicles)/
export monitoring
Japan/EC
Motorcycles
Community
surveillance
(machines of more than
380 cc)/
export monitoring
Japan/United Kingdom
Passenger cars,
commercial vehicles,
four-wheel-drive vehicles
Industry-to-industry
arrangement
Japan/Belgium
Automobiles
Price fixing is subject
to administrative
authorization
(H) Other Products
Export restraint arrangements
Japan/EC
Metal flatware
Exports restraints
S.Korea, Rep. of/Belgium,
Netherlands, Luxembourg
Metal flatware
Industry-to-industry*
5arrangement
Singapore, Taiwan,
Tha i1and/Franc e
Umbrellas
arrangements
Industry-to-industry
Japan/United Kingdom
Pottery
Export restraints
a The EC Commission is not aware of these restraints,
[image:28.589.11.540.53.727.2]G/RM/S/10B
Page 24
Table IV.7
Duration of EC anti-diafring investigations, July 1980 to Decenber 1989
(Number of investigations)
Period
Total number of initations
Duration of investigations in months
Outstanding 0-12 13-14 15-16 17-18 19-20 21-22 23-24 25-36 37-48
7.80 - 6.81 35 28 2 4 1 0
7.81 - 6.82 57 46 4 3 1 1 2 0
7.82 - 6.83 47 36 11 0
7.83 - 6.84 39 28 7 3 1 0
7.84 - 6.85 56 26 3 11 1 5 10 0
7.85 - 6.86 19 17 1 1 0
7.86 - 6.87 27 14 3 4 2 3 1
7.87 - 6.88 40 2 1 5 21 4 3 1 3
7.88 - 6.89 43 3 6 8 2 24
7.89 - 12.89 9 9
Total 372 200 32 32 31 14 8 4 12 2 37
C/RM/S/10B
Page 25
Table IV.8
Anti-4aping actions by the EC. 1980-89
(Number of cases)
1980 1981 1982 1983 1984 1985 1986 1987 1988 1989
Total 1980-89
Complaints 20 29 24 27 71 62 46 75 57 38 449
Initiations 25 47 55 36 49 36 24 39 40 27 378
Measures taken 53 16 42 47 32 12 29 16 18 14 279
thereof: def init ive duties 7 10 7 20 5 8 4 8 18 9 96
price undertakings 46 6 35 27 27 4 25 8 0 5 183
Findings of no dumping 7 7 3 3 4 2 4 4 0 0 34
Findings of no injury 1 6 6 8 6 15 7 4 5 5 63
Measures in force3 53 69 111 156 187 166 187 169 133 120
-a Figures refer to measures taken after 1 January 1980.
Anti-dunping actions (price undertakings and definitive duties) in the EC according to product categories, July 1980 to December 1989
(Number of cases) Tabìe IV.9
Period Total Chemical
and allied materials
Mechanical engineer
ing
Textiles and all red materials
Iron and steel (EEC + ECSC)
Consumer elec tronics
Wood and paper
Office equip ment
Other
7.80 - 6.81 Total 19 7 8 1 2 0 0 0 1
Price undertakings 13 4 6 0 2 0 0 0 1
Definitive duties 6 3 2 1 0 0 0 0 0
7.81 - 6.82 Total 30 10 11 2 1 0 1 0 5
Price undertakings 20 3 11 0 1 0 1 0 4
Definitive duties 10 7 0 2 0 0 0 0 1
7.82 - 6.83 Total 48 37 4 1 4 0 1 0 1
Price undertakings 38 32 3 1 1 0 1 0 0
Definitive duties 10 5 1 0 3 0 0 0 1
7.83 - 6.84 Total 34 15 2 4 6 0 1 0 6
Price undertaki ngs 20 9 1 2 1 0 1 0 6
Definitive duties 14 6 1 2 5 0 0 0 0
7.84 - 6.85 Total 28 11 2 0 1 0 1 1 12
Price undertakings 22 9 0 0 1 0 1 0 11
Definitive duties 6 2 2 0 0 0 0 1 1
7.85 - 6.86 Total 22 2 6 0 0 2 3 0 9
Price undertakings 14 0 3 0 0 1 3 0 7
Table IV.9 (cont'd)
Period Total Chemical
and allied materials
Mechanical engineer
ing
Text lies and allied materials
Iron and steel (EEC + ECSC)
Consumer elec tronics
Wood and paper
Office equip ment
Other
7.86 - 6.87 Total 23 11 0 4 1 0 0 3 4
Price undertakings 20 10 0 4 1 0 0 2 3
Definitive duties 3 1 0 0 0 0 0 1 1
7.87-6.88 Total 16 14 1 o 1 0 0 0 0
Price undertakings 9 9 0 0 0 0 0 0 0
Definitive duties 7 5 1 0 1 0 0 0 0
7.88 - 6.89 Total 33 8 0 10 5 8 0 2 0
Price undertakings 8 4 0 0 0 4 0 0 0
Definitive duties 25 4 0 10 5 4 0 2 0
7.89 - 12.89 Total 3 o 0 0 1 0 0 0 2
Price undertakings 0 0 0 0 0 0 0 0 0
Definitive duties 3 0 0 0 1 0 0 0 2
Grand total 256 115 34 22 22 10 7 6 40
Price undertakings 164 80 24 7 7 5 7 2 32
Definitive duties 92 35 10 15 15 5 0 4 8
[image:32.839.57.812.51.573.2]C/RM/S/lOB
Page 28
Table IV.10
Notifications of new technical regulations and certification systems under the
GATT Code on Technical Barriers to Trade by the European Communities and
individual members States, 1980-89
(Number)
Notifying party
1980-84
1985-89
European Communities
56
44
Member States (12)
157
176
Belgium
1
32
Denmark
7
54
France
34
15
Germany
14
17
Greece
0
0
Ireland
11
5
Italy
3
1
Luxembourg
0
0
Netherlands
17
8
Portugal
0
0
Spain
30
25
United Kingdom
40
19
C/RM/S/IOB
Page 29
Table IV.ll
Public sector purchasing/procurement in EC member States, 1987
(Billion ECU and per cent)
Procurement value
(Billion ECU)
Share of GDP
(per cent)
Germany
183.8
19.0
France
108.1
14.1
United Kingdom
106.3
17.9
Italy
89.5
13.7
Spain
29.6
11.8
Netherlands
24.5
13.3
Belgium
17.9
14.5
Denmark
16.6
18.9
Greece
7.0
18.0
Ireland
3.8
14.7
Portugal
3.4
10.7
Luxembourg
0.8
15.5
C/RM/S/10B
Page 30
Table IV.12
Public sector import penetration in five EC member States, 1985
(Per cent)
National import
penetration
*
Apparent
import
penetration in
public segtor
purchases *
Share of contracts
with foreign
suppliers in total
value of procurement
contracts
Belgium
A3
21
2.6
France
20
16
1.6
Germany
22
12
3.8
United Kingdom
22
A
0. A
Italy
19
1
0.3
a
Imports as a percentage of national production plus imports,
b
Share of purchases reported to be of foreign origin in total
purchases.
c
Total includes purchases or contracts of unreported origin.
Table IV. 13
State aid In the European Cownities by aeaber State (EC12). average 1981-86 and 1986-88 (Billion ECU and per cent)
B DK F D GR IRL I L HL P E UK EC12
National State aid
- Billion ECU (1986-88) 3.9 0.9 15.3 23.9 1.3 0.7 20.6 0.2 2.4 0.7 5.9 6.6 82.3
(1981-86) 4.4 1.0 19.1 20.5 1.6 1.0 24.2 0.3 2.3 - - 10.8 85.2
Community intervention*
- Billion ECU (1986-88) Ö.9 1.2 6.7 4.8 1.9 1.5 5.2 0 3.1 0.7 1.8 3.1 24.1
(1981-86) 0.9 1.0 5.1 3.5 2.0 1.3 5.0 0 1.9 - - 3.0 23.7
Total aid
- Per cent of GOP (1986-88) 3.2 1.0 2.0 2.5 3.1 2.7 3.1 4.1 1.3 2.3 2.3 1.1 2.2
(1981-86) 4.1 1.3 2.7 2.5 2.5 4.0 4.0 6.0 1.5 - - 1.8 2.8
a The figures include State aid to agriculture and fisheries, manufacturing industry and railways.
b Excluding R & D aid and ECSC aid. The combined value of these categories was ECU 7.7 billion (average 1986-88) and ECU 1.4 billion (1981-86).
Source: EC Commission (1990), Second Survey on State Aids in the European Community.
C/RM/S/10B
Table IV.14
State aid to nanufacturing industry and to agriculture in the European CoMMinities by neaber State
(Per cent)
B DK F D GRa IRL I L NL P E UK EC 12
Aid to industry
(as per cent of gross value added)
Total manufacturing (1986-88) 4.4 2.0 3.7 2.7 15.5 6.1 6.7 2.3 3.3 8.3 5.3 2.7 4.0
(1981-86) 6.4 2.8 4.9 3.0 12.9 7.9 9.5 7.3 4.1 - - 3.8 4.8
Steel (1981-85) 40.4 18.0 58.3 8.6 ••• 107.2 103.0 14.6 4.3 - - 57.6
. . .
Shipbuilding (1986-88)a 12.3 7.8 68.0 16.6 0 0 28.2 0 3.8 17.5 25.0
(1981-86) 27.7 33.8 56.6 12.3
. . .
. . .
45.9 0 10.7 - - 21.6 •••Direct aid to agricultural producers
(1986-88)
. . .
2.7 6.5 20.8 10.0 10.8 10.4 8.7 1.7 6.4 2.4 10.7. . .
(1981-86) 3.6 4.8 10.0 7.0 9.0 8.3 8.5 1.9 2.7 2.0 8.5
. . .
a Estimates.
Not available. Not applicable.
Source: See Table
Zt
sSs'a
State aid (subsidies) in EC aeaber States by sector and function, average 1986-88 (Per cent and billion ECU)
Table IV.15
B DK F 0 GR IRL I L NL P E UK
Agriculture/Fisheries 4 27 11 10
Per cent
li 24 16 8 23 22 4 12
Industry/Services
Horizontal objectives 19 22 17 11 33 27 15 7 35 41 6 19
Innovation T 12 3 5 5 3 T 1 To 1 3 5
Trade/export 3 5 9 1 25 21 3 0 1 1 0 5
Others 14 5 5 6 3 3 24 6 24 39 3 9
Particular sectors 69 49 65 60 24 26 45 76 35 35 88 52
Coal 31 “Ô 16 3Î 0 0 0 0 "ÏÏ T IF 17
(current production) (7) (0) (3) (17) (0) (0) (0) (0) (0) (0) (7) (9)
Steel 0 0 0 0 0 0 2 0 0 3 15 0
Shipbuilding 1 6 3 1 0 0 1 0 1 3 2 7
Transport 37 42 32 28 8 18 38 76 32 15 31 17
Others 2 0 14 1 16 8 5 0 2 14 25 11
Regional aid 6 2 3 li li
22
Ü 9I
1 111
Total 100 100 100 100 100 100 100 100 100 100 100 100
Source: GATT Secretariat (based on EC Commission, Second Survey on State Aids in the European Community).
C/RM/S/10B
C/RM/S/10B
Page 34
Abbreviations used in Tables in Chapter V
EC member States Third countries Technical terms
B Belgium
DK Denmark
F France
D Germany
GR Greece
IRL Ireland
I Italy
L Luxembourg
NL Netherlands
P Portugal
E Spa i n
UK United Kingdom
JAP « Japan
KOR - Rep. of Korea
TWN - Taiwan
AD - Anti-dumping measures
Table V.l
Trade Measures applying in the EC fay sector, 1988
Tariff Study category Value of imports, 1988 Average tariffs Tariff range Measures affecting trade and production
Total M.F.N. Simple Weighted
US$ thousand Per cent
01.00 Raw hides and skins, leather and furskins 5,595,791 2,089,485 3.1 2.5 0-10.0 Import prohibitions for wildlife
protection
01.01 Raw hides and furskins 1,972,102 1,064,087 0 0 0
01.02 Semi-manufactured products 1,896,178 415,309 3.7 2.2 0-7.0
01.03 Manufactured articles 1,727,511 610,089 6.9 7.1 3.8-10.0
02.00 Rubber 4,037,218 1,659,209 3.1 4.0 0-10.0
02.01 Raw rubber 1,649,584 439,430 0.2 0 0-3.8
02.02 Semi-manufactured products 374,762 160,871 3.6 4.2 0-6.2
02.03 Manufactured articles 2,012,872 1,058,908 4.5 5.6 0-10.0 AD (undertakings), bilateral quota (1/JAP),
other bilateral restrictions (IRL/JAP et.al.), NAL (E), NAL (P/JAP)
Table V.l (cont'd)
Tariff Study category Value of imports, 1988
Total M.F.N.
1988 1988
Average tariffs Simple Weighted
US$ thousand
Tariff range Measures affecting trade and production
Per cent
03.00 Wood and cork 11,135,331 3,478,856 4.4 2.0 0-10.0
03.01 Wood and cork in the rough 1,214,905 349,640 0.3 0 0-3.2 Phytosanitary regulations
03.02 Wood based panels 1,697,240 411,035 10.0 10.0 10.0
03.03 Semi-manufactured products 7,334,604 2,581,807 4.2 0.6 0-10.0 Technical trade barriers,
health and safety regulations
03.04 Manufactured articles 888,582 246,374 5.6 5.3 2.5-10.0 Technical trade barriers,
health and safety regulations
04.00 PuId. paper and paperboard 20,698,047 5,291,851 7.4 2.7 0-12.5
04.01 Paper pulp and paper waste 6,130,954 2,981,836 0 0 0
04.02 Paper and paperboard 11,451,480 1,248,259 8.4 8.1 2.5-11.0 Minimum import prices
04.03 Printed matter 1,584,670 762,911 3.1 1.3 0-7.2
04.04 Manufactured articles 1,530,943 298,845 9.7 10.0 0*-12.5 Global quota (E), AD (undertakings)
Parts for use in civil aircraft (cont'd)
C/RM/S/10B
Table V.l (cont'd)
Tariff Study category Value of imports, 1988
Total M.F.N.
US$ thousand
Average tariffs Simple Weighted
Per
Tariff range
cent
Measures affecting trade and production
05.00 Textiles and clothina 31,031,983 8,025,925 10.1 7.6 0-17.0 MFA agreements, autonomous quotas,
autolimitations (Mediterranean countries, Japan), survei1lance
05.01 Textile fibres and waste 5,412,789 2,873,800 3.0 0.6 0-10.0
05.01.01 Wool 2,557,353 1,955,402 0.7 0.1 0-2.5
05.01.02 Cotton 1,737,070 637,720 0.2 0 0-1.4
05.01.03 Synthetic and artificial fibres 719,121 220,241 7.7 7.5 7-10.0 3 AD (duties)
05.01.04 Jute and other textile bast fibres 15,276 639 0 0 0
05.01.05 Other vegetable textile fibres 31,927 543 0 0 0
05.01.06 Others 352,042 59,255 0.5 0.7 0-5.3
05.02 Yarns 2,851,148 527,322 7.0 8.2 2.9-9.5
05.02.01 Wool 136,202 4,756 4.7 4.4 3.2-6.5
05.02.02 Cotton 1,067,325 39,677 6.0 6.1 4-9.0
05.02.03 Synthetic and artificial fibres 1,455,391 447,031 8.7 8.7 3.8-9.5
05.02.04 Jute and other textile bast fibres 65,186 167 5.3 5.3 5.3
(cont'd)
C/RM/S/10B
[image:42.837.39.800.35.569.2]Table V.l (cont'd)
Tariff Study category Value of imports, 1988 Average tariffs Tariff range Measures affecting trade and production
Total M.F.N. Simple Weighted
US$ thousand Per cent
05.02.05 Other vegetable textile fibres 39,302 2,969 4.3 4.3 3-5.9
05.02.06 Others 87,742 32,722 5.1 4.1 2.9-9.0
05.03 Fabrics and similar products 4,416,408 1,499,386 10.9 10.8 3-17.0
05.03.01 Wool 132,230 21,573 14.6 13.7 5.3-17.0
05.03.02 Cotton 2,421,870 867,441 10.2 10.6 10.0
05.03.03 Synthetic and artificial fibres 1,012,585 370,142 11.0 11.0 11.0
05.03.04 Jute and other textile bast fibres 51,351 55 8.8 9.0 8.6-9.3
05.03.05 Other vegetable textile fibres 45,414 19,101 13.3 13.8 5.8-14.0
05.03.06 Others (including pile, chenilles, coated, impregnated and knitted fabrics of all fibres)
752,958 221,074 10.9 10.8 3-15.0
05.04 Made-up articles and related products 3,534,824 687,506 9.6 8.7 3.2-14.0 2 AD (undertakings, provisional duties)
05.05 Clothing and clothing accessories 14,816,814 2,437,911 13.0 13.2 0-14.0
(cont'd)
C/RM/S/10B
Table V.l (cont'd)
Tariff Study category Value of imports, 1988 Average tariffs Tariff range Measures affecting trade and production
Total M.F.N. Simple Weighted
US$ thousand Per cent
06.00 Mineral Droducts and fertilizers 7,349,886 2,857,216 5.2 4.6 0-13.5
06.01 Stone, sand and gravel 495,870 111,673 0.4 0 0-3.5
06.02 Fertilizers 705,039 166,517 0 0 0
06.03 Other crude minerals 1,429,152 723,527 1.0 0.2 0-4.1
06.04 Manufactured fertilizers 1,540,620 496,138 5.3 5.1 0-11.0 A0 (duties/undertakings),
global quota (GR). HAL (E)
06.05 Other mineral manufactures except glass 1,766,097 732,822 4.9 6.4 0-13.5 Bilateral quotas (F/JAP et.al.;GR;P/JAP),
othèr restrictions (DK/TWN),
voluntary export restraints (JAP/UK). HAL (E)
06.06 Glass and glassware 1,413,108 626,539 8.4 9.2 0-12.5
06.06.01 Flat glass and manufactures 502,676 193.479 7.6 9.7 0*-6.5 AD (duty/undertakings)
06.06.02 Other glass manufactures 910,432 433.060 8.8 9.0 0-12.5
07.00 Precious stones and oreclous metals 12.253,881 3,293,296 2.6 0.6 0-8.5
07.01 Precious stones, pearls 8,263,015 1,772,380 0.6 0 0-3.2
07.02 Unworked or semi-manufactured precious metals
2.490,071 1,013,024 1.5 0.1 0-4.6
07.03 Articles of precious stones and precious
metals
1,500,795 507,892 4.5 3.7 0-8.5 Global quota (E)
[image:44.840.60.816.32.577.2]Tafele O (u.wt^)
Tariff Study category Value of imports, 1988
Total H.F.N.
Average tariffs Simple Weighted
Tariff range Measures affecting trade and production
US$ thousand Per cent
OSJifi Ores and metals 35,899,561 11,755,566 5.1 2.6 0-17.0
08.01 Ores and metal waste 8,090,664 3,714,243 0 0 0 AD (provisional duty)
08,02 !rf»n *nd steel 8,493,100 1,904,280 5.4 5.5 0-10.0 Voluntary restraint arrangements,
autonomous quotas of member States, EC export restraints (USA)
08.0?. <01 Uriworked 675,569 243,393 3.5 2.9 0-6.0 Bilateral quota (I/JAP), NAL (E/JAP)
08
(12,0?,
Ferro--a 1 toys 1,717,586 399,564 4.9 6.8 0-8.0 4 AD (duty/undertakings),bilateral quota (F), NAL (E)
08*02-03 Serai-manufactured products 6,099,945 1,261,323 5.6 5.5 0*-10.0 5 AD (duty/undertakings)
08.03 Mon-ferrous metals 12,741,860 3,592,828 5.2 1.4 0-10.0 Bilateral quotas (1/JAP;P/JAP),NAL (E/JAP)
08,03 01 Onwought metals 9,608,962 2,864,383 1.2 0.3 0-6.0
.08; O'L.OLOi topper 3,953,668 1,150,315 0 0 0
08o03.0l.02 Nickel - 1,708,861 1,312,834 0 0 0
0^ ^ ’LJ? AluminiM 3,240,007 169,538 3.5 3.4 0-6.0
m,mMM
lead 283,727 206,925 2.0 0.5 0-3.52!tfe 181,279 15,159 2.9 3.2 0-3.5
Pc:r: ürç n? ! 1 aircraft (cont'd)
C/EM/S/10B
Table V.l (cont'd)
Tariff Study category Value of imports, 1988
Total M.F.N.
Average tariffs Simple Weighted
Tariff range Measures affecting trade and production
US$ thousand Per cent
08.03.01.07 Tin 241,420 9,612 0 0 0
08.03.02 Non-ferrous metal products 3,132,898 728,445 6.2 5.9 0-10.0
08.03.02.01 Copper 759,762 152,232 6.0 6.1 1.4-6.5
08.03.02.02 Nickel 111,706 84,813 4.2 3.8 0.5-5.3
08.03.02.03 Aluminium 1,544,628 134,066 8.6 8.6 0-10.0
08.03.02.04 Lead 4,269 832 7.0 7.2 2.2-9.0
08.03.02.05 Zinc 30,279 6,679 7.0 7.9 4.4-8.0
08.03.02.06 Tin 3,475 1,200 3.4 3.4 2.5-4.5
08.03.02.07 Other (unworked or semi-manufactured) 678,779 348,623 5.2 5.3 0-10.0
08.04 Metal manufactures 6,573,937 2,544,215 5.4 6.0 0-17.0
08.04.01 Tools 1,752,739 703,534 4.8 4.7 3.8-6.2 Global quota (E)
08.04.02 Cutlery 369,529 215,287 9.7 13.4 4.9-17.0 Industry-to-industry arrangements
(B.NL.L). global quota (F). NAL (E) export restrictions (JAP/EC)
08.04.03 Household equipment 401,777 157,480 5.2 5.6 0-7.0 Global quota (E)
08.04.04 Metal containers, etc. 08.04.05 Others
299,766 3,750,126
85,424 1.382,490
5.3 5.2
5.9 5.5
3.9-7.0
0-9.0 2 AD (undertakings), global quota (E)
(cont’d)
C/RM/S/10B
[image:46.841.38.805.25.575.2]Table V.1 (cont'd)
Tariff Study category Value of imports, 1988 Average tariffs Tariff range Measures affecting trade and production
Total M.F.N. Simple Weighted
US$ thousand Per cent
09.00 Coal ami natural aas (excludes 09.03)
13,105,656 5,454,369 2.2 4.0 0-16.0 State trading
09.01 Coal, coke and agglomerates 4,634,625 3,945,454 3.3 5.4 0-5.0 Article XIX (D), subsidies, other NTBs,
national tariffs (specific)
09.02 Gas 7,414,133 771,458 1.5 0.1 0-16.0
09.04 Products derived from coal, or gas
1,056,898 737,457 2.2 0.7 0-7.0
10.00 Chemicals 29,646,044 11,627,589 7.3 6.7 0-17.6 Environment-related regulations
10.01 Chemical elements and compounds 11,703,424 4,985,991 7.3 5.3 0-17.6 18 AD (duty/undertakings), trade controls
10.01.01 Organic chemicals 7,424,531 3,058,798 8.0 7.3 0-17.6
10.01.02 Chemical elements, inorganic acids, oxides and halogens
1,541,410 423,571 6.0 4.6 0-13.4 Bilateral quota (F/JAP), NAL (E)
10.01.03 Other inorganic products 2.737,483 1,503,622 6.4 1.5 0-14.0 Global quota (F)
10.02 Dyeing, tanning and colouring materials 1,580,198 447,156 7.1 7.6 0-10.0
10.02.01 Tanning materials 55,306 14,967 4.4 3.1 0-9.0
10.02.02 Colouring materials 1,030,255 252.397 7.3 8.3 0-10.0
Table V. 1 (cont'd)
Tariff Stucjy category Value of imports, 1988
Total M.F.N.
Average tariffs Simple Weighted
Tariff range Measures affecting trade and production
US$ thousand Per cent
10.02.03 Paints, varnishes, etc. 494,637 179,792 7.6 7.0 3.7-10.0
10.03 Medical and pharmaceutical products 4,222,095 1,332,841 6.0 5.3 0-13.6 Trade controls and prohibitions
10.04 Plastics 7,778,322 3,056,171 9.3 9.9 0*-16.0
10.04.01 Plastic materials 5,762,626 2,242,435 9.5 10.5 0*-16.0 Global quota (E)
10.04.02 Articles thereof 2,015,696 813,736 8.0 8.2 0*-8.6 Global quota (E)
10.5 Essential oils, perfume materials, preparations, soaps
1,282,950 432,100 5.6 5.3 0-11.0
10.05.01 Essential oils, perfume mats 494,110 128,233 4.5 2.5 0-11.0 Bilateral quota (I)
10.05.02 Perfumery, cosmetics, soaps, cleaning preparations, etc.
788,840 303,867 6.5 6.5 5.3-6.9 Global quota (E),
bilateral quota (F/JAP et.al.)
10.06 Other chemicals 3,079,055 1,373,330 6.1 6.5 0-12.0
10.06.01 Semi-manufactured products 2,274,688 1,123,141 5.7 6.5 0-7.6 Variable elements
10.06.02 Finished products 804,367 250,189 7.2 6.7 4.6-12.0 Global quota (E)
[image:48.836.35.802.51.570.2]Table V.l (cont'd)
Tariff Study category Value of imports, 1988 Average tariffs Tariff range Measures affecting trade and production
Total M.F.N. Simple Weighted
US$ thousand Per cent
11.00 Non-electric machinery 48,477,982 30,660,314 4.1 4.4 0*-12.0
11.01 Power-generating machinery 6.367,637 3,678,045 4.5 2.6 0*-10.0 2 AD (duty and undertak ings),
restrictive public procurement
11.02 Agricultural machinery 809,560 527,906 3.6 3.5 3.5-4.1 Global quota (E)
11.03 Office machines 19,004,383 16,044,904 4.6 4.7 0*-12.0 3 AD (duty/undertakings), surveillance (JAP)
11.04 Metalworking machinery 2,134,158 1,192,206 4.3 4.6 2.2-5.3 Global quota (E),
export monitoring/moderation (Japan) administrative barriers (F/JAP)
11.05 Textile and leather machinery 2,129,022 836,200 4.2 4.3 3.2-5.8 Global quotas (E), bilateral quota (I/JAP),
NAL (P/JAP)
11.06 Construction, mining and handling equipment
3,258,256 1,586,828 4.1 5.2 0-6.5 Global quota (E), AD (duty),
export monitoring/moderation (JAP), industry-to-industry arrangements (UK)
11.07 Other machine tools 1,532.920 681,444 3.8 3.4 2.9-5.8 Global quota (E)
11.08 Pumps 2*317,394 1,156,074 3.3 4.2 0*-5.3
11.09 Heating and cooling equipment 1,404,919 640,132 3.7 4.3 0*-5.6 AD (undertakings)
11.10 Pulp and paper machinery 694,934 167,351 3.9 3.8 3.8-4.1
[image:49.838.18.820.46.576.2]Table V.l (cont'd)
Tariff Study category Value of imports, 1988 Average tariffs Tariff range Measures affecting trade and production
Total M.F.N. Simple Weighted
US$ thousand Per cent
11.11 Bookbinding and printing machinery 1,341,167 678,587 3.4 3.2 2.2-4.5
11.12 Other machines 4,593,375 2,032,871 4.0 4.1 0*-6.2 AO (duty and undertakings)
11.13 Parts and accessories 2,890,257 1,437,766 4.7 5.8 0 * 1 o NAL (I/JAP), NAL (E), 3 AD (duty)
12.00 Electrical machines and apparatus 31,198,722 18,739,225 5.8 8.3 0*-15.0
12.01 Electrical machinery for industry 7,409,233 3,825,042 4.3 5.4 0*-8.5 Global quotas (E,P), bilateral quotas (F),
NAL (E,P/JAP), AD (duties/undertakings)
12.02 Telecomnunicat ions apparatus 11,852,027 7,611,422 7.2 8.8 0*-14.0 Export monitoring (JAP),
global quotas (F,1,P),
bilateral quotas (E/JAP et.al.), NAL (E), buy-national tendencies in public procurement
12.03 Tools and other electrical apparatus 3,198,025 1,570,502 4.4 4.9 o» t CT> O Export monitoring/moderation (JAP,K0R?)
12.04 Electrical equipment and parts 8,739,437 5,732,259 7.2 10.6 °* 1 cr> o Global quotas (E),
bilateral quotas (I.F/JAP et.al.),
NAL (E,P/JAP), other restrictions (DK/TWN), 3 AD (duty and undertakings),
voluntary restraints?
[image:50.841.20.802.45.576.2]Table V.l (cont'd)
Tariff Study category Value of imports, 1988
Total M.F.N.
US$ thousand
Average tariffs Simple Weighted
Tariff range Measures affecting trade and production
Per cent
13.00 Transport equipment
13.01 Motor vehicles
13.02 Aircraft
13.03 Ships and boats
13.04 Other transport equipment
28,304.592 16,879,233 7.0
18,398,989 12,639,203 9.5
7,756,446
1,526,953
622,204
3,128.342 3.7
901,725 1.8
209,963 5.3 7.3 9.4 0.5 0.5 10.0
0-22.0
4.4-22.0
0-15.0
0-4.9
3.8-17.0
Voluntary restraints, global quotas (I,E), bilateral quotas (P/JAP et. al.),
administrative barriers (F),
industry-to-industry arrangements (UK), technical trade barriers,
environment-related regulations
Proh ib it ions (F), subs id ies
Global quota (F), NAL (E), subsidies
14.00 Professional, scientific and controlling 14,381,847 instruments, photographic apparatus.
clocks and watches
14.01 Photographic and optical apparatus 4,355,906
14.02 Professional, scientific and controlling instruments
14.03 Watches and clocks 2,190,317
9,389,836 5.4
3,514,739 6.7
7,835,624 5,379,033 4.9
496,064 5.4
6.5
7.1
6.1
6.7
0*-1 1 . 0
0*-10.0
0* -11.0
0*-7.5
Bilateral quotas (F/JAP et. al.), NAL (E), AD (duty and undertakings), quotas (I)
Bilateral quotas (F/JAP et. al.), NAL (E), NAL (P/JAP)
Global quotas (F), NAL (E/JAP), NAL (P), AD (duty)