This is a repository copy of CFD modelling of a pilot-scale counter-current spray drying tower for the manufacture of detergent powder.
White Rose Research Online URL for this paper: http://eprints.whiterose.ac.uk/99393/
Version: Accepted Version
Article:
Ali, M, Mahmud, T, Heggs, PJ orcid.org/0000-0003-3209-6521 et al. (4 more authors) (2017) CFD modelling of a pilot-scale counter-current spray drying tower for the manufacture of detergent powder. Drying Technology, 35 (3). pp. 281-299. ISSN 0737-3937
https://doi.org/10.1080/07373937.2016.1163576
© 2017 Taylor & Francis. This is an Accepted Manuscript of an article published by Taylor & Francis in Drying Technology on 30 March 2016, available online:
http://www.tandfonline.com/10.1080/07373937.2016.1163576. Uploaded in accordance with the publisher's self-archiving policy.
[email protected] https://eprints.whiterose.ac.uk/ Reuse
Unless indicated otherwise, fulltext items are protected by copyright with all rights reserved. The copyright exception in section 29 of the Copyright, Designs and Patents Act 1988 allows the making of a single copy solely for the purpose of non-commercial research or private study within the limits of fair dealing. The publisher or other rights-holder may allow further reproduction and re-use of this version - refer to the White Rose Research Online record for this item. Where records identify the publisher as the copyright holder, users can verify any specific terms of use on the publisher’s website.
Takedown
If you consider content in White Rose Research Online to be in breach of UK law, please notify us by
Accepted for Publication inDrying Technology, DOI:10.1080/07373937.2016.1163576, 30 March 2016
CFD Modelling of a Pilot-Scale Counter-Current Spray Drying Tower for the
Manufacture of Detergent Powder
Muzammil Ali*, Tariq Mahmud+, Peter John Heggs, Mojtaba Ghadiri and Andrew Bayly, Institute of Particle Science and Engineering, School of Chemical and Process Engineering,
The University of Leeds, Leeds LS2 9JT, UK and
Hossein Ahmadian and Luis Martin de Juan
P&G Technical Centres Ltd., Whitley Road, Longbenton, Newcastle Upon Tyne NE12 9BZ, UK
Keywords: spray drying kinetics, counter-current spray drying, multiphase CFD modelling, heat and mass transfer
* First author
+ Corresponding author; email:[email protected]; Tel:
+
44 113 34 32431Abstract
1. Introduction 1.1 Background
Spray drying of atomised solutions or slurries is one of the oldest and the most commonly used unit operations for the production of a range of particulate products in the chemical, food, household and personal care products and pharmaceutical industries[2]. The process involves spraying of a solution or slurry using a single or multiple atomizers into a hot gas, which is typically hot air, flowing through a tower. The contact between the droplets/particles and the hot gas is either co-current or counter-current. The co-current spray drying towers are suitable for drying of heat sensitive materials such as food and pharmaceutical products. The hot gas comes in contact with the droplets at the top of the tower where the droplets have a maximum amount of moisture and are at the wet bulb temperature. The gas loses most of the heat in the top region of the tower in vapourising the moisture from the droplets. The counter-current spray drying towers are used for thermally stable products, for example detergents and ceramics, as the dry particles come in contact with the hot gas just before exiting tower. These towers are thermally more efficient than the co-current towers because of better heat utilisation due to a higher temperature difference between the two phases through most of the tower height.
Despite being a prevalent drying technology, the design of spray drying towers and the drying process development, optimisation and scale up rely heavily on the past experience of the designer, the operator and the experimental data from the laboratory- and pilot-scale dryers[2-7]. Experimental trials and data analysis, particularly in pilot plants, are difficult, expensive and time consuming. Thus it is not possible to study experimentally the effect of major design modifications in the tower for optimum performance or scale up of the drying process. Mathematical modelling of spray drying towers can reduce the process development, design and optimisation time and costs. The modelling of spray drying towers is very challenging because of the complexity associated with the integration of the droplets/particles drying process with the fluid dynamics of drying gas accounting for the heat, mass and momentum transfer between the two phases. This is further exacerbated due to the interactions between the polydispersed droplets/particles, which results in droplet coalescence, particle agglomeration and breakage, and the droplets/particles and wall interaction resulting in the deposition on the wall. Due to the complexity of these interacting processes, the multiphase computational fluid dynamics (CFD) is deemed as an appropriate approach for the modelling of spray drying towers.
Particle-Source-in-Cell method of Crowe[28]was used. A review of these studies carried out until 2010 can be found in [29]. In contrast, comprehensive CFD modeling studies of spray drying in counter-current towers, which is the subject of this paper, are scarce despite many industrial applications[8,30-34]. It is a poorly understood process compared with that in co-current towers[35]. According to Zbicinski and Piatkowski[35], complex aerodynamics resulting from a strongly swirling turbulent gas flow and associated droplet/particle trajectories, intensive coalescence/agglomeration, scarcity of experimental spray towers and difficulty in gathering reliable data for model validation are the major factors responsible for lesser modelling as well as experimental research work on counter-current spray drying towers.
1.2 Previous CFD studies
Crowe[30] carried out steady-state, two-dimensional modeling of slurry droplets drying in a counter-current spray tower (4 m in height and 1 m in diameter) with drying kinetics obtained from a characteristic drying curve (CDC) model. The turbulent gas flow was modelled using the
Wawrzyniak et al.[32] developed a novel approach for the three-dimensional, steady-state CFD modelling of heat and mass transfer in an industrial counter-current spray drying tower having a height of 37 m and a diameter of 6 m, used for detergent powder manufacture. Turbulence was modelled usingk- model. The modelling approach was based on a negative heat source term in the gas phase energy transport equation which reflects the energy necessary for the evaporation of moisture from the droplets and particles. This approach required estimation of the total energy consumption of the drying process and the determination of a power density distribution function in the dryer. The drying kinetics of the discrete phase was not included in the CFD model. The source term in the energy transport equation was obtained from the heat and mass balances using the measured temperature data at different locations within the tower. It should be noted that an accurate measurement of gas temperature in the spray drying tower posed difficulties due to the presence of droplets and wet particles, which can stick to the thermocouples, as well as the highly transient nature of the gas flow.
A comprehensive three-dimensional, steady-state CFD modelling of an industrial counter-current spray tower having a height of 37 m and a diameter of 6 m for detergent manufacture was carried out by Wawrzyniaket al.[33]. The RST model was used for the modelling of gas phase turbulence. The droplet drying kinetics was modeled using a CDC approach. To take into account the variation of particle size distribution due to agglomeration, a transition function was applied to the measured initial droplet size distribution to match the predicted size distribution of dried powder with the measurement. A good agreement between the modelling results and the measured gas temperature, humidity and velocity was obtained despite highly transient nature of the flow in the tower.
Previous CFD modelling studies of counter-current spray drying towers cited above have shown the potential of the Eulerian-Lagrangian approach for modelling the complex interacting transport processes inside the spray drying tower. However, there are still many aspects of the spray drying process modelling that require further attention. This includes a comprehensive assessment of turbulence models for accurate simulations of swirling gas flow profiles, modelling the solution/slurry drying process using a validated single-droplet drying model instead of a simplified CDC approach, particle-wall and particle-particle interactions. The effect of the initial spray conditions, e.g. droplet injection velocity and size distribution, on the predicted final dried powder properties, such as average moisture content, average powder temperature and bulk density, have not been investigated in the earlier studies.
1.3 Scope of the study
In this study, steady-state, three-dimensional CFD modelling of an industrial counter-current pilot-plant spray drying tower is carried out. The tower is used for the process development for manufacture of detergent powders at the Procter and Gamble (P&G) Technical Centres, Newcastle Upon Tyne, UK. The multiphase CFD model is based on the Eulerian-Lagrangian approach. The continuous phase turbulence is modelled using the RST model which was validated using measurements in strongly swirling flow in the same tower[37]. The roughness of the tower wall caused by the deposition of materials is taken into account through modifying the wall functions. The drying kinetics is modeled using a detail slurry-droplet drying model[1], which is coupled with the CFD code via the User-Defined Function (UDF). Heat loss from the tower wall was simulated using a heat transfer model integrated with the CFD via an UDF. This paper particularly focuses on studying the influence of the restitution coefficient used in the modelling of the particle-wall interaction on the predicted particle trajectories, considering the rebound scenario. The model predictions are validated using experimental data including dried powder average moisture content, average powder temperature and exhaust gas temperature collected from the pilot-plant spray drying tower at P&G.
2. Experimental Setup 2.1 Spray drying process
of the tower.
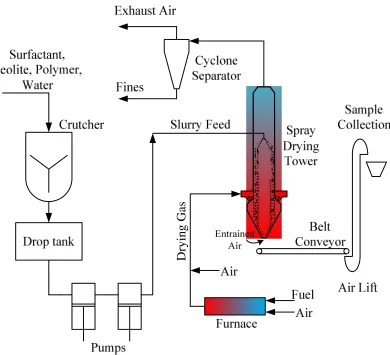
The process flow diagram of the spray drying process is depicted in Figure 1. The tower has a single centrally located pressure-swirl hollow-cone nozzle. The slurry can also be sprayed using multiple nozzles at various heights. However, experiments carried out using a single nozzle were simulated in this study. The drying air is heated in a direct fired furnace using natural gas. The resulting hot gas - a mixture of air and flue gas - flows into the distribution ring to which a number of tangential nozzles are attached which supply the gas to the tower and impart swirl to the flow. The temperature of the hot gas is measured at the inlet of the distribution ring using a k-type
thermocouple. Some cold air is entrained from the bottom of the tower due to the tower operating at 300 Pa below atmospheric pressure. The exhaust gas leaving the tower from the top exit contains water vapours and entrained fine particles. The exhaust gas temperature is also measured using ak-typethermocouple in the exhaust gas duct (not shown in Figure 1) at a location about 3 m away from the tower exit. The spray drying tower and the associated piping/ducts are insulated using fibre glass.
D
ry
in
g
G
a
[image:8.595.88.478.61.416.2]s
Figure – 1: Process Flow diagram of the pilot-plant set up at the P&G Technical Centres, Newcastle Upon-Tyne.
Exhaust gas
D
Gas inlets
Gas inlets
Entrained air
Z
D
z=0
z/Z=1
x-z
Plane
[image:9.595.152.469.59.486.2]y-z
Plane
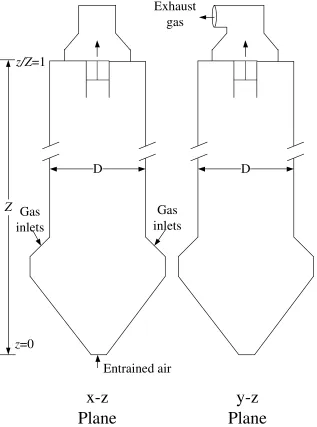
Figure – 2: Schematic of the spray drying tower.
3. Integrated Multiphase CFD-Drying Process Model
3.1 CFD model
Continuous phase equations
The continuous phase comprises the hot gas, which is treated using the Eulerian approach. The flow is calculated using the Reynolds-averaged continuity and Navier-Stokes equations. The continuity equation is given by:
m i i
S u
x
)
( (1)
F u u x x P x u x u x u u
x i j i i j
j j i i j i i ) ( ) ( _____ ' ' (2)
where is the source term arising from the exchange of momentum between the droplets/particles and gas. As the gas flow in the spray drying tower is turbulent and swirling, it is necessary to use a turbulence model that is capable of reproducing the correct flow profiles. In a supplementary study[37], the predicted distributions of the mean velocity components and turbulence intensity in single phase, isothermal swirling flow in this tower obtained using the eddy-viscosity and RST models were compared with measurements. The latter model provided the best agreement with data and hence it was used in this study. The general form of the Reynolds stress transport equations is given as:
n Dissipatio strain Pressure Diffusion Production Stress transport Convective _____ ' ' )
( k i j ij Tij ij ij
i D P u u u
x
(3)
The diffusion term (DTij) is modelled via a gradient-diffusion approximation[38]. The dissipation
tensor term (ij) is assumed to be isotropic and is modelled in terms of the rate of dissipation of turbulent kinetic energy () asij= ij. The pressure-strain redistribution term ( ij) is modelled
using the linear approximation[39] and includes the wall-reflection term. The following model constants are used:
C =0.09, C1=1.44, C2=1.92, =1.3, C1=1.8, C2=0.60, ' 1
C =0.5, ' 2
C =0.3
The modelling of flow near the wall is carried out using the standard wall functions modified for rough surfaces[40]due to the deposition of materials on the wall causing surface roughness:
B B y
u 1ln
(4)
where (= 0.4) is Von Karman’s constant andBis an additional constant with a value of 5.5[41]. The term B is expressed as[42]:
) 1
ln(
1
B Csks (5)
where ksis the dimensionless sand grain roughness height given by:
u k k s s (6) The roughness height (ks) and the roughness constant (Cs) are specified to be 2 mm and 1.0,
The transport of scalar quantities, including the gas enthalpy and water vapour, is modelled using the Reynolds-averaged scalar transport equations given in a general form by:
J S
x u x i i i ) ( (7)
The variable in equation (7) represents the mass fraction of water vapour and gas enthalpy. S is the source term representing the mass of water vapour added to the gas phase due to the vaporisation of moisture from the droplets/particles in the species transport equation and the rate of heat transfer from the gas to discrete phase in the enthalpy transport equation. J represents the corresponding turbulent mass and energy fluxes which are modelled using a gradient-diffusion approach.
The gas enthalpy is related to the enthalpy of individual components (air and water vapours) using the following equation:
N i i ig Yh
h 1
(8) The gas temperature is related to enthalpy as follows:
g ref g g ref g T T mix p h h T c
h , d
d (9)
Specific heat is considered to be constant with respect to gas temperature as it does not vary significantly within the range of temperatures considered. The density of the drying gas is considered to be a function of temperature and composition and is calculated using ideal gas law, given by: g g N i i i w g T R Y M P
1 , (10)Heat transfer due to thermal radiation is neglected in the simulation as the gas/particle temperature in the spray dryer is low (< 600 K).
Modelling of heat loss from the wall
The heat loss due to conduction through the insulated wall of the tower with a layer of deposited materials on the inner surface is considered. The heat flux through the wall is given by:
) (Tdep Tamb U
q (11)
) ( ln ln ln 1 ins w i amb i ins w i ins w i i w i w i i dep dep i i i r r r r r r r r r r r
U
(12)
The surface temperature of the deposits layer (Tdep) in contact with gas is calculated using the
log-law of the wall for thermal boundary layer[59], which for the deposit layer surface reduces to:
Po p P dep T c U C
T
2 4 / 1 Pr 2 1 (13) whereTPois the temperature of the grid node next to the wall.
Discrete phase equations
The discrete phase consisting of droplets and particles is modelled using the Lagrangian approach. The trajectories of the droplets/particles are calculated by solving the equation of motion for individual droplet/particle, which is given by:
p g p p d p g u u F t u ) ( ) ( d d (14) where is the instantaneous gas velocity, which is sum of the time-average (ui) and fluctuating ( '
i
u ) velocity components. The first term on the right hand side is the drag force per unit mass, the second term represents the gravity and buoyancy force per unit mass. The drag force is given by: 24 Re 18 2 D p p d C d F (15) where Re is the particle Reynolds number defined as:
dpup u
Re (16)
CDin equation (15) is the drag coefficient. The widely used correlation for the drag coefficient
for droplets and particles[58]is used, which is applicable to smooth spherical bodies:
2 3 2 1 Re Re a a a
CD (17)
wherea1,a2anda3are constants with values depending on the particles Reynolds number and is
applicable for Re ranging from 0 to 50000.
computational cell exceeds the eddy crossing time for the particle (the distance traversed by the particle is larger than the eddy length) or the eddy lifetime. The fluctuating gas velocity components are sampled by assuming a Gaussian probability distribution and are given by:
_____ 2 ' '
i
i u
u (18)
where is the normally distributed random number.
It should be noted that in common with most previous studies the droplet/particle-particle interactions leading to coalescence and agglomeration are not considered in the simulation. Reliable methodologies for modelling these highly complex processes are not yet well developed[34]. Although in a few studies[31,34]these processes were modelled using the stochastic approach of Sommerfeld[36], the predicted particle size distribution in this approach is sensitive to the number of parcels used in particle tracking as well as the CFD mesh size.
Modelling of particle-wall interaction
The collision of wet particles with the wall commonly results in deposition on the wall and the deposited particles undergo drying as well as agglomeration before being re-entrained by the hot gas[55]. The period of retention on the wall, size distribution and moisture content of the re-entrained particles is difficult to predict as it depends on many factors including impacting particle moisture, size, existing deposit layer moisture, near-wall velocity and material properties. Particles can also rebound after colliding with the wall with a velocity less than or equal to the impact velocity. In previous CFD modelling studies cited in Section 1.2, only the rebound of particles was modelled using the restitution coefficient (defined as the ratio between the velocity of a particle after and before impact on the wall) with a constant value of typically 1.0.
moisture content, is used. By taking the restitution coefficient of initial droplet to be 0 and the dried particle equal to 0.4, the following linear relationship is obtained:
4 . 0 4
. 0
,
o l
l r
w w
C (19)
3.2 Drying process model
Droplet drying kinetics
A single droplet drying model developed in-house by P&G is used to describe the drying kinetics of the droplets/particles. It is based on the numerical model proposed by Hecht and King[50]. Different stages of drying are depicted in Figure 3. The droplet is allowed to shrink in the first stage (saturated surface drying) due to evaporation of moisture. The particle diameter is fixed in the second stage (diffusion controlled drying stage). The particle is allowed to inflate in the third stage (heat transfer controlled drying) of drying due to internal vapourisation of moisture. The size of the particle in this stage is increased up to the initial droplet diameter. Once the particle is dry, only sensible heat transfer takes place in the fourth stage. This model has been evaluated using a plug-flow model of the same spray drying tower in our earlier study[45], in which the model is described in more detail. The major assumptions in the droplet drying model include:
1. No temperature/concentration gradients exist inside a droplet/particle. The droplets/particles are very small (ranging from 100 µm to 2300 µm), therefore the temperature variation can be neglected (Biot number is small < 0.1).
Figure – 3: Different stages of drying of a slurry droplet[45]
The change in temperature of the droplet/particle is calculated using the following energy balance equation: moisture the zing in vapouri consumed Heat convection by rticle droplet/pa the to input Heat rticle droplet/pa the by absorbed Heat , d d ) ( d d t M h T T A t T c M l fg p g p p drop p
p
(20)
The heat transfer coefficient ( ) in equation (20) is calculated from the Ranz and Marshall[51] correlation. The moisture content in the droplet is calculated using the equation proposed by Hecht and King[50]:
t M M w t w l s l l d d ) 1 ( d
d 2
(21)
The change in droplet radius due to evaporation of liquid in the first stage of drying (see Figure 3) is given by:
2 4 d d d d p l l p r t M t r (22)
The initial slurry droplet drying rate based on surface drying is given by:
) ( 4 d d , , 2
p c vs v
l r k C C
t M
The mass transfer coefficient (kc) in equation (23) is calculated from the Ranz and Marshall[51]
correlation. The transformation from the first stage of drying to the second stage occurs when the solid crust is formed at the surface. The surface drying time can be approximated by considering the diffusion of liquid moisture from the surface of a semi-infinite slab. Using the solution given by Crank[52]for the mass transport equation and assuming that the surface is dry when the surface moisture concentration reaches 90% of the equilibrium moisture content, the following equation for the surface drying time is obtained:
2 5 . 5 c WS sd k K D t (24)
Once the surface is dry (step C in Figure 3), the drying rate becomes dependent on the internal diffusion of moisture to the surface. Hecht[1] developed an algebraic equation for this step by fitting results from a full numerical model for droplet drying rate previously developed by Hecht and King[50]. The drying rate for this stage is given by:
C 10 A exp 10 d d B 6 6 p sd p l r t t r t M (25)
where A, B and C are constants with values of 18.9, 0.2 and 17.7, respectively.
The drying rate in the third stage of drying is dependent on the heat transfer to the particle. An energy balance on the particle yields the following equation for the drying rate:
l boil s l p l s p s fg p g p l w T w c w c w h T T d t M d d ) ( 2 4 d d , , 2 (26)It can be seen from equation (26) that the drying rate is dependent on the boiling point of the slurry which is a function of moisture content. This was determined experimentally and the data was fitted using the exponential relationship given by[45]:
15 . 373 6 . 6 100 68 . 23 25 . 276
exp
l boil w T (27)
Source terms in the scalar transport equations
cell n i in i p in i p i p
m m V
m m S
1 , , , , , (28)The source term appearing in the gas enthalpy transport equation (equation 7) is due to the exchange of heat between the droplets/particles and the gas phase; it is given by the following equation:
cell n
i T
T p pi
in i p
T
T p pi
out i p vap out i p in i p h V dT c m dT c m h m m S in i p ref pi
out i p ref pi
1 , , , , , , , , , , , , , , , , (29)2.3 Numerical solution method
The conservation equations for the continuous and discrete phases were solved using CFD software ANSYS Fluent v.12[42]. The gas phase conservation equations were discretised using the finite-volume discretisation method. The second-order upwind discretisation scheme[41]was used for the convective terms. For the pressure-velocity coupling PISO scheme[56] and for the pressure interpolation, PRESTO! Scheme[41] were used which is recommended for swirling flows[42]. The calculation of heat loss from the tower wall (equations 11-13) was incorporated into the CFD solver code through the UDF.
exchange between the two phases, thus a useful indicator to check convergence of the simulation. The solution was taken to be converged when the variation in exhaust gas temperature was less than 2 K about the mean value. Typical errors in overall mass and energy balances at the end of the simulation run were 0.5 and 1%, respectively. A typical run time for the simulation was 1 week on a quad core processor (2.8 GHz) with 16 Gb ram.
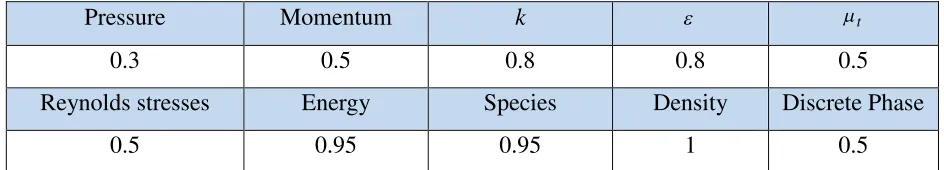
Table – 1: Under-relaxation factors.
Pressure Momentum k t
0.3 0.5 0.8 0.8 0.5
Reynolds stresses Energy Species Density Discrete Phase
0.5 0.95 0.95 1 0.5
3. Application of CFD-Drying Process Model
4.1 CFD model input specifications
The model was applied to simulate one of the trails carried out in the pilot-plant spray drying tower as mentioned in section 2. Simulations were carried out using two values of the coefficient of restitution: Cr= 0.4 (referred to as Case 1) andCr=f(wl) (Case 2). The operating conditions
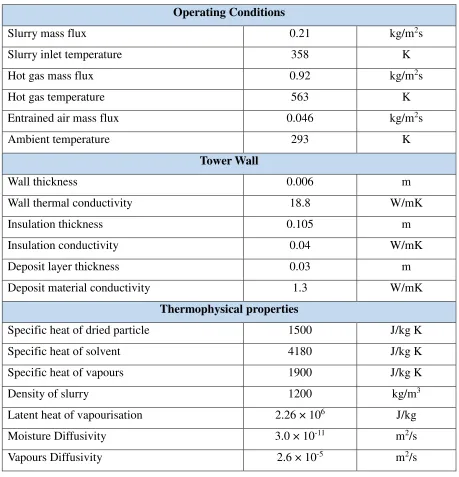
Table – 2: CFD model input specifications. Operating Conditions
Slurry mass flux 0.21 kg/m2s
Slurry inlet temperature 358 K
Hot gas mass flux 0.92 kg/m2s
Hot gas temperature 563 K
Entrained air mass flux 0.046 kg/m2s
Ambient temperature 293 K
Tower Wall
Wall thickness 0.006 m
Wall thermal conductivity 18.8 W/mK
Insulation thickness 0.105 m
Insulation conductivity 0.04 W/mK
Deposit layer thickness 0.03 m
Deposit material conductivity 1.3 W/mK
Thermophysical properties
Specific heat of dried particle 1500 J/kg K
Specific heat of solvent 4180 J/kg K
Specific heat of vapours 1900 J/kg K
Density of slurry 1200 kg/m3
Latent heat of vapourisation 2.26 × 10⁶ J/kg
Moisture Diffusivity 3.0 × 10⁻¹¹ m2/s
Vapours Diffusivity 2.6 × 10⁻⁵ m2/s
The air was heated in a direct fired furnace using natural gas as the fuel. However, in the simulations the hot drying gas, which was a mixture of air and combustion products, is represented as atmospheric air (O2 + N2) and water vapour (due to humidity of the air and that generated via combustion). The presence of CO2due to combustion in the hot gas is neglected since its mass fraction is very small (~ 0.01). The inlet composition of the hot gas specified in the simulation is given in Table 3.
Table – 3: Inlet composition of the hot drying gas.
Species Mass Fraction
H2O 0.0229
[image:19.595.182.421.707.776.2]4.2 Initial droplet injection velocity
The slurry is atomised into small droplets using a pressure-swirl hollow-cone nozzle. The initial velocity of all the injected droplet sizes is taken to be constant and is calculated using the following equation:
2 cos 2
2
o c
p
r r
Q u
(30)
The above equation requires the radius of the air core (rc) and the spray cone angle ( ). The latter
is taken to be 40obased on the vendor provided data. The air core radius is taken from the data reported by Nelson and Stevens[44]for various spray cone angles. The ratio between the air core radius and the radius of the nozzle was found to be 0.22.
4.3 Droplet size distribution
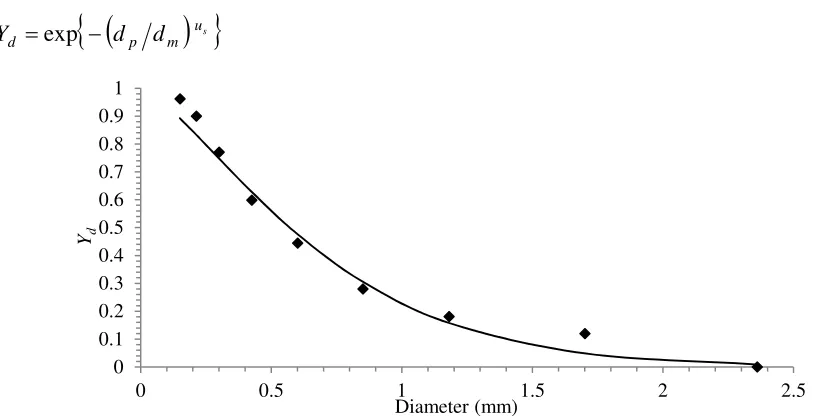
In the absence of measurement of initial droplet sizes, the measured size distribution of dried detergent particles collected from the bottom of the spray tower is used as the initial slurry droplet size distribution in the simulation in line with our previous study[45]. This may be a valid assumption if coalescence and agglomeration occurs in the dense spray region very close to the nozzle, and the resulting size distribution thereafter remains fairly constant. The size range of dried particles collected from the tower is from 100 µm to 2300 µm. The particle size distribution measured on 10 sieves is represented in Figure 4 by discrete points. A Rosin-Rammler distribution[46], given by equation (31), is fitted to the data (continuous line in Figure 4) using a size constant (dm) of 750 µm and distribution parameter (us) of 1.35, which is specified in the
simulation.
us
m p
d d d
[image:20.595.80.490.543.753.2]Y exp (31)
Figure – 4: Dried detergent particle size distribution plot on a cumulative mass basis 0
0.1 0.2 0.3 0.4 0.5 0.6 0.7 0.8 0.9 1
0 0.5 1 1.5 2 2.5
Yd
4.4 Computational Details
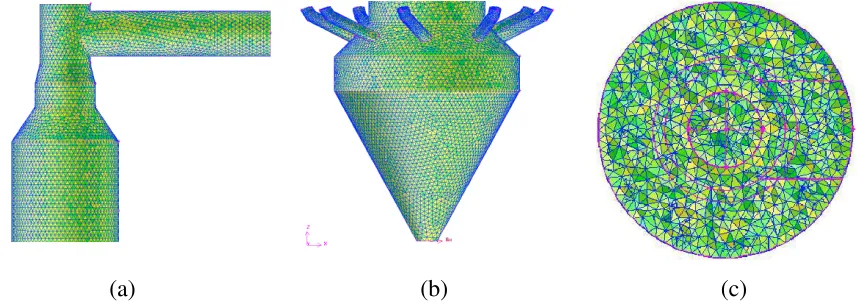
The geometry of the tower and the computational mesh, shown in Figure 5, were created using Gambit[47]. The size of the mesh used for the CFD simulations was selected based on an extensive sensitivity study carried out previously in order to examine the influence of mesh size, its distribution and near-wall mesh size and type on the prediction of single phase gas velocity profiles[37]. A mesh comprising 1.3 × 10⁶tetrahedral cells was used.
[image:21.595.90.519.201.353.2](a) (b) (c)
Figure – 5: Computational mesh, (a): Tower top section, (b): Tower bottom section, (c): Tower cross-sectional view[37].
The velocity magnitude obtained from the measured mass flux is specified at the face of the inlet nozzles as the hot gas boundary condition. In the absence of measurement, the amount of cold air entering from the bottom of the tower is taken as 5% of the mass flow of the hot gas based on the data obtained in a laboratory-scale of the spray drying tower[48], and its temperature is specified as equal to the ambient temperature. The pressure outlet boundary condition is used at the top of the tower with experimentally measured value of 300 Pa. The inlet boundary conditions for the turbulence quantities were specified based on 5% turbulent intensity (It). The
inlet turbulence kinetic energy (kin) and energy dissipation rate (in) are calculated from kin =
1.5(UrefIt)2andin=Ckin3/2/ , respectively; where the mixing length, , is taken as 0.07 times of
the inlet nozzle diameter[42], Uref is the average gas velocity at the inlets. The components of
normal stresses are obtained as ui'2 u'j2 uk'2 2/3kin, and the shear stresses are taken to be
4. Results and Discussion
5.1 Aerodynamics characteristics
Figure 6 is a plot of representative predicted trajectories of the droplets/particles, coloured by the diameter, for Case 1 and 2. The smaller droplets/particles (100 µm) are entrained by the gas flowing in the upward direction, whereas larger diameter droplets/particles (>100 µm) flow downwards and impinge the tower wall atz/Z= 0.56 in both the cases. The particles are wet and when they strike the wall they are more susceptible to deposit there. In Case 1, withCr= 0.4, the
larger particles (> 200 µm) after striking the wall bounce back and pass through the central region of the tower towards the opposite wall because these particles have greater momentum compared to the smaller ones. The smaller particles (200 µm) start to move in the downward direction along the wall after striking the wall for the first time. In Case 2, i.e., Cr = f(wl), the particles move
along the wall after they strike the wall. In this case, since the values ofCrare less than 0.4 (see
Diameter (m) (a) Case 1 z/Z (b) Case 2
Figure – 6: Droplet/particle tracks coloured by diameter, (a)Cr= 0.4 and (b)Cr=(w ).
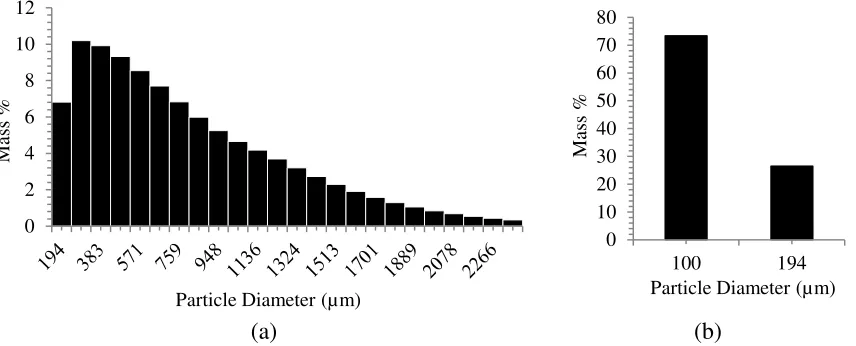
Figure 7(a) is a plot of the predicted particle size distribution (PSD) at the bottom of the tower and Figure 7(b) is the PSD plot of particles entrained by the gas and exit from the top of the tower for Case 2. The predicted PSD for Case 1 is similar to Case 2 therefore it is not plotted. A fraction of 200 m particle sizes exit from the top and the remaining exit from the bottom of the tower. All particle sizes > 200 m diameter exit from the bottom of the tower. 75% of the entrained particles by mass comprise 100m particles.
Figure 8 is a plot of discrete phase concentration along the tower radius at two axial locations. It represents the mass flow of the discrete phase passing through a computational cell per unit cell volume. The discrete phase concentration is highest near the wall and minimum in the central region of the tower in both cases. In Case 1 however, the concentration is relatively more uniformly distributed compared to Case 2 (see Figure 8 (a)), since the particles in Case 1 travel
0 0.1 0.2 0.3 0.4 0.5 0.6 0.7 0.8 0.9 1
a larger distance away from the wall after particle-wall collision, hence more dispersed. As the particles flow further downwards, the concentration distributions become similar for both cases (Figure 8(b)) since the centrifugal force on the particles arising from the swirling motion of the gas acts to retain the particles in the proximity of the wall.
The predicted distributions of the magnitude of the mean velocity vector of the gas, presented in normalised format, for Case 1 and 2 are plotted in Figure 9. It is interesting to note that the bend at the top exit of the spray drying tower (see Figure 2) does not affect the symmetry of the air flow pattern and the velocity profiles are similar in both x-z and y-z planes. The exit from the top of the tower is a pipe extending into the top region of the tower and then exiting by a right angled horizontal pipe. The presence of this inner pipe extending into the tower prevents the upper most flow becoming asymmetric. The CFD simulations confirm the symmetry of the flow patterns. As can be seen that the velocity distributions are very similar in both cases in the region downstream of the nozzle up to the first particles impingement point at z/Z 0.56. However, further downstream the velocity distributions are different due the variation in particles trajectories as shown in Figure 6. In the regionz/Z< 0.4, a lower velocity near the wall and at the centre occurs whilst a high velocity in the annular region is observed and the flow is generally symmetrical. The gas flow becomes asymmetric as it approaches the nozzle. This asymmetry persists in the top region of the tower above the nozzle. In Case 1, the low velocity zone in the centre of the tower below the nozzle (at z/Z 0.45) becomes wider because the particles pass through the centre after bouncing from the wall. The flow of gas becomes almost stationary in this region due to the exchange of momentum between the two phases. In Case 2, the high velocity annular region becomes narrower with height, which eventually disappears atz/Z0.5 and the velocity becomes more uniform over the cross-section except near the wall where the low velocity exists.
(a) (b)
Figure – 7: Size distribution of particles exiting from the (a) bottom and (b) top of the spray drying tower (Case 2).
(a) (b)
Figure – 8: Discrete phase concentration along the tower radius, (a) atz/Z= 0.5 and (b) atz/Z= 0.3.
0 2 4 6 8 10 12
M
as
s
%
Particle Diameter (µm)
0 10 20 30 40 50 60 70 80
100 194
M
as
s
%
Particle Diameter (µm)
0 0.2 0.4 0.6 0.8 1 1.2 1.4 1.6
-1 -0.5 0 0.5 1
r/R
Discrete phase concentration atz/Z= 0.5 Case 1 Case 2
0 0.2 0.4 0.6 0.8 1 1.2 1.4 1.6
-1 -0.5 0 0.5 1
r/R
[image:25.595.84.525.284.462.2]sup u u
x-z y-z z/Z x-z
y-z
[image:26.595.141.376.56.398.2]Case 1 Case 2
Figure – 9: Predicted contours of the normalised gas velocity magnitude.
sup
u u
Figure – 10: Gas flow pattern near the nozzle. 0
0.1 0.2 0.3 0.4 0.5 0.6 0.7 0.8 0.9 1
Droplets injection
Gas inlets
40o Spray
[image:26.595.175.430.435.763.2]Figure 11 is a plot of swirl number calculated using the predicted mean axial and tangential velocities along the dimensionless tower height for Case 1 and 2 and for the case with gas flow only (without particles). The swirl number characterizes the strength of a swirling flow and is defined as the ratio between the angular and the axial momentum fluxes[60]. The swirl in all cases decays as the gas flows up the tower. The swirl number without particles is significantly larger as the gas does not lose momentum due to interaction with particles. The swirl number below the spray nozzle (z/Z < 0.67) is greater in Case 1 compared to Case 2 because the tangential gas velocity in the near wall region along the tower height is higher in the former case. As discussed previously, in Case 1 the droplets/particles after collision with the wall do not flow close to the wall (see Figure 6) where the tangential velocity is maximum, therefore the transfer of angular momentum from the gas to the droplets/particles in Case 1 is less than that in Case 2. Abovez/Z
[image:27.595.97.502.385.612.2]= 0.67, the swirl number in both cases is close to zero as most of the angular momentum is transferred to the droplets/particles in this region. A high swirl number along the tower height is desirable as it results in an increased turbulence intensity which favours higher heat and mass transfer rates[53,54].
Figure – 11: Swirl number along the tower height.
Figure 12 is a plot of the residence time distribution of the particles that exit from the bottom of the tower. In both the cases, the residence time decreases rapidly with the increase in particle diameter up to 300m and then very slowly for larger particles because the smaller particles lose their initial momentum quicker. The trajectories of the smaller particles are also more influenced by the turbulence and recirculating gas flow compared with the larger particles, which substantially increases the residence time. A comparison of the two cases indicates that the
0 0.5 1 1.5 2 2.5
0.2 0.3 0.4 0.5 0.6 0.7 0.8
S
w
ir
l
N
u
m
b
er
(
)
Dimensionless Height (z/Z)
Case 1 Case 2
residence times in Case 2 are smaller for the particles less than 500 µm, while they are greater for larger particles. Since the gas velocity near the wall in Case 2 is smaller compared to Case 1. This is because all the particles in Case 2 start to move downwards close to the wall upon collision. The downward moving particles exert momentum on the gas flowing counter-current to the particles. This exchange of momentum causes the gas flow to become almost stationary near the wall. For sizes greater than 500 µm, the residence time becomes greater in Case 2, since the larger particles have greater moisture and loose more momentum upon each collision with the wall as they move downwards, although the gas velocity near the wall is smaller. In Case 1 however, most of the particles after striking the wall bounce back towards the centre and do not flow close to the wall at most of the tower height. Therefore relatively higher gas velocity exists near the wall. Hence the smaller particle sizes in Case 2 reach the bottom outlet much quicker compared to Case 1. The larger particles in Case 1 have greater momentum because particles after striking the wall do not lose all the momentum (as they have higher restitution coefficient) and thus move faster, this results in a lower residence time of the larger particles in Case 1.
Figure – 12: Residence time of the particles at the bottom outlet.
5.2 Heat and mass transfer characteristics
The predicted gas temperature and moisture fraction distributions in the x-z and y-z planes are depicted in Figure 13 and are remarkably similar in both planes. For both Case 1 and 2, the gas temperature is higher at the bottom of the tower and decreases up the tower primarily due to the heat exchange between the two phases. The gas temperature drop due to heat loss to the surrounding is relatively small. On the other hand, the moisture fraction is the minimum at the bottom and increases along the tower height due to inclusion of evaporated moisture from droplets and wet particles. The mass fraction of water vapour is a maximum in the spray region
0 10 20 30 40 50 60 70
100 600 1100 1600 2100
R
es
id
en
ce
T
im
e
(s
)
Particle Diameter (µm)
(K) x-z y-z
z/Z x-z
y-z
Temperature - Case 1 Temperature - Case 2
(kg/kg) x-z y-z
z/Z x-z
y-z
[image:30.595.146.384.58.713.2]Moisture - Case 1 Moisture - Case 2
Figure – 13: Distributions of gas temperature and moisture fraction. See the online version for coloured graphics.
0 0.1 0.2 0.3 0.4 0.5 0.6 0.7 0.8 0.9 1
Figure 14 is a plot of predicted temperature and normalised moisture fraction versus size of the particles that exit from the bottom outlet for Case 1 and 2. In general, the temperature of smaller size particles is higher compared with the larger particles. The moisture content of smaller particles sizes is less than that of the larger sizes. The particles up to 800 µm exit the tower at almost the same temperature, although the residence times of particles in this range are significantly different, because these particles are completely dry. Due to a high surface area and lower heat capacity of the small (dp800 µm), dried particles, they exit at a temperature similar
to the surrounding gas at the bottom outlet. A sharp decrease in the exit particle temperatures is observed for the particle sizes in the range of 900 µm to 1200 µm. This is because the particle drying rate in the third stage of drying (see Figure 3) depends on the boiling point of the slurry which is a function of moisture content (see equation 27). The slurry boiling point increases exponentially at a low moisture content (at 0 <wl/wl,o< 0.2). The exit moisture content of these
particle sizes lies in that range, hence a large difference in the exit temperatures of these particle sizes results with small changes in the exit moisture content. The exit temperature of particles greater than 1200 µm is fairly uniform because these particles exit with a high level of moisture and the slurry boiling point is fairly constant in that range of moisture content.
Figure – 14: Particle exit temperature and moisture content at the bottom outlet.
Figure – 15: Slurry boiling point as a function of normalised moisture content.
The predicted heat flux through the wall to the ambient, normalised by heat loss near the inlet, along the tower height is plotted in Figure 16. The heat flux is highest at the bottom of the tower and decreases with increasing height, eventually becomes nearly constant at z/Z > 0.67 (above the nozzle). This is because the inner wall temperature gradually reduces from the bottom of the tower up to the level of the nozzle as the gas temperature decreases due to heat exchange with the droplets/particles. The gas temperature is fairly constant above the nozzle (see Figure 13) and hence the heat flux is also constant. The heat loss to the surrounding up to a height ofz/Z= 0.67 in Case 2 is smaller compared to Case 1 due to a lower gas temperature in the proximity to the wall. However, the heat loss in Case 2 is greater above the nozzle due to a higher gas temperature
0 0.1 0.2 0.3 0.4 0.5 0.6 0.7 0.8 0.9 1 350 370 390 410 430 450 470 490
100 600 1100 1600 2100
N o rm al is ed m o is tu re fr ac ti o n ( wl /w l, o ) P ar ti cl e T em p er at u re (K )
Particle Diameter (µm) Case 1 Case 2 360 380 400 420 440 460 480 500 520 540
0 0.1 0.2 0.3 0.4 0.5 0.6 0.7 0.8 0.9 1
Tb
o
il
(K
)
[image:32.595.124.479.329.563.2]in this region as explained above. Total heat loss from the wall to the surrounding is about 1.2% of the total heat input to the tower for Case 1 and 1% for Case 2.
Figure – 16: Predicted heat flux through the wall along the tower height.
5.3 Comparison between measurements and predictions
Table 4 lists the predicted weighted average moisture contents and temperatures of the particles at the bottom outlet together with the exhaust gas temperature and total heat loss for both cases and equivalent measured values. Case 1 predicts greater heat and mass transfer between the two phases and hence smaller average particle moisture content and exhaust gas temperature and higher average particle temperature compared to Case 2. A comparison of the simulation results with the experimental data reveals that the measured moisture content and outlet gas temperature are smaller than that predicted. Hence the rate of heat transfer between the two phases is underpredicted in both simulation cases. One of the reasons for this discrepancy may be due to the use of dried powder PSD, in the absence of measurement, as the initial droplet size distribution, which is typically larger than the initial droplet size distribution. A comparison of measured detergent slurry droplet size distribution at the spray nozzle exit and dried powder size distribution in the same drying tower is given by Aliet al.[45], in which the measured droplet size distribution is in the range of 50 to 1000 µm with a sauter mean diameter of 200 µm while the powder size distribution ranges from 100 to 2300 µm with a sauter mean diameter of 350 µm. The other reason for the discrepancy is the underprediction of the residence time of the particles due to the assumption of smooth spherical particles. In reality, the shape of the particles will change throughout the tower height due to morphological changes during drying and agglomeration, which can affect the drag force as well as the heat and mass transfer coefficients. The deposition of wet particles on the walls is also ignored in the simulation. As observed
0 0.1 0.2 0.3 0.4 0.5 0.6 0.7 0.8 0.9 1
0.1 0.2 0.3 0.4 0.5 0.6 0.7 0.8 0.9 1
N
o
rm
al
is
ed
h
ea
t
fl
u
x
z/Z
experimentally, particles are deposited on the wall and remain exposed to the hot gas for a longer period before being entrained back into the gas flow.
Table – 4: Comparison of CFD simulation results with measurements at the spray drying tower exit.
Parameter Case 1 Case 2 Measured
Particle weighted average normalised moisture content 0.1 0.16 0.06 Particle weighted average temperature, K 468.2 456.2 356
Outlet gas temperature, K 375.3 381.4 367
Heat loss as percentage of total heat input, % 1.2 1 11*
6. Concluding Remarks
Three-dimensional steady-state, multiphase CFD simulations of a pilot-plant counter-current spray drying tower used for the manufacture of detergent power have been carried out allowing heat, mass and momentum exchanges between the discrete and the continuous phase and heat loss from the tower wall to the surrounding. A single slurry-droplet drying kinetic model is used to represent the drying process of polydispersed droplets/particles. Calculations are carried out using two different values of the restitution coefficient (referred to as simulation Case 1 and 2) in order to examine the effect of the particle-wall collision on the droplet/particle trajectories and hence on the dry powder properties. The detailed information on the gas velocity, temperature and moisture profiles as well as polydispersed droplet/particle trajectories, residence time, temperature and moisture content provides an improved insight into the detergent slurry drying process and can be used to facilitate optimisation of the spray drying process.
size distribution must to be specified as the input condition as well as changes in droplet/particle size due to coalescence and agglomeration also need to be considered. It is assumed that no deposition of material occurs upon the collision of droplets/particles with the wall. In reality, the droplets and wet particles are deposited on the wall and may be re-entrained back into the gas flow; these phenomena though extremely complex[55] need to be considered for a realistic simulation of the spray drying process.
Acknowledgements
Financial support by Procter and Gamble, Newcastle Innovation Centres and University of Leeds for the first author is gratefully acknowledged. The authors would like to thank Mr. Zayeed Alam, Procter and Gamble for his support and encouragement.
References
1. Hecht, J. P. (2012). Personal communication. Newcastle Technical Centre, UK.
2. Masters, K. Spray Drying: An introduction to Principles, Operational Practice and Applications; Leonard Hill Books: London, 1972.
3. Marshall, W. R. and Seltzer, E. Principles of spray drying: Part II – Elements of spray-dryer design. Chemical Engineering Progress 1950, 46, 575-584.
4. Bahu, E. R. Spray Drying – Maturity or Opportunities? Drying 1992, part - A, 74-91.
5. Masters, K. Scale-up of spray dryers. Drying Technology 1995, 121 (2), 235-257.
6. Langrish, T. A. and Fletcher, D. F. Prospects for the Modelling and Design of Spray Dryers in the 21st Century. Drying Technology 2003, 21 (2), 197-215.
7. Xin, H. L. and Mujumdar, A.S. Spray drying and its application in food processing. In: Innovation in food engineering. pp. 303-329, CRC Press, 2009.
spray dryers. Drying 1992, Ed. Mujumdar, A. S., pp. 407-416, New York: Hemisphere Publishing Corp.
9. Oakley, D. E. and Bahu, R. E. Computational modelling of spray dryers. European symposium on Computer Aided Process Engineering-2 1993, 493-498.
10. Langrish, T. A. G. and Zbicinski, I. The effects of air inlet geometry and spray cone angle on the wall deposition rate in spray dryers. Trans IChemE 1994, 72 (A), 420-430.
11. Zbicinski, I. Development and experimental verification of momentum, heat and mass transfer model in spray drying. The Chemical Engineering Journal 1995, 58, 123-133.
12. Kieviet, F. G. Modelling Quality in spray drying. Eindhoven University of Technology, PhD Thesis, 1997.
13. Southwell, D. B., Langrish, T. A. G. and Fletcher, D. F. Process intensification in spray dryers by turbulence enhancement. Trans IChemE 1999, 77 (A), 189-205.
14. Straatsma, J., Houwelingen, G. V., Steenbergen, A. E. and Jong, P. D. Spray drying of food products: 1. Simulation model. Journal of Food Engineering 1999, 42, 67-72.
15. Harvie, D. J. E., Langrish, T. A. G. and Fletcher, D. F. A computational fluid dynamics study of a tall-form spray dryer. Trans IChemE 2002, 80, 163-175.
16. Huang, L., Kumar, K. and Mujumdar, A. S. A parametric study of gas flow patterns and drying performance of co-current spray dryer: results of a computational fluid dynamics study. Drying Technology 2003, 21 (6), 957-978.
17. Huang, L., Passos, M. L., Kumar, K. and Mujumdar, A. S. A three-dimensional simulation of a spray dryer with a rotary atomizer. Drying 2004 – Proceedings of the 14thinternational drying symposium (IDS 2004), A, 319-325.
19. Huang, L. X., Kumar, K. and Mujumdar, A. S. A comparative study of a spray dryer with rotary disc atomizer and pressure nozzle using computational fluid dynamic simulations. Chemical Engineering and Processing: Process Intensification 2006, 45, 461-470.
20. Verdurmen, R. E. M., Menn, P., Ritzert, J., Blei, S., Nhumaio, G. C. S., Sonne Sørensen, T., Gunsing, M., Straatsma, J., Verschueren, M., Sibeijn, M., Schulte, G., Fritsching, U., Bauckhage, K., Tropea, C., Sommerfeld, M., Watkins, P., Yule, A. J., and Schønfeldt, H. Simulation of Agglomeration in Spray Drying Installations: The EDECAD Project. Drying Technology 2004, vol. 22 (6), 1403-1461.
21. Kota, K. and Langrish, T. Prediction of Deposition Patterns in a Pilot-Scale Spray Dryer Using Computational Fluid Dynamics (CFD) Simulations, Chemical Product and Process Modeling 2007, 2 (3), Article 26.
22. Anandharamakrishnan, C., Gimbun, J., Stapley, A. G. F. and Rilley, C. D. A study of particle histories during spray drying using computational fluid dynamic simulations. Drying Technology 2010, 28, 566-576.
23. Saleh, S. N. CFD simulations of a co-current spray dryer. World academy of Science, Engineering and Technology 2010, 62, 772-777.
24. Mezhericher, M., Levy, A. and Borde, I. Droplet-Droplet Interactions in Spray Drying by Using 2D Computational Fluid Dynamics. Drying Technology 2008, 26, 265- 282.
25. Mezhericher, M., Levy, A. and Borde, I. Modeling of Droplet Drying in Spray Chambers Using 2D and 3D Computational Fluid Dynamics. Drying Technology 2009, 27, 359-370.
26. Mezhericher, M., Levy, A. and Borde, I. Spray drying modelling based on advanced droplet drying kinetics. Chemical Engineering and Processing: Process Intensification 2010, 49, 1205– 1213.
28. Crowe, C. T. Modeling spray-air contact in spray-drying systems. Advances in Drying 1980, 1, 63-99.
29. Kuriakose, R. and Anandharamakrishnan, C. Computational fluid dynamics (CFD) applications in spray drying of food products. Trends in Food Science & Technology 2010, 21, 383-398.
30. Crowe, C. T. Droplet-gas interaction in counter-current spray dryers. Drying Technology 1983, 1, 35-56.
31. Zbicinski, I. and Zietara, R. CFD model of counter-current spray drying process. Drying 2004, São Paulo, Brazil, A, 169-176.
32. Wawrzyniak, P., Podyma, M., Zbicinski, I., Bartczak, Z., Polanczyk, A. and Rabaeva, J. Model of heat and mass transfer in an industrial counter-current spray-drying tower. Drying Technology 2012, 30, 1274-1282.
33. Wawrzyniak, P., Jaskulski, M., Zbicinski, I. amd Podyma, M. Two phase CFD model of a counter-current spray drying process.19thInternational Drying Symposium(IDS 2014), France.
34. Jaskulski, M., Wawrzyniak, P. and Zbicinski, I. CFD model of particle agglomeration in spray drying. Drying Technology 2015, 33, 1971-1980.
35. Zbicinski, I. and Piatkowski, M. Continuous and discrete phase behavior in counter-current spray drying process. Drying Technology 2009, 27, 1353-1362.
36. Sommerfeld M. Validation of a stochastic Lagrangian modeling approach for inter-particle collisions in homogeneous isotropic turbulence. International Journal of Multiphase Flow 2001, 27, 1829-1858.
37. Ali, M. Numerical modelling of a counter-current spray drying tower. Institute of Particle Science and Engineering, University of Leeds, UK, Ph.D thesis, 2014.
planetary boundary layer. Journal of the Atmospheric Sciences 1973, 30, 1327-1339.
39. Launder, B. E., Reece, G. J. and Rodi, W. Progress in the development of a Reynolds-stress turbulence closure. Journal of Fluid Mechanics 1975, 68 (3), 537-566.
40. Cebeci, T. and Bradshaw, P. Momentum Transfer in Boundary Layers; McGraw-Hill: London, 1977.
41. Versteeg, H. K. and Malalasekera, W. An Introduction to Computational Fluid Dynamics; Pearson Education Ltd.: Harlow, England, second edition, 2007.
42. Fluent User’s guide., Ansys Inc. (2009), http://www.ansys.com
43. Griffith, J. D., Bayly, A. E. and Johns, M. L. Magnetic resonance studies of detergent drop drying. Chemical Engineering Science 2008, 63, 3449-3456.
44. Nelson, P. A. and Stevens, W. F. Size distribution of droplets from centrifugal spray nozzles. AICHE Journal 1961, 7 (1), 80-86.
45. Ali, M., Mahmud, T., Heggs, P. J., Ghadiri, M., Djurdjevic, D., Ahmadian, H., Juan, L. M., Amador, C. and Bayly, A. A one-dimensional plug-flow model of a counter-current spray drying tower. Chemical Engineering Research and Design 2014, 92, 826-841.
46. Rosin, P., Rammler, E. The Laws Governing the Fineness of Powdered Coal. Journal of the Institute of Fuel 1933, 7, 29-36.
47. Gambit, version 2.4 (2006), http://www.ansys.com
48. Bayly, A.E., Jukes, P., Groombridge, M. and McNally, C. Airflow patterns in a counter-current spray drying tower – simulation and measurement. Proceedings of the 14th International Drying Symposium, 2004, Sao Paulo, 22-25 August, B, 775-781.
50. Hecht J. P. and King C. J. Spray Drying: Influence of Developing Drop Morphology on Drying Rates and Retention of Volatile Substances. 2: Modeling. Industrial and Engineering Chemistry Research 2000, 39, 1766-1774.
51. Ranz, W. E. and Marshall, W. R. Evaporation from drops. Chemical Engineering Progress 1952, 48, 141-146, 173-180.
52. Crank, J. The Mathematics of Diffusion; Clarendon Press: Oxford, second edn., 1975.
53. Chaloud, J. H., Martin, J. B. and Baker, J. S. Fundamentals of spray-drying detergents. Chemical Engineering Progress 1975, 53 (12), 593-596.
54. Chang, F. and Dhir, V. K. Mechanisms of heat transfer enhancement and slow decay of swirl in tubes using tangential injection. International Journal of Heat and Fluid Flow 1995, 16 (2), 78–87.
55. Francia, V. Martin, L., Bayly, A. E. and Simmons, M. J. H. The role of wall deposition and re-entrainment in swirl spray dryers. AIChE Journal 2015, 61 (6), 1804-1821.
56. Issa, R. I. Solution of the implicitly discretised fluid flow equations by operator splitting. Journal of Computational Physics 1985, 62, 40-65.
57. Hutchinson, P., Hewitt, G. F. and Dukler, A. E. Deposition of liquid or solid dispersions from turbulent gas streams: a stochastic model. Chemical Engineering Science 1971, 26, 419-439.
58. Morsi, S. A. and Alexander, A. J. An investigation of particle trajectories in two-phase flow systems. Journal of Fluid Mechanics 1972, 55 (2), 193-208.
59. Viegas, J. R., Rubesin, M. W. and Hortsman, C. C. On the use of wall functions as boundary conditions for two-dimensional separated compressible flows. Technical Report AIAA-85-0180 1985, AIAA, 23rd Aerospace Sciences Meeting, Reno, Nevada.
Nomenclature
A surface area (m2)
D
C drag coefficient
r
C restitution coefficient s
v
C , surface vapour concentration (kg/m3)
,
v
C equilibrium vapour concentration (kg/m3)
Cs roughness constant
p
c specific heat (J/kgK)
cp,mix specific heat of gas mixture = , (J/kgK)
m i
D, diffusion coefficient for speciesi(m2/s)
WS
D internal diffusivity of moisture (m2/s)
d diameter (m)
dm size constant (m)
d
F drag force (N)
F source term for momentum transfer (kg/m2s2)
g gravitational acceleration (m/s2) h enthalpy (J/kg)
fg
h latent heat of vapourisation (J/kg)
J diffusion flux (kg/m2s) K partition coefficient
kc mass transfer coefficient (m/s)
s
k dimensionless roughness height ks roughness height (m)
M mass (kg)
p
m mass of particle in a parcel (kg)
p
m mass flow of parcel (kg/s)
Mw molecular weight (kg/mol)
P Pressure (Pa) Pr Prandtl number
Q slurry volumetric flow (m3/s)
Rg gas constant (m3Pa/molK)
Re Reynolds number
r radius (m)
ro nozzle radius (m)
rc air core radius (m)
S species source term (kg/m3s)
m
S continuity equation source term (kg/m3s)
T temperature (K)
Tboil boiling temperature (K)
TPo temperature at near-wall node (K)
t time (s)
sd
t surface drying time (s)
U overall heat transfer coefficient (W/m2K)
Up velocity at near-wall node (m/s)
u time-average velocity component (m/s) p
u particle velocity (m/s)
u+ dimensionless velocity
'
u fluctuating velocity component (m/s)
u friction velocity (m/s)
us distribution parameter
Vcell computational cell volume (m3) l
w moisture fraction
s
w solid fraction
x cartesian coordinate axis
Y mass fraction
d
Y cumulative mass fraction
y dimensionless distance from wall
z axial location (m)
Z total tower height (m)
Greek letters
thickness (m) change
turbulence dissipation rate (m2/s3) von Kármán constant
density (kg/m3) viscosity (kg/ms)
spray cone angle (degree) thermal conductivity (W/mK)
normally distributed random number
Subscripts
boil of the boiling point
c of the air core
dep of the deposit
drop of the droplet/slurry
g of the drying gas
i species, parcel and coordinate index
ins of the insulation
in at the inlet
l of the liquid
o initial value
out at the outlet
p of the particle
ref reference
s of the solid
sup superficial
v of the vapour
![Figure – 3: Different stages of drying of a slurry droplet[45]](https://thumb-us.123doks.com/thumbv2/123dok_us/1996990.161756/15.595.108.535.54.345/figure-different-stages-drying-slurry-droplet.webp)