The JOULE-THERMIE programme was launched in 1995 as the European Union's first 'integrated' programme, bringing together the resources of the European Commission Directorates-General XII (Science, Research and Development) and XVII (Energy). This programme is funded by the European Union's Fourth Framework Programme for Research and Technological Development, one of the most extensive research funding initiatives available to European companies and research organisations.
The JOULE-THERMIE programme runs until1998 and has a total budget of 1,030 MECU of which 566 MECU are allocated to the THERMIE demonstration component of the programme for the support of projects and assosciated measures. THERMIE is focused on the cost-effective, environmentally-friendly and targeted demonstration and promotion of clean and efficient energy technologies. These consist of renewable energy technologies; rational use of energy in industry; buildings and transport; a clean and more efficient use of solid fuels and hydrocarbons. Essentially, THERMIE supports actions which are aimed at proving both the technologcal and economical viability and validity of energy technologies by highlighting the benefits and by assuring a wider replication and market penetration both in EU and global markets.
Colour Coding
To enable readers to quickly identify those Maxi brochure relating to specific parts of the THERMIE Programme each Maxibrochure is colour coded with a stripe in the lower right hand corner of the front cover, i.e.:
- RATIONAL USE OF ENERGY- RUE
RENEWABLE ENERGY SOURCES - RES
- SOLID FUELS- SF
- HYDROCARBONS-He
- GENERAL-GEN
Reproduction of the Contents is subject to acknowledgement of the European Commission.
Neither the European Commission, nor any person acting on its behalf: a) make any warranty or representation, express or implied, with respect to the information contained in this publication; b) assumes any liability with respect to the use of, or damages resulting from this information.
The views expressed in this publication do not necessarily reflect the views of the Commission.
Acknowledgements
The material contained in this Maxibrochure is extracted from Market Assessment No: HC 6.5 prepared on behalf of the European Commission by Beicip-Franlab.
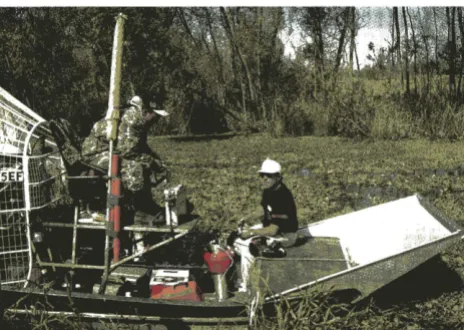
Front Page photo: Promotional operation of POLYSEIS in Louisianna
European Geoscience
Technologies:
Reducing the risk in oil and gas exploration
THERMIE PROGRAMME ACTION No:DIS-140-95-UK
acMPT
The Centre for Marine and Petroleum Technology
For the European Commission
Directorate-General for Energy (DG XVII)
CMPT
Other Maxibrochures in the hydrocarbons series:
Oil and Gas Technology -Investing in a major European
Industry for Future Security and Prosperity
Subsea Diverless Intervention Systems in the Offshore
Oil Industry
The Oil Production Industry in Western Siberia and the
Environment- Current Practices and Prospects for
Change
Oil and Gas Process Technology - the latest advances for
use on offshore production installations
European Technologies for Oil and Gas Exploration in
Remote and Poorly Accessible Areas
Market Prospects for Multiphase Technology
Pollution Control Technologies: limiting the
CONTENTS
1.
INTRODUCTION5
2.
SEISMIC SURVEYING6
2.1.
Marine Seismic Data Acquisition6
2.2.
Land Seismic Data Acquisition10
2.3.
Seismic Data Processing and Modelling12
2.4.
Seismic Interpretation15
2.5.
Well Seismic Data Acquisition16
2.6.
Potential Methods18
3.
GEOLOGY19
3.1.
General19
3.2.
Acquisition19
3.3.
Interpretation and Modelling20
4.
GEOCHEMISTRY22
4.1.
General22
4.2.
Acquisition23
4.3.
Basin Modelling23
4.4.
Reservoir Chemistry23
5.
CROSS-DISCIPLINES23
5.1.
Databases23
5.2.
Visualisation and Mapping Tools23
1. INTRODUCTION
Petroleum exploration technologies, such as seismic surveying, are used to identify potential prospects and to determine where exploratory wells should be drilled. Since the birth of the oil and gas industry, considerable research and development relating to these technologies has been made by specialised research centres,
contractors, and oil companies. As a result, significant progress has been made both in terms of new technology and improved methodologies.
The ultimate aim of the industry has been to reduce the cost risks associated with petroleum exploration by: • identifying new structures and traps in previously
explored areas;
• reducing the number of dry wells that are drilled; • reducing overall exploration costs.
In the 1980s, the fall in the price of crude oil made the exploration of frontier areas financially less attractive and put an emphasis on re-exploring existing petroleum provinces. New technology has improved the
[image:7.575.27.537.452.745.2]explorationist's ability to image the sub-surface, build geological and geochemical models of sub-surface conditions, and predict reservoir behaviour. This has enabled new surveys over previously explored regions to uncover additional reserves. Consequently a statistical
Table 1 Main advances in petroleum exploration geoscience
1. Data acquisition
2. Data processing
3. Data interpretation and modelling
4. Integration
5. Standardisation
6. Global understanding
review of petroleum discoveries since the 1980s shows that the bulk of new discoveries are in established provinces rather than frontier regions.
Similarly, an improved understanding of sub-surface conditions through enhanced imaging, interpretation and modelling will lead to a reduction in the number of dry wells drilled.
The geophysical industry has particularly benefited from the advent of supercomputers which allow large volumes of data to be processed relatively quickly. Combined with new techniques such as multi-streamer surveys offshore, this has reduced overall costs.
Further advances in computer capabilities are expected in the near future, and it is envisaged that these will help geophysicists to overcome the remaining limitations on data processing. Developments in exploration technology will also help to open new frontier areas, for example, the Arctic, deep offshore, remote onshore and geologically complex settings, such as fold belts. (See also European
Technologies for Oil and Gas Exploration in Remote and Poorly Accessible Areas.)
This maxibrochure summarises the state-of-the-art of exploration technology and emphasises "near-market" technologies being developed in Europe. The main areas of development are summarised in Table 1.
New technology and approaches have led to an increased volume of data for less cost, and improved accuracy.
Hardware capabilities have increased significantly in terms of speed and capacity.
New and improved software has been developed for data interpretation. Modelling of more complex structures and specific phenomena is now possible.
Integration between the various geoscience disciplines has increased, e.g. geology, geophysics, geochemistry.
Common computing standards and products are being developed.
6
2. SEISMIC SURVEYING
Within geoscience, the most advanced technological innovations have been related to seismic surveying and the handling of seismic data.
In terms of data acquisition, marine developments have included:
• the introduction of multi-streamer techniques;
• enhanced quality control of the source;
• the use of global positioning systems to improve survey accuracy;
• the introduction of 24-bit recording systems;
• new media for data storage;
• improved on-board processing systems.
Specific technologies have also been adapted for shallow water, swamp conditions and transition zones.
Developments related to the acquisition of seismic data onshore have concentrated on reducing the costs involved and improving the quality of the data.
Conventional seismic data processing has become increasingly integrated with acquisition, and the main processing activities of both onshore or offshore data are now performed in the field. Only activities that require lengthy human input (e.g. velocity field determination) or large computing power (e.g. migration) are performed independently of acquisition.
The evolution of seismic data processing has been closely related to the development of high-performance
computers. For example, parallel processors now allow large data cubes to be accurately depth migrated and much smaller features to be resolved. Improved structural definition has, in turn, led to better reservoir descriptions. New techniques and analysis tools that can predict reservoir and fluid properties from variations in seismic amplitude now exist.
Interactive interpretation workstations that operate in three dimensions are now extensively used in the industry. The detection of subtle structural features has been enhanced by three-dimensional auto-picking methods and horizon attribute maps. Future
improvements in three-dimensional interpretation are highly dependent on visualisation tools and the integration of geological and reservoir engineering information into the process.
2.1 Marine Seismic Data Acquisition
Survey methods
In general, seismic survey vessels are developed and owned by large international contractors such as Western Geophysical (USA), Geco-Prakla (part of Schlumberger, France), and PGS Exploration (Norway). Most vessels are now equipped for 3D seismic data acquisition.
The introduction of multi-streamer techniques in the 1980s resulted in a significant increase in productivity and a related decrease in acquisition costs. For example, a ship carrying out a high-resolution survey can tow up to 12 streamers spaced 25 -50 m apart, resulting in a bin size of 12.5 - 25 m. Compared to previous techniques, a much larger surface area is covered in one pass. In addition, streamer lengths up to 5,000 m can now be used to explore deep targets. The original limitations on multi-streamer surveys were data management, quality control and accuracy, but contractors have responded by developing integrated database management systems, on-line quality control, and improved positioning systems.
Another considerable advance was the introduction of Multi-Vessel/Multi-Streamer (MVMS) acquisition. This method is particularly useful for acquiring data from complex structures that can only be analysed using large offsets and azimuth distributions. One of the largest MVMS surveys was shot in the North Sea in 1994 by PGS Exploration for Norsk Hydro and BP Norway. The survey employed three vessels in a ten-streamer configuration. Twenty lines of data were acquired for each traverse of the vessels by using two seismic sources simultaneously. However, in complex structural areas or areas with high noise levels and difficult multiple problems, BP recommends single-source acquisition to produce high fold at lower cost.
The best way to obtain high-quality long offset data (up to 6,000 m) is to use two ships, each towing half of the required length of streamer. With this configuration, streamer positions are easier to control because each streamer has a compass on the tailpoint and frogpoint. Moreover, the ships can make tighter turns with shorter streamers, a parameter that can considerably influence the cost of a 3D survey.
Parallel acquisition, with two or three vessels, covers a broad azimuthal distribution and may help to solve fracture distribution problems as well as
litho-stratigraphical ones. The main limitation for this method is that the azimuthal measurement cannot, at present, be fully accounted for during processing.
Sources
The control of the sources is an important influence on the resolution of acquired data, and therefore the
reservoir description. There are two areas in which source improvements are possible:
• quality control of the emitted signal;
• shot-by-shot measurement of the near-field signature.
Shot-by-shot measurement of the near-field signature would help in the prediction of the far-field signature which is, in turn, used to deconvolve the data.
than other products, and also require less maintenance. The latter factor adds to the gun's economic
attractiveness. The guns also offer an enhanced frequency spectrum and peak-to-bubble ratio.
The Trisor system, being developed by Geco-Prakla, distributes electronics in the sea to provide firing control, digitise sensor data for firing time, and measure source depth, near-field signature and airgun firing pressure. These measurements allow the sources to be monitored by computing the far-field signatures. Source tuning based on peak pressure alignment can also be carried out on-board in real time.
Data resolution could be improved by using a source that emits a signal with more high-frequency components, such as the marine vibrator. Although this source is only suitable for surveys that are not constrained by time (e.g. time-lapse acquisition), it has the advantage of lower environmental impact compared to the airgun. It would therefore be useful in protected environments such as the Caspian Sea.
In a JOULE-THERMIE project being undertaken by OGS (Trieste, Italy) with DINMA (University of Trieste) and IPGP (Paris, France) a new airgun array source is being developed to resolve and image deep targets and complex structures. The air gun array source, operating in a "Single Bubble" mode, is designed to overcome the poor effectiveness of large tuned arrays in the medium-to-low frequency band (10-40Hz). The basic principle of the low frequency pulse generation consists in centring the output of the array on the first bubble pulse, by sequential firing of different size guns in the array. OGS is planning to demonstrate the prototype system (for synchronisation of the guns and quality control of the shooting operations) in two test areas close to the Italian coast. The first is the Paola Basin in the Southern Tyrrhenian Sea, a N-S elongated basin with thick Plio-Quaternary deposits which accumulated on an active continental margin with thinned crust. The second area is located in the Pelagian Basin (Southern Sicily offshore), an area attracting several prospections for oil research. This area is characterised by thick Tertiary and Mesozoic sequences with thick carbonate intervals alternating with shales, marls and sandstones.
Positioning systems
The precise location of all the components in a 3D survey (sources and hydrophones) is vital for setting the exact limits of the target and placing a new well. The
introduction of Global Positioning Systems (GPSs) in the 1980s represented a major breakthrough for navigation. These systems provide the accuracy required for seismic surveying, and contractors and oil companies do not expect any further advances in this area in the near future.
Western Geophysical has introduced the Sargas GPS which consists of a highly sophisticated network of
reference stations, satellite communications, and on-board processing of navigation data in real time.
Geco-Prakla's integrated acquisition approach,
TRILOGY, has a single hardware and software platform, TRINAV, that reduces the long turnaround associated with processing navigation data. TRINAV monitors the acquisition of navigation data in real-time and can complete data processing on-board.
Total (France) has developed the Concept System, a three-dimensional tool that allows the position of the survey vessel to be checked.
Seanor Technology (Basingstoke, UK) has developed a pressure transducer that allows the towing depth of airguns to be determined with an accuracy of 10 mm.
Recording systems
In recent years the main developments have been:
• the introduction of 24-bit acquisition techniques;
• an increased number of recording channels.
Twenty-four-bit technology has brought the analogue-to-digital converter close to the hydrophones and resulted in a significant increase in the quality of the raw data. One example of this technology is the 110 System Two developed by Delta Sigma Technology. This system has an instantaneous dynamic range of 120 dB which allows a very low signal to be recorded even if there is a high noise level.
The number of channels that can be recorded
simultaneously is a vital parameter for two main reasons. First, productivity is related to the number of seismic traces generated by a shotpoint at one time. Second, spatial filtering improves with more channels and noise can be reduced.
Most of the current 3D recording systems have thousands of channels. For example, Western Atlas's Vision 8000 (Canada) has 7,680 channels and Sercel's SN388 has 19,200. No major technological advance in marine seismic recording systems is expected in the near future.
High-density storage systems
The datasets of 3D seismic surveys frequently reach the terabyte size (1 Tb = 1012
bytes), and the storage, handling and transporting capabilities of conventional storage systems have been pushed to their limits.
8
Fig I R/V OGS-Explora while demonstrating the innovative high energy and low frequency Sinbus source
~ ~ CDl'J
t
g ______ 8 -.0 .000
.500
1.000
1.500
2.000
2.500
3.000
3.500
4.000
4.500
5.000
Fig 2 Part of a stack section acquired with Sinbus source (note the still good resolution in the shallow even though the acquisition was aimed at deep penetration
[image:10.577.46.552.47.403.2] [image:10.577.351.534.444.792.2] [image:10.577.49.295.458.786.2]months because each tape or cartridge has to be loaded onto the centre's computers by hand.
In 1993 a new technology emerged - D2 helical scan video recording tapes. Compared to traditional tapes, D2 tapes have a higher density, faster data transfer rates, and increased reliability.
A 59-day test survey carried out by Mobil in the Gulf of Mexico using a Geco-Prakla survey vessel, recorded data on both conventional 3480 cartridges and D2 tapes. The vessel recorded 2,250 km of seismic lines using 320, 480 and 960 channel shots, resulting in around 215 Gb of data. The data were stored on nine D2 tapes compared to 1,360 cartridges. Validation of the D2 data was made by bit-to-bit comparisons and by processing the data with existing software.
Raytheon E-Systems (USA) has now produced its EMASS Data Tower to exploit the D2 technology. The Data Tower requires only 2.5 m2 of space and can handle
a 5.7 Tb data volume with only 228 D2 tapes of 25Gb capacity. The system can replace five automated tape silos occupying a space of 87 m2 and using 30,000
cartridges.
The CY-9000 digital data recorder, supplied by
Cybernetics (USA), also uses high capacity storage with 42 Gb tapes, storing data at 12 Mb per second (1Mb =
106 bytes).
An alternative recording technology based on the "linear" technique has been developed by IBM. The conventional IBM 3490 system uses half-inch cartridges with 36 parallel tracks, and fixed read/write heads. The new 3590 system employs 128 tracks on a half-inch tape, and can store up to 10 Gb of data. Furthermore the data flow is three times faster (9 Mb/s for the 3590 compared to 3 Mb/s for the 3490). IBM claims the linear technique offers better reliability for continuous data flow applications such as seismic data acquisition.
This technology is still undergoing rapid evolution and the competition between helical and linear technology has prevented the adoption of an industry-wide standard. This presents obvious difficulties for those responsible for selecting data-storage equipment. However,
preliminary discussions between the various companies have been reported and a common standard may eventually be adopted.
On-board processing systems and transmission systems
On-board processing has been developed to the level of providing a stacked 3D block and a raw time migration within three weeks of data acquisition being completed. An example of an on-board processing system is Geco-Prakla's processing software, TRIPRO, which is fu1ly integrated with TRILOGY, its acquisition system. CGG (France) also uses an on-line interactive processing package called GEO-QA/QC that integrates quality
control with quality assurance, and can be implemented on-line with the Sercel SN388 acquisition system. GEO-QA/QC is a subset of the processing package,
GEOVECTEUR+.
One challenge for on-board processing is the
development of computers powerful enough to carry out real-time processing. Once real-time processing is achieved, new methodologies will be needed to speed up the remaining manual phase of the processing,
particularly stacking velocity analysis.
However, on-board processing is not a satisfactory solution for many oil companies because it requires experienced processing supervisors to work on survey vessels. Developments in satelJite communications made by other industries (e.g. telecommunications) are therefore followed with interest because they may eventually enable data to be quickly and efficiently transferred to an onshore processing centre.
At present, data can be transmitted by satellite at a rate of 64 Kb/s, but the cost of such communication on a public channel is prohibitive for large amounts of data. As a result, the seismic industry only transfers quality control data in this way. Within the next three years, the cost of satellite communication is expected to decrease. Some contractors are already planing to buy their own satellite channel, while others are planning to improve data compression techniques, therefore reducing the volume to be transferred.
Shallow water and transition zones
Seismic acquisition in shallow water and transition zones (swamps, tidal mudflats, estuaries, harbours, coral reefs, fishing zones, areas of ecological preservation, etc.) has changed rapidly over the past five years following the introduction of Ocean Bottom Cable (OBC) and radio-frequency telemetry systems. These techniques can also be used in congested offshore areas where production facilities make towed-streamer operations hazardous or impossible.
The OBC method combines land and marine seismic data acquisition techniques in that it employs receiver arrays fixed to the ocean floor and a marine vessel towing the source array. The use of a conventional survey vessel as a source was the first step in the evolution of the method. In the early 1990s dual sensor technology and digital telemetry recording systems were introduced. This greatly improved the accuracy and reliability of the equipment.
10
Digital telemetry recording systems enhance the dual-sensor OBC method by eliminating problems associated with analogue cables, such as leakage, phase distortion and crosstalk. One such system is manufactured by Western Geophysical Exploration Products. The eight-channel remote telemetry units are protected by a cylindrical steel housing with bottom cable connectors at each end. This housing is designed for operations at depths down to 200 m. Each remote unit receives and digitises four seismic channels from each of the two bottom cable segments to which it is attached. Two channels are dedicated to each receiver station (one for the hydrophones and one for the geophones). Each remote unit processes and transmits the data for its closest four receiver stations.
Another system is SYNTRACK. Manufactured by Syntron (USA), its remote units can convert the signals from 12 adjacent channels or six dual-sensor receiver stations. This system supports very long cable lengths (up to 24 km) and up to 1,920 recording channels with a 2 ms sample interval.
Bottom cable acquisition produces better technical results than towed streamer acquisition because it:
• eliminates the streamer "ghost";
• improves signal-to-noise ratios;
• improves the accuracy of location groups;
• reduces ambient noise to reveal sub-surface structures that would be hidden to conventional techniques.
However, OBC is expensive and is generally used for field monitoring rather than for exploration.
Current OBC systems are also limited to water depths of 110 m, but a new system called SUMIC has extended the technique to 180m. Commercialised by Geco-Prakla following development by Statoil (Norway), SUMIC uses remotely operated vehicles (ROVs) to bury hydrophones and three-component geophones in the seafloor. The use of ROY s overcomes the depth limitation associated cable laying.
The advantages of the system include:
• the acquisition of shear waves (S-waves) through the use of multi-component geophones;
• the possibility of time-lapse 3D seismic surveys (also called 4D seismic).
Shear waves only respond to lithology and porosity whereas compression (P) waves are additionally sensitive to pore fluid. Comparing data from both sources can therefore reduce ambiguities in analysis. However, shear waves do not travel through water so they cannot be picked up by other survey techniques.
2.2 Land Seismic Data Acquisition
In terms of the total number of seismic traces acquired, only 25% of 3D seismic surveys are onshore. This low
percentage is explained by the relatively high cost of onshore acquisition. However, new land recording systems have greatly increased the number of
simultaneously generated traces that can be handled and different survey applications are now being considered. However, 3D onshore data acquisition is still mainly used in mature hydrocarbon provinces where it has an
important impact on drilling success.
Sources and geophones
The main source of acoustic energy for land surveys is vibroseis. Dynamite, which is an alternative, is now only used in rare cases where the ground does not allow good penetration of the vibroseis energy ..
The main problem with a vibroseis source is controlling the quality of the emitted signal. Two companies are currently looking at ways to improve this. CGG is examining a technique that compares the vibration emitted by each vibrator with a reference (pilot) signal. The differences between the signals are transmitted to the recording cabin for quality control. Geco-Prakla has developed a statistical approach (VEiW QC) where the performance of each vibrator is compared to others operating under similar conditions.
The most recent improvements in geophone technology have been the development of recording systems that can test geophones at each shot and the adaptation of geophone performance to 24-bit modem data acquisition systems. The distortion of the signal and self-generated noise have also been reduced. The American OYO Geospace geophone, GS-30CT, is probably the most widely used.
The acquisition of 3D seismic data often involves transporting heavy equipment across difficult terrain. Miniaturising equipment will be a key factor in raising the productivity of 3D land data acquisition to the level demanded by the oil industry. The solution will probably come through the transfer of technology from the
telecommunications or space industry, where progress has already been made in reducing the size of components.
Radio-frequency data telemetry
Improved technology in radio-frequency transceivers, band-width controls, tuneable frequencies and fast computers has contributed to the development of available telemetry systems. Cable systems offer faster data-transfer rates but radio-frequency surveys actually transfer more shots per hour per day because:
• the equipment can be set up faster (no cables);
• the central recording unit does not need to be moved to the string ends;
• down time is minimal (no need to test, trace faults, replace or repair, then re-test cables before each shot).
environmental or electrical barriers, but this limitation can be overcome by wirelinking remote acquisition units to a master unit outside the shadow. The remote units can then download data to the master unit, which then transmits them to the central recording station.
The modularity of these systems allows them to be adapted to specific surveying conditions, e.g. swamps.
The POLYSEIS system, supported by the THERMIE programme, illustrates the versatility of these systems. The system is now commercially available from Syntron under an IFP (French Petroleum Institute) licence. The three-channel remote transmission units are available for land or marine conditions.
Fig 4 POLYSEIS-Buoy set up
Data acquired by the remote units are transferred by telemetry or wirelink to a master unit, where they are either recorded on a portable recording system or transmitted to a central recording unit via fibre-optic cables or a microwave link. Automatic and
[image:13.577.24.257.263.414.2]comprehensive quality control circuits in the remote units test the quality of the data and the geophone spread (electronic test, filter, distortion, sensor pulse response, time break accuracy, channel noise, crossfeed, leakage, autocorrelation, string and stack tests). In addition, Sigma-Delta analogue-to-digital conversion and extensive use of DSP technology allow digital filtering and signal pre-processing functions to be carried out by the remote transmission unit.
Fig 5 Promotional operation of POLYSEIS in Louisianna
By using correction codes for transmission, the system is as reliable as one based on a cable.
Land information management systems
The integration of different tasks during 3D land data acquisition is a key factor for data quality. Integration can also reduce costs by improving tum-around time.
Integrated products for land information management such as Geoland and Olympus-IMS, produced by CGG and Geco-Prakla respectively, include:
• the design of the 30 survey using geographical information (topographic maps, satellite images, etc.);
• geometry control using navigation data;
• comparison between theoretical and actual layout, and therefore comparison between theoretical and surveyed coverage;
• management of observer reports.
All the existing packages model the acquisition process but do not, as yet, accurately model the source-earth-geophone system. (This observation is also valid for marine information management.) Further advances could be made by developing packages that model the effect of weather, topography and other obstacles on survey costs.
Recording systems
The recording systems for seismic surveys on land are
similar to those used offshore. However, the portability of equipment is a key factor on land because the cost of acquiring seismic data is greatly influenced by the topography of the survey site.
The mature producing areas of the USA have provided a
market for small, light and economical systems such as those supplied by Bison Instruments, OYO Geospace or EG&G. These companies now sell 24-bit recording systems that, together with high-frequency portable vibrators, can image structures down to 1700 m.
Positioning systems
GPS is used widely during seismic surveys on land. Using a portable system, an operator can acquire hundreds of positions a day that are accurate to within a few millimetres.
The Sercel system MANPACK D.G.P.S. uses a
differential GPS reference station and portable mobile units. The reference station permanently broadcasts GPS corrections to the mobile station and records GPS raw data for quality control and post-processing purposes. Real-time positioning can be performed via a central computing station. In particular, the vibroseis position can be acquired at the actual shotpoint position during sweep.
[image:13.577.25.257.634.799.2]12
use of digital orthomap (DOM) and geographic information systems (GIS). DOM are seamless mosaics of digital orthophotographs of the ground that provide a geodetically correct backdrop for use on either a GIS-equipped workstation or a light table. They are produced from either high-altitude photographs or satellite images, and are used to determine accurate visual co-ordinates for any fixed object on the ground, such as a seismic
shotpoint flag. DOM may be used to design a 3D seismic survey by loading them into land information
management systems. Surveying crews can also combine their use with hand-held GPS receivers for quality control.
Positioning system technology is now mature enough to provide the position of any given point in real-time. No major evolution is now expected.
Land-towed streamers
Land-towed geophone streamers are used for areas where usual acquisition devices are inefficient, e.g. ice or snow-covered ground, transition zones, etc.
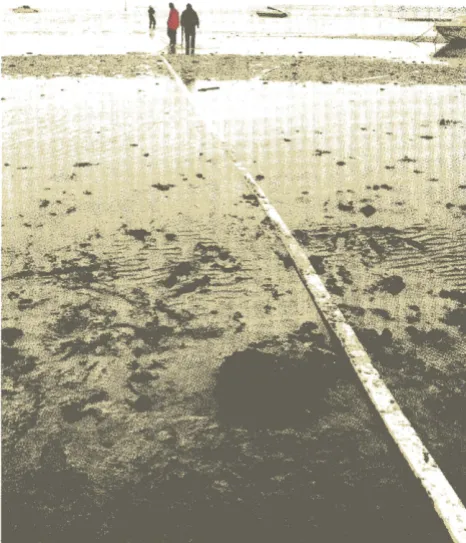
Fig 6 Using Seismaster over mud flats
An example is Seismaster, developed by Scientific Management Associates (UK). The system consists of a carrier (80 mm x 20 mm rectangular cross-section) incorporating tensile towing members, data wires, and digital-grade geophones. A typical configuration consists of 25 m, 50 m or 100 m interchangeable sections, providing 120 groups, 25 m group length, 12 geophones per group and a 3 km spread. The system weighs 1.5 kg/m, and all the components are enclosed in a watertight structure.
[image:14.577.322.555.117.276.2]Data quality is comparable to planted geophones in all but the severest wind conditions. The low friction carrier structure has registered towing loads as low as 250 kfg (equivalent) for a 3 km configuration towed at 15 km/h over snow.
Fig 7 Seismaster sections - flexibility aids transportation
There are plans to develop the system by incorporating a 24-bit digital telemetry system. A noise cancellation technique that will eliminate any susceptibility to wind noise is also being investigated.
2.3 Seismic Data Processing and Modelling
Hardware
The latest breakthrough in computer hardware has been the introduction of massively parallel computers that provide gigaflops of computing power ( 1 Gflop
=
109 floating point operations per second). This level of power is vital given that a 3D pre-stack depth migration requires at least 50 Gflops.Supercomputers have been increasing in power by approximately 70% per year, making a teraflop ( 1012
flops) computer conceivable. Such a computer would allow large 3D seismic surveys to be depth migrated before stacking at low cost. It may also be possible to compute the elastic solution of the wave equation, therefore allowing lithographic parameters to be assessed or fluid content to be detected.
In parallel with the increase of computer power, processing costs have fallen. The cost of a gigaflop reduced by a factor of ten between 1993 and 1995.
The development of powerful centralised computer systems has also run in parallel to the development of interactive workstations. It seems likely, therefore, that the future trend will be to concentrate computer power in a limited number of places (e.g. in a geophysical
contractor's building) and employ network
communication facilities to interpret, control and edit the results on remote interactive workstations.
[image:14.577.45.278.380.651.2]used by I/0 Systems) are the most common systems used in seismic processing.
To make the most of the available computing power, a high-level of 3D graphical capability has been developed. SGI workstations (Silicon Graphic) are the leaders in this market although other workstation providers such as Sun Microsystems, IBM, HP and DEC are beginning to enter this domain. In the next few years competition in this market should increase. Some geoscientists are also considering virtual reality as a tool to "dive" inside 3D blocks and interpret data within a virtual 3D world.
Software
Developments in software will be driven by:
• conventional processing being increasingly linked to acquisition;
• imaging and inversion being linked to interpretation.
In the past few years the main processing companies have developed interactive packages that allow better control of parameter choice as well as quality control of the computation results. These packages include Western Atlas' Omega SPS, CGG's GEOVECTEUR+, Cogniseis' FOCUS, and Advance's PROMAX. These interactive packages can all be used in batch mode to speed-up application with a large volume of data.
Conventional processing
Two main development areas have been recognised for conventional processing. First, even with interactive packages, a large amount of time is spent on routine work that is fundamental to the quality of results, e.g. trace editing and velocity field computation. New methods such as neural networks or artificial intelligence could be adapted to reduce processing tum-around time and to improve quality through better coherence of the results.
Second, the problem of energy multiples must be addressed. Approximately 90% of energy multiples are currently removed from the data, but the remaining 10%
can dramatically affect the interpretation of key reflectors, e.g. the Base Cretaceous Unconformity in North Sea prospects.
Interactive methods make it easy to perform complex processing sequences and to check results. However, it is also very easy to make errors and to spend a lot of time finding the appropriate set of processing parameters. Consequently there is a need to develop quality control methods for the processing sequence that can be integrated with the interactive processing package.
CGG is aiming to demonstrate improved accuracy in 3D seismic processing through a project supported by THERMIE. A prototype of a 3D seismic imaging system has been developed that incorporates:
• mathematically precise computer algorithms for processing surface-detected seismic data;
• fast computers that can economically process the immense volume of data involved;
• an accurate macro-velocity model of the earth's sub-surface to ensure a meaningful and precise 3D image.
As part of the project, CGG has developed migration processing algorithms (pre-and post-stack) that will be executed on a massively parallel computer. In addition, the project will weave together several branches of recently developed seismic inversion technology to form a self-contained software library. This software will run on a super-fast 3D graphic workstation and provide a way of elaborating and validating a macro-velocity model of the sub-surface.
Depth imaging
For the past three or four years, processing companies have focused their attention on very sophisticated depth migration algorithms.
CGG has developed three products, TOMCAD, RSMIG, and KIMIG for travel time inversion, post-stack and pre-stack depth migration respectively. Geco-Prakla has developed VIVID for 3D post-stack and pre-stack depth migration, 3D velocity model building, and 3D post-stack turning wave migration. Within the processing package Omega SPS, Western Atlas has developed the Shared Earth Concept which allows better integration of the data needed for the 3D depth migration. Shared Earth has been widely used for sub-salt imaging in the Gulf of Mexico.
All these depth migration software packages combine building a 3D earth model with pre-or post-stack depth migration. However, these two tasks do not use the same type of computer. Building an earth model requires a 3D visualisation workstation, e.g. a Silicon Graphics workstation. Depth migration needs a super computer, e.g. a CM5 from Thinking Machine or a Cray T3D parallel processor.
As the power of computers increases and the main migration algorithm problems are solved, the main limitation on the method will be the efficiency of the 3D velocity model building. This step, which could be the most time-consuming part of a depth transformation, requires a high degree of integration between processing and interpretation experts. This integration should be taken into account at the software level by using interoperability between the 3D modelling software and the migration package. For 3D modelling, CGG uses GOCAD software developed at the University of Nancy, while Geco-Prakla has developed KUDOS.
14
interpreters (building velocity models on 3D visualisation workstations to control the migration). This organisation will require the exchange of digital information through an efficient and possibly international network.
Independent software companies have also developed tools for depth imaging.
GX Technology (UK) has produced a product that includes two-dimensional earth modelling by ray tracing methods (GX II) and a three-dimensional system for model building, model visualisation and ray tracing (3D-AIMS). With support from THERMIE, the company has also developed SIRIUS, a two-dimensional velocity model for pre-stack depth migration. This package includes TOMOPACK, a pre-stack travel time picking and tomographic inversion package, and KIRKPACK, a Kirchhoff pre-stack depth migration toolkit. Currently there are 20 licenses installed in Europe, distributed between oil companies and seismic service companies. The 2D version is now being extended into 3D.
SP ,
[image:16.575.41.267.344.500.2]"'' SP
Fig 8 Output from SIRIUS
Paradigm Geophysical (USA) has developed a package called GeoDepth that includes:
• modelling of complex structures;
• estimation of interval velocities from common depth point (CDP) gathers by ray-tracing methods allowing non-hyperbolic moveout;
• Kirchhoff pre-stack depth migration.
At present this software is only marketed for 2D migration.
Software that was a precursor for interactive ray-tracing was developed by Sierra Geophysics. Now marketed and developed by Western Atlas, it includes 3D velocity modelling, curved and turning ray-tracing, and map migration.
Applied Geophysical Software specialises in sub-salt imaging (mainly for the Gulf of Mexico). A 3D pre-stack depth migration, 3-D INVERSEIS, can run on clustered, multi-CPU workstations thereby avoiding the need for expensive supercomputers.
All these depth migration methods have been developed to image structurally complex areas such as sub-salt zones. According to oil companies operating in the North Sea, only 10% of surveys require this type of processing, and a major improvement in turn-around time and cost would be needed to encourage wider use.
Reservoir description
Geophysical contractors and software companies both promote products for reservoir characterisation to enable lithological and fluid content to be predicted. The important parameter is the amplitude of the seismic signal. This can be analysed in two ways:
• before stack with the amplitude versus offset (AVO) technique;
• after stack with the stratigraphic inversion method.
Amplitude versus offset (AVO)
AVO is designed to extract information from the variation of reflectivity with respect to the angle of incidence of seismic rays. This variation may be associated with the lithology of the reservoir but more often is associated with the fluid content. Pre-stack processing is a key step in AVO analysis because the traces must be corrected for any factor that affects the amplitude. Only the relative amplitude variation related to an earth reflectivity variation must remain in the CDP gathers.
CGG uses the GEOVECTEUR+ processing package modules to compute a surface-consistent amplitude correction for deconvolution. Western Atlas and Geco-Prakla have developed their own algorithms to process preserved amplitude seismic data. Hampson-Russell, an independent Canadian company, has developed an AVO program that includes tools ranging from
gradient/intercept stacks through to modelling full inversion. This package also includes some pre-stack processing methods to enhance the quality of CDP gathers. These packages only work in two dimensions, accounting for amplitude variations in the vertical plane.
With 3D seismic data there is a problem with the angle of incidence. In addition, the direction of ray paths should be considered to correct the amplitude. Moreover, the relationship between amplitude variation and azimuth of incidence is not really understood in three dimensions. Phenomena such as anisotropy also influence the seismic amplitudes. Further work is therefore required before 3D AVO will be considered as an industrial method.
Stratigraphic inversion
The purpose of stratigraphic inversion software is to extract the acoustic impedance earth model from the seismic signal, i.e. to remove the wavelet that results from propagation of the source signal. The software also removes noise from the data. As with AVO, the
Three-dimensional post-stack inversion software is available from various companies:
• STRATA, produced by Hampson-Russell, is used for two-and three-dimensional inversion -three inversion algorithms are available: stochastic, constrained, and bandli mi ted.
• 3D-ROV, produced by CGG, is a three-dimensional
multi-channel inversion that works with a global search optimisation technique using simulated annealing. This module is included in the GEOVECTEUR + processing environment.
• DELSI, developed by TNO (The Netherlands) with
support from the THERMIE programme, is a state of the art software package for seismic inversion incorporating: surface related multiple elimination; controlled illumination of target zones; and stratigraphic inversion.
• Jason (The Netherlands) has developed INTEGRATE for a three-dimensional block inversion.
• SLIM is Western Geophysical's post-stack inversion software.
• INTERWELL 3D, proposed by Beicip-Franlab
(France) and Petrosystems (a subsidiary of CGG), extracts the wavelet from well log information and seismic data, then uses direct modelling to include the structural and stratigraphic knowledge of the area and carry out the inversion of the data cube using a multi-trace algorithm.
II
(
,\ \(
ll
Fig 9 DELSI: a state of the art software package for seismic inversion
At present, three-dimensional inversion packages operate by adjusting single-or two-dimensional information, although fully three-dimensional inversion algorithms will be available soon. The acoustic impedance section obtained after a post-stack inversion does not fully explain the variations of lithological or petrophysical parameters in the reservoir, and must therefore be correlated and calibrated with well log data.
2.4 Seismic Interpretation
Seismic interpretation is the cornerstone of an overall view that integrates geological, geophysical and reservoir engineering data. Its objective is to extract subtle structural features and stratigraphic elements from the data.
Tracking a geological horizon in a 3D seismic dataset can involve a large number of seismic traces. Automatic tracking techniques are therefore invaluable. The major
interpretation companies have developed methods based
on the correlation of traces to propagate interpretation from reference lines throughout the 3D cube. US company, Landmark has developed ZAPIII for fast and accurate determination of the surface horizons.
Petrosystems with its INTEGRAL+ interpretation workstation and Geoquest with the ASAP autotracker have proposed similar software.
An efficient method of controlling automatic picking is to display a three-dimensional view of the data and tracked horizons, for example using Landmark's 3DVI,
Geoquest's 3dvue, or Petrosystems' 3D Viewing.
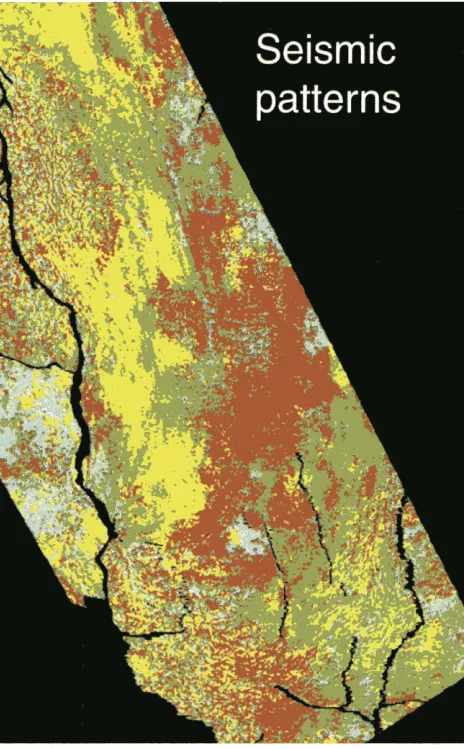
The exact position of faults and the evaluation of cross-fault leakage are critical parameters for accurate reservoir description and the placement of producing and injector wells. Fault patterns can be identified by analysing horizon attribute maps (azimuth, dip, edge, difference), and all the three-dimensional seismic interpretation
Fig 10 Seismic patterns from dGB-GDI package
[image:17.575.298.530.433.808.2] [image:17.575.24.254.470.678.2]packages offer these functions. These maps can also be enhanced by image processing packages, such as ER MAPPER, to allow detection of subtle structural events. For example, image processing can enable faults with a vertical throw smaller than the time sampling to be interpreted.
If a fault pattern is identified solely from geometrical characteristics of the auto-tracked surface, automatic correlation of fault segments interpreted on the seismic sections or time-slices is not currently possible. Building a three-dimensional fault pattern, including the exact position of the fault plane (rather than just the fault traces on a surface as determined by horizon map attributes) then becomes an arduous process. Methods involving neural networks, artificial intelligence or image processing could solve this problem.
In a THERMIE-funded project, de Groot-Bril Earth Sciences BV of the Netherlands is implementing and testing a ready-to-use software system using neural networks. The dGB-GDI package is a set of object-oriented software modules that integrate, analyse and quantify geoscience information.
Data and knowledge in dGB-GDI are combined at different levels according to a stratigraphic ordering system. Actual (stratigraphic) and simulated (log) well data are linked to
16 Fig 11 Lateral prediction from dGB-GDI package
seismic traces in this way, and the integrated dataset can then be studied at the natural (stratigraphic) level. Tools are available for extracting information from wells and seismic data. The resulting "feature sets" can be visually inspected for cross-correlations. Non-linear relationships are established with the use of artificial neural networks.
French oil company, ELF, has developed an in-house 3D interpretation package, SISMAGE, which is based on automatic 3D horizon tracking using image processing methods. Unlike many automatic picking systems, SISMAGE is essentially amplitude independent and is actually guided by the character of the seismic event.
The volume-based interpretation techniques that are now emerging because of improved visualisation tools allow interpreters to view and interpret the data in three dimensions. However, better integration of geophysical, geological and reservoir engineering data is still required.
The search for deep oil and gas reservoirs is making increasing demands on seismic technologies. Preferably seismic surveys will not only investigate geological structures, but also provide information on lithology, pore content and lateral facies variations. In the LITASEIS project funded by THERMIE, the German company DGMK is developing and testing methods for the lithological interpretation of seismic data to help in the search for deep gas reservoirs in Europe (5,000 - 6,000m). The project is developing an integrated comprehensive concept for seismic lithological investigation that comprises the following innovative approaches:
• adverse effects of near-surface layers (soft layers) on the amplitude and frequency content of seismic signals;
• adverse effects of processing on amplitude and phase;
• correlation and calibration of reflection seismic data with borehole seismograms;
lithological interpretation of seismic lithoparameters.
2.5 Well Seismic Data Acquisition
Vertical Seismic Profiles (VSPs) are widely used to calibrate seismic data recorded on the surface with geological well information. Time-depth relationships as well as corridor stacks, generally allow a good calibration of geophysical and geological data. To extend the lateral coverage of seismic data around the well, offset VSP and walkaway acquisition have been developed.
The increasing use of seismic reservoir methods and the need for a better understanding of reservoir bodies and fluid content have focused research on specific seismic techniques for wells.
Shear wave data acquisition
The measurement of compression (P) and shear (S) waves is of considerable value for:
[image:18.575.46.282.406.804.2]velocity and estimation of reflectivity for the well to achieve seismic calibration;
• mechanical property analyses such as wellbore stability, perforation stability, sanding and hydraulic fracture;
• formation evaluation, e.g. fracture detection using the S-waves bi-refringence, permeability characterisation from Stoneley wave analysis, gas detection by calculating the Poisson's ratio.
Cross borehole seismology
Acquiring seismic data from boreholes at reservoir depth may resolve the "wavelength gap" that exists between 3D seismic data (normal wavelengths of 20 - 100 m) and well logs (wavelengths of 0.3 - 1 m). Typical
wavelengths for high-frequency cross-borehole data are 2 - 5 m. Cross-borehole tomography surveys involve recording data from receivers in one borehole that are related to a set of seismic sources in another borehole. Typical borehole source and receiver spacing are 3 m, while well separations are often 100 - 300 m.
A THERMIE project being carried out by Schlumberger (France) is examining high-resolution seismic techniques for boreholes, and is dedicated to hydrocarbon reservoir description. The project has five phases:
• additional calibration of the site using logs, VSP, and offset VSP analysis;
• acquisition, processing and inversion of a P-wave tomography with particular analysis of the possible anisotropy of the layers;
• acquisition and processing of a shear-wave reflection using a drop source developed in THERMIE "Borehole Source" project;
• recording and processing of cross-well data using a non-axisymetrical source;
• synthesis of all the previous experiments and evaluation of the accuracy for reservoir description.
The main problem for this type of data acquisition is preserving the borehole. Non-destructive sources include piezoelectrical ceramic material that converts varying electrical potential into mechanical vibrations. The seismic signals generated with these sources are in the 400 - 2000 Hz range, creating seismic energy that is an order of magnitude smaller than for the surface seismic surveys.
A solution is to spread the energy over time with a swept-frequency source, and to correlate the recorded signal with the input source sweep, as for vibroseis. Further work on non-destructive borehole seismic sources will be needed before they are fully accepted by the industry.
Apart from the seismic source there are two other limitations on the cross-borehole technique:
• the difficulties associated with having two open wells on a producing field;
• the results are generally not adequate to justify the effort needed to set up the acquisition.
Work is being undertaken in Europe to improve both the method (particularly for reservoir engineering) and the understanding of the obtained results.
The most important improvement expected in the near future is the development of higher frequency signals for better vertical resolution of seismic data. With assistance from JOULE-THERMIE, the French organisations CGG and IFP are collaborating on a project called SHOW (Seismic imaging in HOrizontal or highly deviated Wells).
Well D
100m
1----+---il
Fig 12 Lodeve test site for SHOW: well D in the deviation plane
[image:19.576.303.530.189.558.2]18
Fig 13 SHOW: wells B, C, D with sonic logs
Seismic while drilling
The use of drilling noise as a seismic source is currently being investigated. A future objective is real-time processing of the data to obtain a seismic image of the sub-surface during drilling.
GEOBIT, a THERMIE project undertaken by OGS and AGIP of Italy, recently in co-operation with Prosol Technology (UK), uses the drilling bit as a seismic source in order to predict the lithology ahead of the bit by producing reciprocal VSPs and tomographic images. This technology, renamed SEISBIT, is shown in Fig 14.
Fig 14 Layout of the SElSBJT acquisition and pre-processing system
Reciprocal VSPs are obtained, using an automated acquisition system, by correlating a time-corrected reference (pilot) signal with conventional surface seismic traces measured near the well. In this procedure the time-continuous drillbit signal is collapsed into an impulsive one, and the signal-to-noise ratio is enhanced by reference signal deconvolution. The method successfully provided real-time geophysical information while drilling (seismic data are immediately transmitted day by day to the remote offices), when using roller-cone and also PDC bits.
2.6 Potential Methods
In parallel with advances in 3D technology, non-seismic methods have also evolved. Non-seismic data are sometimes acquired in conjunction with a 30 seismic
Fig 15 Examples of walkway SWD VSP
survey because they are independent of geophysical properties and can be used to verify, refine or constrain a three-dimensional velocity model. Efforts are being made to integrate information from these methods with seismic data to improve interpretation.
Other methods, such as electromagnetics, are currently being investigated and funded by THERMIE support. The German company Metronix is integrating both passive and active electromagnetic methods to provide optimum geological information. The Integrated Electromagnetic Exploration Method (IEEM) is highly mobile and can be used more readily than seismic
surveys in areas where access is difficult (Fig 16).
Fig 16 Multi channel receiver for passive EM
Edinburgh University in the UK has THERMIE support to carry out two multi-channel transient electromagnetic surveys over an underground gas storage reservoir in France.
[image:20.576.317.550.43.209.2] [image:20.576.55.251.50.201.2] [image:20.576.43.277.400.575.2] [image:20.576.320.552.424.597.2]data sets reflects the difference in the electrical resistance of the reservoir as the gas-water contact moved between the two surveys, the resistivity of the gas-saturated rock being twenty times that of the water-saturated rock. Algorithms to map these changes have been developed. The method may be applied to monitor production in oil fields and locate by-passed oil. Spurious electromagnetic fields introduced by the network of pipes on the surface and underground are identical for duplicate surveys and are eliminated by differencing successive data sets.
Fig 17 Anticlinal structure of filed site showing wells used for injection. production and monitoring of gas in the reservoir. (After Gaz de France Illustration)
Fig 18 TEAMEX receiver unit
3. GEOLOGY
3.1 General
The most significant evolution in geology has been the integration of information from other disciplines. This has enhanced the global understanding of the petroleum potential of the sub-surface. In addition, a number of specific techniques have been improved or developed, particularly in terms of interpretation and modelling.
Improved knowledge in the field of sedimentary geology has mainly been related to high-resolution sequential stratigraphy and the modelling of depositional styles. Understanding the structural geology of complex tectonic environments has also advanced, and several software packages are now available.
Geostatistical methods have played a major role in better reservoir characterisation and the determination of reservoir properties, architecture and possible fluid content.
3.2 Acquisition
Remote sensing applications
Satellite images collected in the visible, infra-red and radar spectra are currently available for most areas of the Earth. The availability of this data combined with advances in interpretation has increased the use of remotely sensed data by oil companies, and the technique is now widely recognised as a cost-effective exploration tool for applications from regional basin evaluation to environmental assessment. Remotely sensed data also have applications in downstream operations such as pipeline planning and monitoring competitors' activities. However, oil companies prefer to buy-in data rather than invest in internal development because the technique still appears to be technology-driven and rapidly evolving.
The first European SPOT satellites were launched in 1986. These satellites have a high resolution ( 10 m in panchromatic mode, 20m in three-band multi-spectral mode) and can provide stereo pairs that improve visual interpretation. They can also be used to obtain Digital Elevation Models. More recent ERS satellites ( 1991) from the European Space Agency can collect images through cloud cover and at night because they are equipped with radar instruments (20 m resolution with the SAR mode). Methodology and use of these radar data
have been developed and some petroleum exploration
applications are now available.
UK company, Nigel Press Associates now offers offshore basin screening to detect natural hydrocarbon seepage and map geological structures. This technique was developed in a project sponsored by the UK Government.
[image:21.575.25.258.183.476.2] [image:21.575.24.259.518.803.2]20
Fig 19 Digital Elevation Model from SPOT stereo data
help to diversify the use of remote sensing by developing thematic documents and specific interpretation methods that are mainly workstation oriented.
Borehole imaging
A direct image of the borehole provided by core samples, photographs and logging techniques gives a good indication of the architecture of the sedimentary section. Micro-resistivity tools are now used to collect detailed reservoir descriptions particularly needed for horizontal well sections. These tools can assist in fracture analyses and interpretation, determination of effective vertical permeabilities, and correlation of neighbouring wells to orient sand bodies.
3.3 Interpretation and Modelling
Log interpretation software
Log interpretation software is generally linked to logging tools. Consequently, the main software packages have been developed by the major well logging companies. Apart from general modifications in software, increased integration in the geological/geophysical database, and adaptation to POSC standards (see Section 5.1), one specific development can be noted.
New algorithms for handling uncertainties are currently being developed to take better account of certain mineral effects and to improve identification of facies. In Europe, a project called LAGUNA (Log Analysis by a Global Uncertainty Algorithm), is being developed in a partnership between ERC-Tigress Ltd and Petrosystems.
Sedimentary geology
Sedimentary geology has evolved in recent years with the development of quantitative and numerical modelling. Depositional styles have been identified and described from outcrop studies and these stratigraphic models can be used to help interpretation when geological data are limited.
In Europe, an outcrop database for reservoir
characterisation has been developed with support from the THERMIE programme. This system allows any interested party to have easy access to outcrop data that have been checked for completeness and quality, and stored in a standard format.
[image:22.575.47.549.45.455.2]PRE-RESTORATION
Fig 20 D ove
Forward tratigraphic mod 1 are cun-ently used to
provide a unique response to the tratigraphic parameters, but inverse tratigraphic models are under development.
High-r olution equence tratigraphy ha develop d
through the integrated workstation approach that combines data from variou eli cipline (e.g.
biostratigraphy, sedimentology, petrography, litho ei m1c,
e1 mi tratigraphy). Basic tratigraphic rules ar now
better under tood, and geological analy i and forecasting ha e greatly improved.
Structural Geology
The main breakthrough in tructural geology i th
d velopment of oftware to re tore full 3D model and
not ju t 2D eros -sections through the tructure. R tored "D models are 1 inematic models of structural evolution that te t the geometrical cob renee of geological
int rpretation. In a THERMJE project, Midland Vall y of
the UK ha de eloped interactive oftware that te 't thr e-climen ional geological interpretation by equential re toration. Restoring pre ent-day interpreted geological
tructure to it initial undeformed state allow the validity
of the interpretation to be te ted and the geohi tory of
tructural development to b analysed in detail.
Such oftware is particularly useful for comple
tectonic . Ho e er, there ult need to be chec eel with:
• fi lei e amples and analogue models;
• fault and fracture modelling;
• a geomechanical foreca t: of the fracturing stage of the
lithological series produced by reconstructing th
u ce i e tectonic stres related to the deformation
fi lei during the geological evolution.
Lithol gicaJ heterogeneitie al o have to be taken into
account (e.g. fault geometrie , different lithological
Lack of perfect restoration due to inaccuracies in interpretation, algorithm used or parameters chosen
POST -RESTORATION
trata, interstitial fluid ). Fracture modelling ha b n
clev loped to integrate field and ub-surface data and to
provide a three-dimen ional fracture model based on
geostatistics that can be used for reservoir engineering. In
Europ , software for thi puq ose include F I S 2,
clev loped b Badle Earth ciences ( K) and JFP'
FR CR SS 3D.
Fig 21 FAPS 2-example or stratigraphic juxtapositions acros a fault
with fault-seal potential coded in colour
Reservoir characterisation for prospect evaluation
The r ervoir geologist is often asked to provide a model of th geology between well where data i lacking,
perhap becau e the pacing of w 11 data i too larg or
sei mic re olution is too low. Thi model may repre nt the distribution of genetic b die (channels, flood plain
hal , etc.), within which petrophysical variations can
later be distributed.
Tw t of data are u fuJ to characterise reservoir heterogeneitie .
• Tw -and three-dimensional ei mic data allo
g ophysici ts to obtain the patial eli tribution of
22
Fig 22 HERESlM 3D
• Well data (which usually have good vertical definition) can be combined with geostatistical concepts to obtain
three-dimensional images of the spatial distribution of heterogeneities between wells inside the reservoir.
The geostatistical approach aJlows various hig
h-resolution images of the distribution of reservoir heterogeneities. Changes from one possible image to another are a measure of the uncertainty affecting the heterogeneity description between the wells. There is a clear trend in the oil industry towards the development of such approaches, but at present two main geostatistical
techniques are available: variogram or object based.
Variogram-based simulation characterises both the external geometry of the litho-units and the internal
spatial distribution of sedimentary bodies and
petrophysical properties, e.g. porosity and permeability.
HERESIM 3D, developed by the French organisation
Beicip-Franlab with THERMIE funding, offers two original
and efficient geostatistical tools that are simple and
powerful: proportion curves and variograms. These tools make it easy to identify the main sequential and lateral trends of sedimentary bodies, and guarantee maximum
realism of the simulations. HERESIM 3D provides a fast
sequence-based algorithm (truncated Gaussian model) to generate possible images of the unknown areas between
wells. The simulated images are immediately exploitable by reservoir engineers in a tluid tlow simulator. These images are a way to facilitate communication between geologists and reservoir engineers.
Object-based techniques (deterministic algorithms) are applied to reservoirs where isolated sand bodies are
distributed within a shaly background. Each sand body is
modelled as a single object (fluvial channel, Crevasse
Splay, point bar, etc.) by simple geometry. The width of these bodies is extrapolated from their thickness using width-thickness relationships derived from outcrop
studies or from experience with similar fields.
Variogram-based modelling algorithms are fast and flexible, whereas object-based algorithms have difficulties
in honouring the well data in a satisfactory manner. However, several width-thickness relationships have been developed for various depositional environments, whereas
very few variogram models are available. The future trend
will be to reconcile reservoir and basin scales. In theory it
should be possible to obtain a reservoir model by enlarging a zone from the basin model. Such an approach
could be possible in the not-too-distant future.
4. GEOCHEMISTRY
4.1 General
Geochemistry is now acknowledged as a major exploration tool. Important breakthroughs have been achieved in basin modelling and more detailed models are becoming available, particularly in three-dimensional description and
compositional determination of hydrocarbons.
[image:24.575.44.530.47.434.2]