A STUDY ON COST-BENEFIT
by
Elpidio L. Yalong, B.S. in Agriculture
A dissertation submitted in partial fulfilment of the requirements for the degree of Master of Agricultural Development Economics in the
Australian National University
D E C L A R A T I O N
Except where otherwise indicated, this dissertation is my own work,
(iii)
A C K N O W L E D G E M E N T S
I would most sincerely like to thank the many people without whose help this study would not have been completed. In particular, I am most grateful to my supervisor, Dr R. Mauldon, for his invaluable advice and comments at every stage of the study. Despite an enormous work load,
Dr Mauldon has always been most generous in giving his time and assistance. I am also indebted to Dr Barlow and Dr D. Etherington, both
professorial staff of the M.A.D.E. Programme, for their help, encourage-ment, and understanding during the duration of the course. Mr M. W. Ray, Mrs G. Robbins, Mrs A. Sandilands, and others in the Computer Centre were always helpful in assisting me with my computer programme. Mr Bruce Carrad also gave valuable help in various ways.
I also wish to express my thanks to the Australian Government's Colombo Plan Scholarship scheme; to the Australian Development Assistance Agency (ADAA); and to the Board of Governors of the Board of Investments, more especially to Governor Caesar Z. Lanuza, for granting me permission
to attend this course. I am also thankful to Director Ramona P. Miguel and Mr Jovencio C. Avila for recommending me to this course, and to Director Alejandro R. Apacible (retired) for the help he has given me. Likewise, I would like to express my gratitude to the members of the staff of the Livestock and Fishing Section and of the Crop Production Section of the Board of Investments for continuously supplying me with the necessary statistical data for this study.
Finally, I am grateful to my wife and son for their unfailing love, patience and encouragement.
A B S T R A C T
This study evaluates the profitability of a piggery contract growing agreement in the Philippines. The assessments are made from the owner's, growers', and social viewpoints.
Chapter 1 contains a statement of the problems of development efforts; of the objectives, significance and limitations of the study, and of the sources of data. Chapter 2 includes a discussion of the swine industry and a piggery contract growing agreement in the Philippines. This chapter covers the problems and status of the swine industry and also some market-ing practices. The chapter also highlights some provisions in the contract, including its advantages and disadvantages from the owners' and growers' viewpoints.
Chapter 3 sets out the analytical framework. Tliis involves a dis-cussion of cost-benefit analysis, sensitivity analysis, and evaluation criteria. Investment criteria, choices of discount rate, and the derivation of the cash flow are also discussed in the chapter. The investment criteria used are the internal rate of return, net present value, benefit to cost ratio, net present value to investment ratio, and average yearly present value of net benefits. The first four criteria are used in ranking the project from the owner's and social viewpoints. All five criteria are used in assessing the profitability of the project
from the growers' viewpoint, with emphasis given to the last criterion (i.e., average yearly present value of net benefits).
(v) of pigs owned to growers (100 per cent scheme). The cash flows for each of these schemes are p r e s e n t e d . For the growers, the cash flow for raising 100 pigs is presented.
Chapter 5 involves the adjustments of the costs to reflect the value of the piggery contract growing schemes to society. Some of the cost components are shadow priced to reflect their relative scarcities and some of them are treated as transfer costs. Decomposition and adjust-ment of capital outlay and current cost items into unskilled labor,
foreign e x c h a n g e , and taxes are also discussed in the chapter. No adjust-ment is made to the benefits.
The economic appraisal is undertaken in Chapter 6 . This involves the presentation and discussion of the results obtained and the conclusions and recommendations based upon them. The cost-benefit analyses reveal the following:
(1) that the 60 per cent and 100 per cent contract growing schemes are more remunerative to the owner than no contracting;
(2) that the 0 per cent, 60 per cent and 100 per cent schemes are highly profitable socially as proven by internal rate of return of more than 30 per cent. The 60 per cent and 100 per cent schemes are more remuner-ative than no contract growing;
(3) that the growers earn an average yearly present value of net benefits of about P2,700 (P500 more than the minimum wage of P2,200) raising 100 pigs at a time. On the other h a n d , the sensitivity analyses show that:
schemes, however, are affected by reducing the number of pigs per grower. For 25 or 50 pigs per grower, the 60 per cent scheme was most remunerative, followed by the 0 per cent and then by the 100 per cent schemes.
Assumptions of a 10 per cent reduction on the prices of pigs or a 10 per cent increase on the prices of feeds prove to be disastrous to the owner. These sets of assumptions fail to pass any of the adopted investment criteria.
(2) From the social viewpoint, the order of results achieved is not greatly dependent on the assumptions made about the social opportunity costs of unskilled labour, exchange rate, and capital. The assumption made about the number of pigs per grower does not greatly affect the order of
results regarding social returns to capital, but does greatly affect the order of results regarding employment. (3) For the growers, assumptions of 1 per cent more
mortality than allowed, or a change of the opportunity cost of capital by plus or minus three percentage points, are still more remunerative than being labourers. Assumptions of 2 per cent more mortality than allowed, or a penalty for underweight pigs, or raising 25 or 50 pigs at a time, prove to be less remunerative.
Based on the results obtained, several measures may be suggested in order to encourage piggery contract growing in the Philippines:
(vii) (2) veterinarians from the Philippine Bureau of Animal
Industry to provide professional services free of charge to the scheme;
(3) a change in the basis for providing credit; (4) creation of an insurance market for the scheme.
These measures would not be costless, but in view of the high potential social returns to piggery contract growing, they may be
justi-fied. However, they would require a cost-benefit study in their own right.
Some Important Notes on the Study
(1) On May 24, 1976, $A1.00 is equivalent to P9.63, or PI.00 is equivalent to $A0.104.
(2) The Board of Investments (BOI) is a government admini-strative body created by a legislative act (Republic Act No. 5186) primarily to encourage both local and foreign investment. A package of incentives - mostly in the form of tax deductions - has been offered to investors in both pioneer and non-pioneer preferred projects.
(3) The Investment Priorities Plan (IPP), as prepared by BQl and approved by the President of the Philippines, delineated the various industries which were given
(4) Assessment of the piggery contract growing agreement is based solely on a "flat fee" scheme. However, a full assessment of contract growing arrangements would also
C O N T E N T S
(ix)
ACKNOWLEDGEMENTS ABSTRACT
LIST OF TABLES LIST OF FIGURES
* * * * *
Chapter
1 INTRODUCTION
1.1 Statement of the Problems 1.2 Objectives of the Study
1.3 Significance and Limitations of the Study 1.4 Sources of Data
2 THE SWINE INDUSTRY AND PIGGERY CONTRACT GROWING AGREEMENT IN THE PHILIPPINES
2.1 The Philippines Swine Industry 2.1.1 Problems of the Industry 2.1.2 Status of the Industry 2.1.3 Marketing Practices
2.2 The Piggery Contract Growing Agreement 2.2.1 Highlights of the Contract
2.2.2 Pros and Cons of Contract Growing
3 THE ANALYTICAL FRAMEWORK AND METHODOLOGY 3.1 Cost-Benefit Analysis
3.2 Sensitivity Analysis 3.3 Evaluation Criteria
Page
(iii) (iv) (xi) (xiv)
1 1 13 15 16
17 18 18 22 28 33 33 34
C o n t e n t s ( c o n t i n u e d ) C h a p t e r
h
B E N E F I T S A N D C O S T S OF P R O D U C T I O N : T H E O W N E R ' S A N D G R O W E R ' S V I E W P O I N T S4 . 1 T h e O w n e r ' s C a s h F l o w s 4.2 T h e G r o w e r ' s C a s h F l o w
B E N E F I T S A N D C O S T S OF P R O D U C T I O N : T H E S O C I A L V I E W P O I N T
5 . 1 S h a d o w - P r i c i n g B e n e f i t s and C o s t s 5.2 D e c o m p o s i t i o n a n d A d j u s t m e n t of
E x p e n d i t u r e I t e m s ..
5 . 3 F l o w s of S o c i a l B e n e f i t s a n d C o s t s
T H E E C O N O M I C A P P R A I S A L 6 . 1 P r i v a t e V i e w p o i n t s
6 . 1 . 1 S e n s i t i v i t y A n a l y s i s 6.2 S o c i a l V i e w p o i n t
6 . 2 . 1 S e n s i t i v i t y A n a l y s i s 6 . 3 E x t e r n a l i t i e s
6.4 C o n c l u s i o n s a n d R e c o m m e n d a t i o n s
P a g e
48 48 60 67 68 72 75 80 81 82 90 9 1 96 9 8 * * * * *
B I B L I O G R A P H Y 100
* * * * *
A P P E N D I X A : A P P E N D I X B : A P P E N D I X C : A P P E N D I X D : A P P E N D I X E : A P P E N D I X F :
D A T A U S E D IN T H E P R I V A T E I N V E S T O R S ' V I E W P O I N T S D A T A U S E D IN T H E S O C I A L V I E W P O I N T
C O M P U T E R P R O G R A M A N D T H E R E S U L T S OF T H E A N A L Y S I S A C O P Y O F T H E H O G C O N T R A C T G R O W I N G A G R E E M E N T L I S T OF B O I R E G I S T E R E D P I G G E R Y P R O J E C T S
L I S T OF I N C E N T I V E S T O R E G I S T E R E D E N T E R P R I S E S U N D E R R . A . 5 1 8 6
(xi)
L I S T O F T A B L E S
Table Title Page 1.1 Typical Food Items and Average Consumption in U.S.,
Japan and the Philippines 2 1.2 Population of the Philippines, Average Annual Rate
of Increase, and Density of the Population: Census Years 1903-1970
1.3 Labour Force, Participation Rate, Employment Status,
and Growth Rates in the Philippines, 1960-1972 .. 8 1.4 Percentage Distribution of Employed Persons by Major
Industry Groups in the Philippines, 1960-1972 .. 9 1.5 Growth Rates of Employed Persons by Major Industry
Groups in the Philippines, 1960-1972 10 1.6 Part-time Workers in the Philippines by Number of
Hours Rendered per Week, 1972 11 2.1 Historical Supply of Pork in the Philippines,
1968-1972 22 2.2 Average Wholesale Price of Hogs in Different Regions
of the Philippines, 1969-1975 24 2.3 Average Wholesale Price of Pork in Different Regions
of the Philippines, 1969-1975 25 2.4 Price of Hog Feeds in the Philippines, 1969-1975 .. 26
2.5 Rates of Transport for Hog from Different Sources to
Manila 31
56 57 58 59 4.1 Projected Hog Population - Owner's Viewpoint
4.2 Total Investment - Owner's Viewpoint
4.3 Projected Sales Value - Owner's Viewpoint 4.4 Projected Feeds Cost - Owner's Viewpoint
4.5 Cash Flow Projection - 0% Scheme - Owner's Viewpoint 61 4.6 Cash Flow Projection - 60% Scheme - Owner's Viewpoint 62 4.7 Cash Flow Projection - 100% Scheme - Owner's Viewpoint 63 <^4.8 Cash Flow Projection - 100 Pigs - Grower's Viewpoint 64
List of Tables (continued)
Table Title Page 5.2 Projected Social Feeds Cost
5.4 Flows of Benefits and Costs - 60% Scheme - Social Viewpoint
5.5 Flows of Benefits and Costs - 100% Scheme - Social Viewpoint
6.1 Summary of Benefit-Cost Analysis: Private Viewpoints 6.2 Sensitivity Analysis: Owner's Viewpoint
6.3 Sensitivity Analysis: Grower's Viewpoint
6.4 Summary of Benefit-Cost Analysis: Social Viewpoint 6.5 Sensitivity Analysis: Social Viewpoint
* * * * *
67 5.3 Flows of Benefits and Costs - 0% Scheme - Social
Viewpoint ^^
78
79
82
(xi ii)
L I S T O F F I G U R E S
Figure Title Page
2.1 Map of the Philippines 20
2.2 Channels of Distribution for Marketing of Hogs .. 30
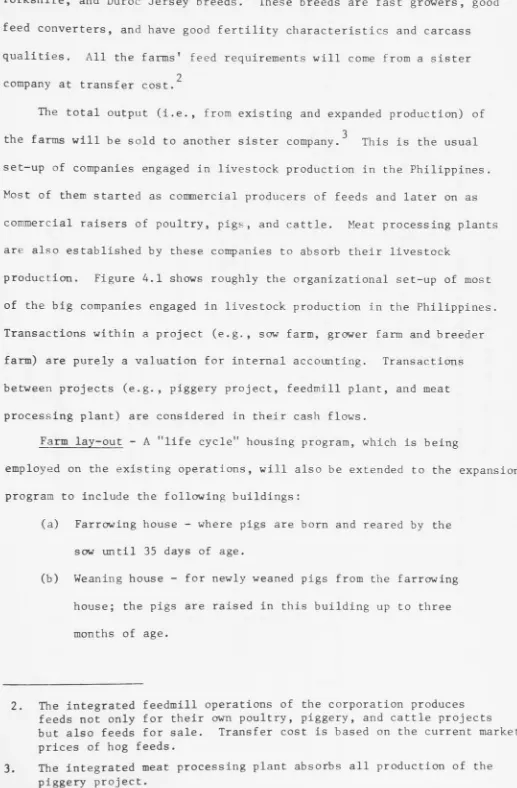
4.1 Organizational Set-up of ABC Corporation .. .. 51
6.1 NPVs at Different Assumptions: Owner's Viewpoint .. 86
6.2 IRRs at Different Assumptions: Owner's Viewpoint .. 87
6.3 NPVs at Different Assumptions: Social Viewpoint .. 94
6.4 IRRs at Different Assumptions: Social Viewpoint .. 95
INTRODUCTION
This introductory chapter outlines the problems of development
efforts in the Philippines. It then goes on to consider the objectives, significance, and limitations of the study; and also the sources of data.
1.1 Statement of the Problem
The Philippines, endowed with abundant natural resources, is
essentially an agricultural country. Statistics show that agriculture accounts for two-thirds of export earnings, one-half of total employment, and one-third of the total goods and services produced in the Philippine economy (Philippines Department of Public Information, 1974). However, the sector has vast potentials still untapped. These lie not only in food production but also in the production of commercial crops which are inputs for other productive industries. Therefore, the scope for the expansion of agriculture covers not only the supply of the economy's food requirements, but also the feeding of industries.
Agriculture must be improved to raise the levels of nutrition of the Filipino population. The caloric intake of Filipinos, although relatively sufficient for sustenance, could be enriched through greater food
TABLE 1.1
TYPICAL FOOD ITEMS AND AVERAGE CONSUMPTION IN UNITED STATES, JAPAN AND THE PHILIPPINES
(set at ICQ index points for comparison)
Food Items United
States Japan Philippines
Cereals 60.7 208.1 100.0
Vegetables 1,037.5 1,492.4 100.0
Meat 762.7 79.1 100.0
Fish 80.6 339.7 100.0
Fats and Oils 1,261.9 333.1 100.0
Milk 2,367.9 320.0 100.0
Eggs 1,022.7 4.0 100.0
Source: Computed from the Food and Agriculture Organization (FAO) Statistics for 1964 and 1966.
The Filipino's food intake is less varied and less substantial than either that of the average American or Japanese, both of whom are better off with respect to income. The implication of this is that expansion of agriculture and of the total per capita income in the Philippines may help improve the diet of the average Filipino.
The government, in its Four-Year Development Plan (FY 1974-1977),^ gives top priority to the development of agriculture-based industries now
in the process of transformation from basically traditional to highly
productive ones. The plan recognises the following problems and challenges
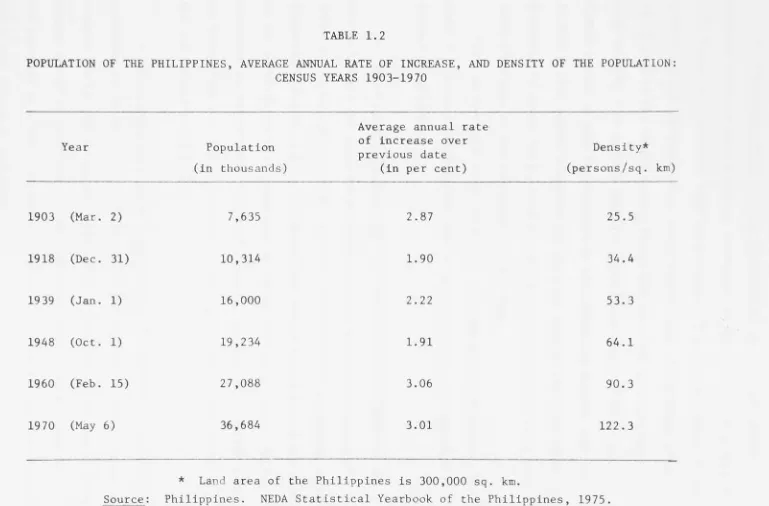
a. High population growth - The most recent Census of Population placed the total Philippine population at 36.7 million in 1970, indicating an annual rate of growth of 3 per cent in the last ten years (see Table 1.2). Based on this figure, the population would have grown to 42.5 million by 1975 and to 49.2 million by 1980.
Unless this rapid rate of population growth is checked, future develop-ment efforts will be doubly difficult. In the first place, a high popu-lation growth rate Imposes needs that eat up vital and crital development resources. In the second place, it magnifies the unemployment problem, generating an additional pressure on the economy to provide more jobs and raise income levels.
b. Unemployment and underemployment - The unemployment rate ranges from 5 to 8 per cent. In absolute terms this means 600,000 to 900,000 unemployed. Considering that each year there are 400,000 new entrants to the labor force, the economy needs to generate annually more than 450,000 new jobs if unemployment is going to be meaningfully reduced. The existence of substantial underemployment, estimated to be 16.2 per cent of the labour force, further complicates the problem.
TABLE 1.2
POPULATION OF THE PHILIPPINES, AVERAGE ANNUAL RATE OF INCREASE, AND DENSITY OF THE POPULATION: CENSUS YEARS 1903-1970
Year Population
(in thousands)
Average annual rate of increase over previous date
(in per cent)
Density* (persons/sq. km)
1903 (Mar. 2) 7,635 2.87 25.5
1918 (Dec. 31) 10,314 1.90 34.4
19 39 (Jan. 1) 16,000 2.22 53.3
1948 (Oct. 1) 19,234 1.91 64.1
1960 (Feb. 15) 27,088 3.06 90.3
1970 (May 6) 36,684 3.01 122.3
* Land area of the Philippines is 300,000 sq. km.
Although real per capita GNP has increased in recent years at a rate of 2 to 3 per cent per year, this has not made a significant impact on the poorer half of the population, particularly those in the rural areas. The Bureau of the Census Family Income and Expenditure Survey reports that in 1971, 1.87 million families earned less than PI,500. (This family income is very low compared to the prevailing minimum wage of P2,200.) This number accounted for 29.4 per cent of the total number of
families. Of these, 88.8 per cent live in the rural sector, while the urban poor made up the remaining 11.2 per cent.
Farm incomes need to be raised not only for reasons of equity, but also to provide a broad market base which can support the expansion of industrial activities.
e. Inadequate infrastructure - Infrastructure development in the past six years has shown marked improvement as a result of sustained
investments for its expansion. However, infrastructure facilities remain inadequate in meeting actual demands which have expanded due to the growth of the population and of commercial and industrial activities. This
situation is due not only to the constraints imposed by the availability of development resources, but also to backlogs in the implementation of the infrastructure program.
Thus, the need to expand exports is critical. In turn, this will require an expanding scope of investment activity as well as the diversi-fication not only of export commodities, but also of commodity outlets in the international market. The instability in the earnings of traditional export products, which have adversely affected the country's foreign
trade sector, further brings into focus the urgency of developing new exports.
g. Rising prices - Efforts to solve the balance of payments diffi-culties in the past have generated another set of problems, namely, that of rapidly rising prices. Whereas price increases prior to 1970 averaged only 4.5 per cent annually, prices have risen at a considerably more rapid pace after 1970. Although some price increases cannot be avoided,
especially in the face of world monetary adjustments, future efforts at development must see to it that growth is not attained at the expense of price stability.
Although the Development Plan contains programs directed towards the solutions of the abovementioned problems, the whole plan itself is
attuned to the goal of employment generation. Accordingly, all programs in the Development Plan are directed towards generating more employment opportunities.
The present unemployment problems can be traced to three main factors, namely: the rapid rate of growth of the labour force, which is directly
related to the growth of the population; the educational system, which has not adapted itself to development needs; and policies which have encouraged growth based on capital-intensive methods at the expense of labour.
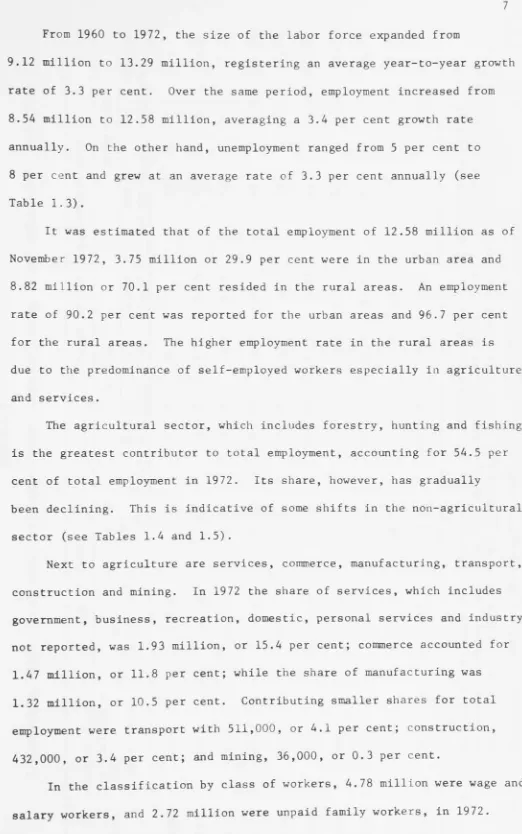
9.12 million to 13.29 million, registering an average year-to-year growth rate of 3.3 per cent. Over the same period, employment increased from 8.5A million to 12.58 million, averaging a 3.4 per cent growth rate annually. On the other hand, unemployment ranged from 5 per cent to 8 per cent and grew at an average rate of 3.3 per cent annually (see Table 1.3).
It was estimated that of the total employment of 12.58 million as of November 1972, 3.75 million or 29.9 per cent were in the urban area and
8.82 million or 70.1 per cent resided in the rural areas. An employment rate of 90.2 per cent was reported for the urban areas and 96.7 per cent for the rural areas. The higher employment rate in the rural areas is due to the predominance of self-employed workers especially in agriculture and services.
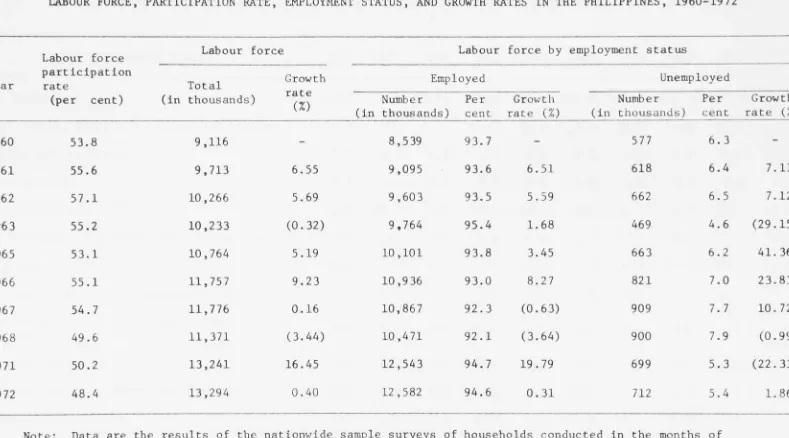
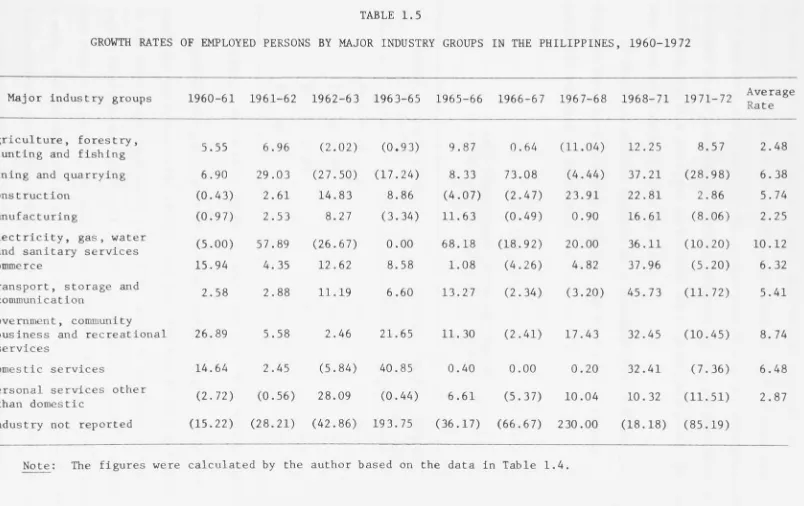
The agricultural sector, which includes forestry, hunting and fishing, is the greatest contributor to total employment, accounting for 54.5 per cent of total employment in 1972. Its share, however, has gradually
been declining. This is indicative of some shifts in the non-agricultural sector (see Tables 1.4 and 1.5).
Next to agriculture are services, commerce, manufacturing, transport, construction and mining. In 1972 the share of services, which includes government, business, recreation, domestic, personal services and industry not reported, was 1.93 million, or 15.4 per cent; commerce accounted for
1.47 million, or 11.8 per cent; while the share of manufacturing was 1.32 million, or 10.5 per cent. Contributing smaller shares for total employment were transport with 511,000, or 4.1 per cent; construction, 432,000, or 3.4 per cent; and mining, 36,000, or 0.3 per cent.
[image:21.609.55.577.11.845.2]TABLE 1.3
LABOUR FORCE, PARTICIPATION RATE, EMPLOYMENT STATUS, AND GROWTH RATES IN THE PHILIPPINES, 1960-1972
Labour force Labour force Labour force by employment status
Year
participation
rate Total Growth Employed Unemployed
(per cent) (in thousands) rate
(%) Number
(in thousands) Per cent
Growth rate (%)
Number (in thousands)
Per cent
Growth rate (%)
1960 53.8 9,116 - 8,539 93.7 - 577 6.3
-1961 55.6 9,713 6.55 9,095 93.6 6.51 618 6.4 7.11
1962 57.1 10,266 5.69 9,603 93.5 5.59 662 6.5 7.12
1963 55.2 10,233 (0.32) 9,764 95.4 1.68 469 4.6 (29.15)
1965 53.1 10,764 5.19 10,101 93.8 3.45 663 6.2 41.36
1966 55.1 11,757 9.23 10,936 93.0 8.27 821 7.0 23.83
1967 5A.7 11,776 0.16 10,867 92.3 (0.63) 909 7.7 10. 72
1968 49.6 11,371 (3.44) 10,471 92.1 (3.64) 900 7.9 (0.99)
1971 50.2 13,241 16.45 12,543 94.7 19.79 699 5.3 (22.33)
1972 48.A 13,294 0.40 12,582 94.6 0.31 712 5.4 1.86
Note: Data are the results of the nationwide sample surveys of households conducted in the months of October of each year, except in 1971 and 1972 when the surveys were taken in November. No surveys were conducted in 196A, 1969 and 19 70 October series. The growth rates were computed by the author.
PERCENTAGE DISTRIBUTION OF EMPLOYED PERSONS BY MAJOR INDUSTRY GROUPS IN THE PHILIPPINES, 1960-1972
Major industry groups 1960 1961 1962 1963 1965 1966 1967 1968 1971 19 72
All industries 100.0 100.0 100.0 100.0 100.0 100.0 100.0 100.0 100.0 100.0 Agriculture, forestry, hunting and fishing 61.2 60.6 61.4 59.2 56.7 57.5 58. 3 53.8 50.4 54.5
Mining and quarrying 0.3 0.3 0.4 0.3 0.2 0.2 0.4 0.4 0.5 0.3
Construction 2.7 2.5 2.5 2.8 2.9 2.6 2.5 3.3 3.4 3.4
Manufacturing 12.1 11.3 11.0 11.7 10.9 11.2 11.3 11.8 11.5 10.5
Electricity, gas, water and sanitary services 0.2 0.2 0.3 0.2 0.2 0.3 0.3 0.3 0.4 0.4
Commerce 8.8 9.6 9.5 10.5 11.0 10.3 9.9 10.8 12.4 11.8
Transport, storage and communication 3.2 3.1 3.0 3.3 3.4 3.5 3.4 3.5 4.2 3.7 Government community, business and
recreational services
5.0 5.9 5.9 6.0 7.0 7.2 7.1 8.6 7.5 8.5
Domestic services 3.8 4.0 3.9 3.6 5.0 4.6 4.6 4.8 5.3 4.9
Personal services other than domestic 2.2 2.0 1.9 2.3 2.2 2.2 2.1 2.4 2.2 2.0
Industry not reported 0.5 0.4 0.3 0.2 0.5 0.3 0.1 0.3 0.2 0.0
Note: Data are the results of the nationwide sample surveys of households conducted in the months of October of each year, except in 1971 and 1972 when the surveys were taken in November. No surveys were conducted in 1964, 1969
[image:23.864.30.813.62.520.2]TABLE 1.5
GROWTH RATES OF EMPLOYED PERSONS BY MAJOR INDUSTRY GROUPS IN THE PHILIPPINES, 1960-1972
Major industry groups 1960-61 1961 -62 1962-63 1963-65 1965-66 1966-67 1967-68 1968-71 1971-72 Average Rate
Agriculture, forestry,
hunting and fishing 5. ,55 6. 96 (2. .02) (0, 93) 9, .87 0. 64 (11. 04) 12, .25 8. ,57 2. .48 Mining and quarrying 6. ,90 29. 03 (27, .50) (17. 24) 8. .33 73. 08 (4. 44) 37, .21 (28. ,98) 6, .38 Construction (0. .43) 2. 61 14, .83 8. 86 (4, .07) (2. 47) 23. 91 22, .81 2. ,86 5. .74 Manufacturing (0. .97) 2. 53 8. .27 (3. 34) 11, ,63 (0. 49) 0. 90 16, .61 (8. ,06) 2. .25 Electricity, gas, water
and sanitary services (5. ,00) 57. 89 (26, .67) 0. 00 68, .18 (18. 92) 20. 00 36, .11 (10. ,20) 10. .12 Commerce 15. ,94 4. 35 12, .62 8. 58 1. ,08 (4. 26) 4. 82 37. ,96 (5. ,20) 6. ,32 Transport, storage and
communication 2. ,58 2. 88 11, ,19 6. 60 13. .27 (2. 34) (3. 20) 45. ,73 (11. .72) 5. ,41 Government, community
business and recreational 26. ,89 5. 58 2, ,46 21. 65 11. ,30 (2. 41) 17. 43 32. ,45 (10. .45) 8. , 74 services
Domestic services 14. ,64 2. 45 (5. ,84) 40. 85 0. ,40 0. 00 0. 20 32. ,41 (7. 36) 6. ,48 Personal services other
than domestic (2. .72) (0. 56) 28. ,09 (0. 44) 6. ,61 (5. 37) 10. 04 10. , 32 (11. 51) 2, ,87 Industry not reported (15. ,22) (28. 21) (42. ,86) 193. 75 (36. 17) (66. 67) 230. 00 (18. ,18) (85. 19)
The bulk of self-employed and unpaid family workers were employed in agriculture and related industries, accounting for 68.5 per cent and
t
88.9 per cent, respectively. The greater bulk of wage and salary workers belonged to the government; community, business and recreational services
combining for 21.4 per cent; agriculture and related industries, 20.2 per cent; and manufacturing, 17.0 per cent.
Of the 12.29 million employed as of November 1972, 2.88 million, or 23.5 per cent, were partially employed. The breakdown of persons
partially employed is as follows:
TABLE 1.6
PART-TIME WORKERS IN THE PHILIPPINES BY NUMBER OF HOURS RENDERED PER WEEK, 19 72
NUMBER OF HOURS RENDERED PER WEEK
WORKERS WORKING PART-TIME Number p^^ ^^^^
Less than 10 hours 100 0.8
10 - 19 hours 538 4.4
20 - 29 hours 849 6.9
30 - 39 hours 1,402 11.4
Source: Philippines. National Census and Statistics Office, 1972.
12 farm labourers, fishermen, hunters, loggers and related workers, which accounted for 30.2 per cent. This is due to climatic and seasonal conditions.
Underemployment totalled 1.55 million, or 12.6 per cent, of the
total employed at work as of November 1972. Of this figure, 7.1 per cent were invisibly underemployed (those working full-time yet wanting for
additional work) while 5.5 per cent were visibly underemployed (those working less than 40 hours and wanting additional work).
The government has adopted several measures and policies to generate employment opportunities. Presidential Decree No. 92, besides defining incentives for potential investors, also incorporates a provision for the deduction of labour training expenses from taxable income to encourage the upgrading of the productivity of unskilled labour.
Likewise, the Board of Investments has built into its Priorities Plans provisions for generating greater employment by highlighting labor
intensification as a criterion for approving projects. Thus far, the approved Investment Priorities Plan (IPP) projects over 1968 to 1972 have directly created 33,000 jobs. By 1973, the projects are anticipated to create 20,000 more jobs. If investment plans are carried out, the annual target number of new jobs to be created by the IPP will be anywhere from 30,000 to 50,000.
Another area which is being tapped by the government for potential employment generation is the export sector. The plan expects increased activities in this sector, particularly in the export of labor-intensive manufactured goods. Export incentives in the form of special tax credit and deduction of direct costs from income taxes are being extended to export manufacturers under Presidential Decree No. 92.
The full operation of the Export Processing Zone Authority will
sold in the zone from customs and internal revenue laws and regulations, and from local tax ordinance.
Increased government spending on public works projects is envisaged to raise substantially the employment level, especially with the adoption of labor-intensive methods in many government projects. Noteworthy is the organization of work brigades for rural public works, e.g., con-struction of levees, flood control projects and farm-to-market roads. These activities are to be expanded to include dredging of sewerage systems, land clearing, road maintenance, housing, reforestation, and irrigation and waterworks construction and repair.
A wide range of labor laws is currently being reviewed to make them more employment-oriented. Among these are regulations covering wages, overtime work, child and woman labor, workmen's compensation and
emergency medical and dental care. The Blue Sunday Law was repealed to allow business to operate on Sundays and holidays.
Full-scale implementation of the integrated land reform program may help alleviate unemployment and underemployment, especially by creating an atmosphere more conducive to greater productivity and higher farm income. It also aims to bring about a change in the pattern of land utilization that will induce more labor-absorptive activities on farms.
Likewise, stimulating regional development via regional dispersal of industries, particularly agro-industrial ones assisting small cottage industries and providing infrastructure facilities in rural areas, will relieve the pressure of urban unemployment and create a wider geographical base for employment opportunities.
1.2 Objectives of the Study
14
It is therefore the objective of this study to determine whether a contract growing scheme in piggery could be a profitable venture from
the viewpoints of both the owners and growers. It is believed that if this contract growing scheme would turn out to be beneficial to both viewpoints, then the imposition by the government of this scheme as a condition of registration for assistance through the Board of Investments
2
(BOI) could help solve not only the problem of unemployment and under-employment, but also the low per capita income and per capita consumption which are characteristic of most Filipinos.
Assessments from the private investors' viewpoints (i.e., owners and growers) involve an examination of the profitability of investment in a piggery contract growing scheme on the basis of actual market prices. Three different levels of contracting are analyzed from the owner's
view-3
point, namely, 0 per cent, 60 per cent and 100 per cent. On the other hand, the profitability of growing 100 pigs to market age is calculated
4 from the growers' viewpoint.
The second assessment is concerned with the return of the project to the Philippine society as a whole. From this viewpoint, the growers are treated as an extension of the labor force of the owner. This
analysis is undertaken because commercial profitability measured in terms
2. The Board of Investments (BOI) is a government administrative body created by Legislative Act (Republic Act No. 5186) primarily to
encourage both local and foreign entrepreneurs to invest in preferred areas of economic activity. A package of incentives - mostly in the form of tax deductions - has been offered to investors in both
pioneer and non-pioneer preferred projects.
3. These three levels of contract growing in piggery are selected because in poultry the BOI required all registered companies to
contract grow at least 60 per cent of their broiler production. The same condition is applied to those seeking registration, i.e., they can only be registered if they would practise contract growing. 4. The only company practising this scheme, contract grows his pigs at
of market prices does not reflect adequately the impact of the scheme on the society as a result of price distortions. A "shadow-pricing" procedure is thus adopted to assess the social economic worth of contract
growing in piggery.
In addition to the cost-benefit analysis over a given time horizon based on the most likely values of the parameters used in the study, an attempt is made to estimate the profitability of the project taking into consideration changes in some of these parameters. Sensitivity analyses of these types have been undertaken so as to gain a greater understanding of the nature of the financial and employment relationships involved, and to test the economic viability of the project over a range of circumstances
1.3 Significance and Limitations of the Study
A piggery contract growing agreement is a new concept in Philippine agriculture particularly in livestock production. The concept was
introduced only in 1975 by one of the corporations engaged in commercial pig raising. This corporation is also practising contract growing in poultry. As previously mentioned, it is felt that this concept could generate more employment and higher per capita income and per capita consumption. Other industries engaged in livestock production should, therefore, be studied and analyzed using this concept of contract growing. This study can be used as a basis for further research.
Because of limited time resources, only three levels of contracting (0 per cent, 60 per cent and 100 per cent) have been examined. Although the study of these levels demonstrates the methodology of the assessment, an adequate assessment would require that other levels of contracting be examined, e.g., 20 per cent, 40 per cent, 80 per cent, etc. This is an important aspect because these levels might turn out to be more
16 An important issue not analyzed in the study is risk and uncertainty. This omission is, however, compensated for to some extent by making some
simple sensitivity analyses involving a constant change over time of some of the parameters used.
These limitations come about due to data and time constraints. Further studies and research on these limitations could be undertaken later on using the sub-thesis as a basis.
1.4 Sources of Data
In the preparation of this study, data are drawn from project evaluation reports on piggeries by the Board of Investments (BOI), piggery project feasibility studies submitted by companies seeking BOI assistance, and the hog contract growing agreement of the one piggery corporation which has thus far used a contract growing scheme. Infor-mation was also secured from the different branches of the government, namely: the Bureau of Animal Industry (BAT), the University of the Philippines College of Agriculture (UPCA), the Bureau of Agricultural Economics (BAEcon.), the National Economic and Development Authority
(NEDA), and the Development Bank of the Philippines (DBP).
The costs and benefits estimates of the study are based on the author's calculations. As an Animal Husbandry graduate from UPCA, and analyst of the Livestock and Fishing Section of BOI, he has had several years experience in the technical and marketing aspects of project
CHAPTER 2
THE SWINE INDUSTRY AND PIGGERY CONTRACT GROWING AGREEMENT IN THE PHILIPPINES
This chapter discusses the problems and status of the swine industry and also some marketing practices in pig raising in the Philippines. It then goes on to discuss the piggery contract growing agreement including its advantages and disadvantages from the owner's and growers' viewpoints.
In the Philippines, there are two types of broiler contract growing agreements namely "flat fee" and "guaranteed price". In the flat fee, the owner provides the chicks, feeds, medicines, and other poultry
supplies to the grower. The grower, on the other hand, takes care of the chicks using his own poultry houses, equipment, labor force and management for an agreed fee per kilogram liveweight. In the case of guaranteed price, the owner programs or schedules the grower's production and
purchases the marketable broilers raised by the grower at the agreed price Under this arrangement, the grower has to provide the funds with which to buy the chicks, feeds, medicines, and other poultry supplies in addition
to the poultry houses and equipment.
In piggery production, however, the sole contract growing scheme is based on a "flat fee". In this study, an attempt is made to assess its profitability both from the private investors' (i.e., owner's and
growers') and social viewpoints. The "flat fee" basis of contracting is likely to be most attractive to small growers since it makes less initial demand for capital. However, a full assessment of contract growing
18
2.1 The Philippines Swine Industry
Pork is the major meat consumed in the Philippines. It constitutes about 60 per cent of all meats consumed. However, the supply of pork still lags behind the total annual per capita requirement of pork of 11.7 kilograms recommended by the Philippine Food and Nutrition Research Centre of the National Institute of Science and Technology (FNRC-NIST). This lag can be explained by the many problems that confront the pig
raisers (particularly the small and medium raisers) in spite of the voluminous research conducted in the past.
2.1.1 Problems of the industry
The pig raisers have various problems, the severity of which differ from one farm to another. Some problems are regional while others are seasonal in nature. However, most of these problems are common to all raisers. Problems related to feeds and feeding, pests and diseases, poor management practices, financing, losses in transit, and Lack of marketing information are only few examples. These problems are discussed below
(Arganosa, 1972):
(a) Feeds and feeding - Inadequate supply and high cost of the different feed ingredients for swine is the most important problem
confronting the industry. Protein feeds, such as fish meal, soybean oil meal, and meat and bone meal are imported. Even c o m and sorghum have
to be imported to supplement local production. The adoption of the floating exchange rate of the peso has increased the prices of the
imported ingredients tremendously. Even the prices of locally produced feeds like c o m and c o m by-products, copra meal, rice bran, and cane molasses have increased considerably and consequently increased the cost of production. Aside from high prices, other problems related to feeds and feeding are the reliability and continuity of supply of feed
(b) Pests and diseases - Livestock health and sanitation is another very important production problem of the swine industry. It has been estimated that about 50 per cent of the pigs b o m in the country
do not reach the market because they die of hog cholera and other swine diseases. Most mortality would be in the first two months. In addition, producers suffer tremendous losses in terms of reduced efficiency in
production due to various pests and diseases.
(c) Management aspects - Poor management practices are mostly responsible for the low average productivity of swine. The average hog producer has much to learn in terms of good swine husbandry (e.g., floor space requirement, using and keeping production records, etc.). Research by several agencies has demonstrated a considerable opportunity for
managerial improvement.
(d) Financing - Most swine raisers do not have thp capital to start a modest size piggery. Even the small and backyard swine raisers with only a few head at any given time have financial difficulties. The future of the industry depends on the availability of capital. However, lending institutions do not give loans without collateral, and pigs themselves are not acceptable as collateral.
(e) Losses in transit - This is not a serious problem if pigs are produced within a 200 kilometre radius from the Greater Manila area
because body weight loss on the average will not be more than 3 per cent for a period of 4 to 5 hours in transit. However, losses due to death of animals while in transit and as much as 15 per cent shrinkage have been reported for pigs coming from Mindanao (see Figure 2.1 for the map of the Philippines). The losses can be attributed to mismanagement, overcrowding, and lack of feeding and watering facilities while the animals are in
FIGURE 2.1
MAP OF THE PHILIPPINES*
20
R C A V I T F I s C ^ ' ^ ^ ' ^ A W A R I N F S
D l l A N f S
Map of the Philippines (continued)
CLASSIFICATION OF PROVINCES, BY GEOGRAPHICAL REGION, 1972
L U Z O N V I S A Y A S
I. City of Manila II. Ilocos
1. Ilocos Norte 2. Abra
3. Kallnga-Apayao 4. Ilocos Sur 5. Mt. Province 6. Ifugao
7. La Union 8. Benguet III. Cagayan Valley
1. Batanes 2. Cagayan 3. Isabela
4. Nueva Vizcaya IV. Central Luzon
1. Pangasinan 2. Nueva Ecija 3. Tarlac
4. Zambales 5. Panrpanga 6. Bulacan 7. Bataan
V. Southern Tagalog 1. Quezon 2. Rizal 3. Cavite 4. Laguna 5. Batangas 6. Marinduque
7. Mindoro Occidental 8. Mindoro Oriental 9. Palawan
VI. Bicol
1. Camarines Norte 2. Camarines Sur 3. Catanduanes 4. Albay
5. Sorsogon 6. Masbate
VII. Western Vlsayas 1. Romblon 2. Aklan 3. Capiz 4. Antique 5. Iloilo
6. Negros Occidental VIII. Eastern Vlsayas
1. Northern Samar 2. Western Samar 3. Eastern Samar 4. Northern Leyte 5. Southern Leyte 6. Cebu
7. Bohol
8. Negros Oriental M I N D A N A O
IX. Northern and E s t e m Mindanao 1. Surigao del Norte
2. Agusan del Norte 3. Misamis Oriental 4. Surigao del Sur 5. Misamis Occidental 6. Bukidnon
7. Agusan del Sur 8. Lanao del Norte 9. Lanao del Sur 10. Camiguin*
X. Southern and Western Mindanao 1. Zamboanga del Norte
2. Zamboanga del Sur 3. Davao del Norte 4. Davao Oriental 5. Cotabato
6. South Cotabato 7. Davao del Sur 8. Sulu
* Not shown on map.
22 (f) Marketing Information - In most countries leading in swine
production, the producers are constantly informed of the market situation. At times, predictions as to the best time to sell hogs are made available
to the raisers. These types of information are lacking in the Philippine swine industry. Generally, the producers are a day or so behind in getting marketing information compared with the feed suppliers and/or hog buyers.
2.1.2 Status of the industry
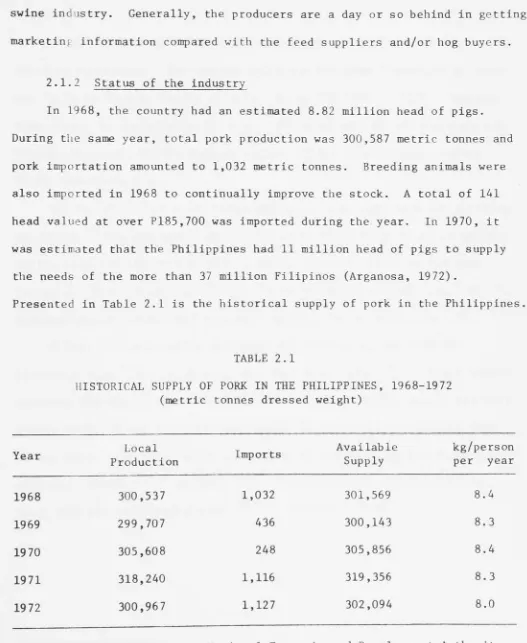
In 1968, the country had an estimated 8.82 million head of pigs. During the same year, total pork production was 300,587 metric tonnes and pork importation amounted to 1,032 metric tonnes. Breeding animals were also imported in 1968 to continually improve the stock. A total of 141 head valued at over P185,700 was imported during the year. In 1970, it was estimated that the Philippines had 11 million head of pigs to supply
the needs of the more than 37 million Filipinos (Arganosa, 1972).
[image:36.609.50.577.189.832.2]Presented in Table 2.1 is the historical supply of pork in the Philippines.
TABLE 2.1
HISTORICAL SUPPLY OF PORK IN THE PHILIPPINES, 1968-1972 (metric tonnes dressed weight)
Year Local
Production Imports
Available Supply
kg/person per year
1968 300,537 1,032 301,569 8.4
1969 299,707 436 300,143 8.3
1970 305,608 248 305,856 8.4
1971 318,240 1,116 319,356 8.3
1972 300,967 1,127 302,094 8.0
Source: Philippines. 1968-1972.
From Table 2.1, available supply ranged from 8.0 to 8.4 kilograms per person per year. Compared with the yearly per capita requirement
recommended by FNRC-NIST of 11.7 kilograms of pork, the historical availability of supply represents 68 to 72 per cent of the sufficiency requirements.
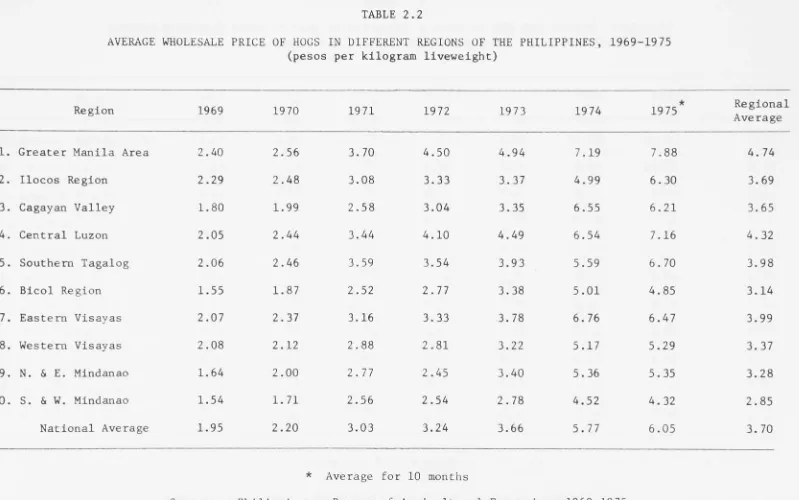
Prices of pigs on a liveweight basis greatly differ from one
locality to another. The average price per kilogram liveweight of pigs was PA.74 in Greater Manila area for the period 1969 to 1975.
Compara-tive prices in the same period were: Bicol Region, P3.14; Southern and Western Mindanao, P2.85; Cagayan Valley, P3.65; and Southern Tagalog, P3.98 (see Table 2.2).
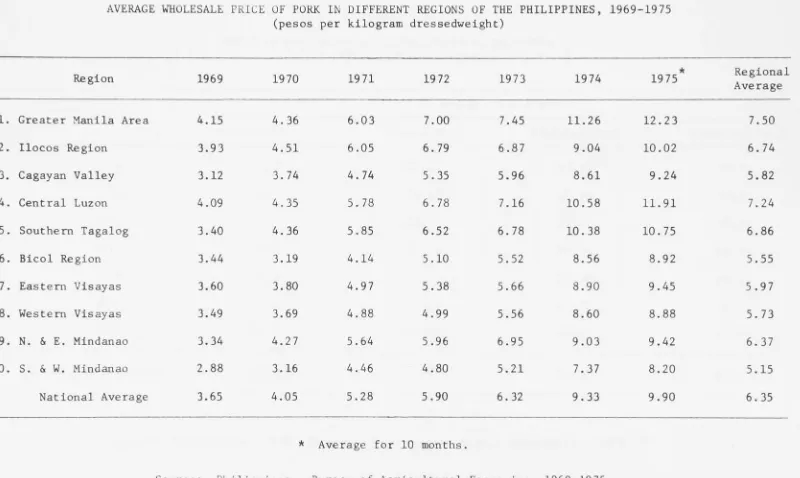
Prices of pork on a dressedweight basis also vary from one locality to another. The average price per kilogram of pork was P7.50 in Greater Manila area for the period 1969 to 1975. Average prices in the same period for Bicol Region was P5.55; Southern and Western Mindanao, P5.15; Cagayan Valley, P5.82; and Southern Tagalog, P6.86 (see Table 2.3).
Prices of feeds, which represent the highest single cost of
producing pigs,^ are increasing at a very high rate. The average annual increase for the period 1969 to 1975 for starter-creeper was 24 per cent; grower mash, 23 per cent; finisher mash, 24 per cent; and breeder mash, 23 per cent. The 1975 prices per bag of 40 kilograms of hog feeds are as follows: starter-creeper mash, P56.30; grower mash, P49.20; finisher mash, P46.20; and breeder mash, P47.20 (see Table 2.4).
1. C o n s e r v a t i v e e s t i m a t e s i n d i c a t e that f e e d s cost r e p r e s e n t s a b o u t
TABLE 2 . 2
AVERAGE WHOLESALE PRICE OF HOGS IN DIFFERENT REGIONS OF THE PHILIPPINES, 1969-19 75 (pesos per kilogram liveweight)
Region 1969 1970 1971 1972 1973 19 74 1975* Regional
Average
1. Greater Manila Area 2 . 4 0 2 . 5 6 3 . 7 0 4 . 5 0 4 . 9 4 7 . 1 9 7 . 8 8 4 . 74
2 . Ilocos Region 2 . 2 9 2 . 4 8 3 . 0 8 3 . 3 3 3 . 3 7 4 . 9 9 6 . 3 0 3 . 6 9
3. Cagayan Valley 1 . 8 0 1 . 9 9 2 . 5 8 3 . 0 4 3 . 3 5 6 . 5 5 6 . 2 1 3 . 6 5
4 . Central Luzon 2 . 0 5 2 . 4 4 3 . 4 4 4 . 1 0 4 . 4 9 6 . 5 4 7 . 1 6 4 . 3 2
5 . Southern Tagalog 2 . 0 6 2 . 4 6 3 . 5 9 3 . 5 4 3 . 9 3 5 . 5 9 6 . 7 0 3 . 9 8
6 . Bicol Region 1 . 5 5 1 . 8 7 2 . 5 2 2 . 7 7 3 . 3 8 5 . 0 1 4 . 8 5 3 . 1 4
7. Eastern Visayas 2 . 0 7 2 . 3 7 3 . 1 6 3 . 3 3 3 . 7 8 6 . 7 6 6 . 4 7 3 . 9 9
8 . Western Visayas 2 . 0 8 2 . 1 2 2 . 8 8 2 . 8 1 3 . 2 2 5 . 1 7 5 . 2 9 3 . 3 7
9 . N. 5f E. Mindanao 1 . 6 4 2 . 0 0 2 . 7 7 2 . 4 5 3 . 4 0 5 . 3 6 5 . 3 5 3 . 2 8
1 0 . S. & W. Mindanao 1 . 5 4 1 . 7 1 2 . 5 6 2 . 5 4 2 . 7 8 4 . 5 2 4 . 3 2 2 . 8 5
National Average 1 . 9 5 2 . 2 0 3 . 0 3 3 . 2 4 3 . 6 6 5 . 7 7 6 . 0 5 3 . 7 0
Source:
*
P h i l i p p i n e s .
Average
Bureau
for 10 months
[image:38.864.26.825.62.562.2]AVERAGE WHOLESALE PRICE OF PORK IN DIFFERENT REGIONS OF THE PHILIPPINES, 1969-19 75 (pesos per kilogram dressedweight)
Region 1969 1970 1971 19 72 1973 1974 1975* Regional
Average
1. Greater Manila Area 4.15 4.36 6.03 7.00 7.45 11.26 12.23 7.50
2. Ilocos Region 3.93 4.51 6.05 6.79 6.87 9.04 10.02 6.74
3. Cagayan Valley 3.12 3.74 4.74 5.35 5.96 8.61 9.24 5.82
4. Central Luzon 4.09 4.35 5.78 6.78 7.16 10.58 11.91 7.24
5. Southern Tagalog 3.40 4.36 5.85 6.52 6.78 10.38 10.75 6.86
6. Bicol Region 3.44 3.19 4.14 5.10 5.52 8.56 8.92 5.55
7. Eastern Visayas 3.60 3.80 4.97 5.38 5.66 8.90 9.45 5 .97
8. Western Visayas 3.49 3.69 4.88 4.99 5.56 8.60 8.88 5.73
9. N. & E. Mindanao 3.34 4.27 5.64 5.96 6.95 9.03 9.42 6.37
10. S. 6 W. Mindanao 2.88 3.16 4.46 4.80 5.21 7.37 8.20 5.15
National Average 3.65 4.05 5.28 5.90 6.32 9.33 9.90 6.35
* Average for 10 months.
[image:39.864.28.828.78.556.2]TABLE 2.4
PRICE OF HOG FEEDS IN THE PHILIPPINES, 1969-1975 (pesos per bag of 40 kilograms)
H O G F E E D S Y E A R
Starter-Creeper Grower Mash Finisher Mash Brood-Sow Mash
1969 17.01 15.21 13.41 14.72
19 70 25.83 22.23 18.90 20.88
1971 27.63 23.31 21.41 22.05
1972 29.75 25.43 23.54 24.17
1973 37.20 31.50 29.10 29.12
19 74 55.30 48.20 45.20 46.20
1975 56.30 49.20 46.20 47.20
Average Increase (%) 23.83% 23.16% 24.16% 2 3.16%
Source: Philippines. B-Meg Feedmill Plant of San Miguel Corporation, 1969-1975.
Coverage by Investment Priorities Plan - The Investment Priorities 2
Plan (IPP) , as prepared by the Board of Investments (BOI) and approved by the President of the Philippines, delineated the various industries which were given preferred status for purposes of enjoying the incentives
and guarantees offered under the Investment Incentives Act. This plan is within the context of a development strategy which has as its goal the correction of structural defects which have hampered the economy's
capacity for growth. The choice of areas of investment included in the list is based not only on the commercial feasibility of the projects, but also on the desirability of the activities for balanced economic
development. The special preference given to industries listed in the plan comes in the form of various incentives granted under Republic Act 5186, or the Investment Incentives Act. These incentives become
immediately available to firms upon registration with the Board of
Investments, as well as to investors in these BOI-registered enterprises.^ Pig raising has been included from the first to the most recent
4
(i.e., 8th) IPP as a preferred non-pioneer industry. The 8th IPP has estimated a measured capacity^ for pork of 29,936 metric tonnes dressed-weight. To date, the BOI has registered a total of seven piggery projects
2. Section 18 of R.A. 5186 requires the Board of Investments to prepare an Investment Priorities Plan not later than the end of January each year.
3. See Appendix F for the list of incentives under R.A. 5186.
4. The IPP classifies the industries listed in the plan into pioneer and non-pioneer. Pioneer areas of investment get more incentives than non-pioneer. "Pioneer enterprise shall mean a registered enterprise
(1) engaged in the manufacture, processing, or production, . . . of goods, products, commodities or raw materials that have not been or are not being produced in the Philippines on a commercial scale or
(2) which uses a . . . system of production . . . which is new and untried in the Philippines . . . ." (Taken from "The Investment and Export Incentives Acts [with corresponding amendments]", printed by
the Board of Investments, Pasig, Rizal, Philippines, Nov. 1974, pp. 51-52.)
5. Measured capacity shall mean the estimated additional volume of pro-duction or service which the BOI determine to be desirable in each
with a combined capacity of about 21,000 metric tonnes dressedweight.
28
6
2.1.3 Marketing practices
The marketing system is a critical factor in countries where the productive technology is undergoing rapid change. If the marketing system does not serve the interests and needs of the producer (i.e., if his production does not move to market and bring him additional earnings), he will not be inclined to increase production. If the marketing system does not bring the food to consumers when they need it, at prices they can afford, and in forms which satisfy nutritional needs, and personal tastes, then higher production will have little effect in alleviating hunger. Hence, a marketing system serves the special interest of the producer, the consumer, and the distributor, influencing directly and decisively their overall standard of living. In this section the marketing system and some marketing practices in the Philippine swine industry are discussed.
Areas of dispersion - Although almost all Filipinos are pork consumers, with the exception of the Muslim population in the south, the greater portion of the total national pork consumption is concen-trated in the large urban areas such as the Bacolod, Cebu, Davao, Iloilo and the Greater Manila area. This fact may be explained by the
concentrations of population in these areas as well as the relatively high incomes of the urban populations which give them a better purchasing power.
Northern and Eastern Mindanao, Eastern Visayas, and Southern and Northern Tagalog lead in the production of swine products. The major hog suppliers of the Greater Manila area are Pangasinan, the Cagayan Valley,
(continued) preferred and pioneer area of investment, in order to supply the needs of the economy at reasonable prices, taking into account the export potential of the area . . . (Taken also from "The Investment and Export Incentives Acts", p.52.)
and the Bicol r e g i o n . Hogs from these regions are a mixture of n a t i v e ,
c r o s s , and pure breeds and may come either from commercial piggery
pro-jects or from backyard swine raising o p e r a t i o n s . See Figure 2.1 for the
reference m a p .
C h a n n e l s of distributio n - Like any agricultural p r o d u c t , hogs
reach tie consumer only after passing through m i d d l e m e n . In the case of
h o g s , the number of middlemen involved depends primarily upon the type of
hogs and not so much on the distance of the producing area from the
c o n s u m e r .
N a t i v e h o g s , as a r u l e , are products of backyard piggery operations
which are undertaken on a very small s c a l e , usually with no more than
10 pigs per grower. These hogs are usually purchased from the farmers by
b a r r i o (i.e., village) agents who go a r o u n d , buying from house to h o u s e .
M u n i c i p a l buyers purchase hogs from the barrio a g e n t s , and city buyers in
turn buy from m u n i c i p a l b u y e r s . The hogs are then sent to the urban
consumer centres such as M a n i l a , where a wholesale hog buyer absorbs the
accumulated number of a n i m a l s . From the wholesale hog b u y e r , the animals
proceed to the meat w h o l e s a l e r who takes charge of slaughtering and
d i s t r i b u t i n g the meat to retailers through which pork finally reaches the
c o n s u m e r s .
Purebred h o g s , on the other h a n d , usually come from established
p i g g e r y projects which usually sell directly to a hog-wholesaler or to a
meat p r o c e s s o r , thus by-passing the smaller middlemen whose operations are
aimed at accumulating the market s t o c k . Because of the factors of
distance and t r a n s p o r t a t i o n , the marketing chain for purebred hogs raised
in Luzon is a little shorter than for those raised in the Visayas and
CHANNELS OF DISTRIBUTION FOR MARKETING OF HOGS NATIVE HOGS
ooo
Producers
O O O
AaaemoiM for municipol buy«r
Accumulcr^o from barno aqontt
Aocumulafo3 from rnunopal buyar
M A N I L A
Cer&rol distnbLr+ion
point
Slaugh+or» ond d.afnbu^r-?
S«sll» +o
conaurnonj
PURE BRED ( Mindar^ao 3 Viaayas )
O O O
oo
o
'rod J c tr3
oo^^
u>o
Methods and rates of transport - Because of the distribution of hog raisers and hog consumer centres, hogs usually have to be transported over an appreciable distance to reach the consumers. Hogs have been transported by ships, trains and trucks depending on whichever is con-venient. Hogs from Visayas and Mindanao are usually shipped to Manila, whereas those coming from points in Luzon are transported via train and/or
trucks. Table 2.5 shows the existing hog transport rates from different sources to Manila.
TABLE 2.5
RATES OF TRANSPORT FOR HOG FROM DIFFERENT SOURCES TO MANILA (pesos per head)
Origin Mode of Transport Cost/head
Southern Mindanao Ship Pll.OO
Visayas Ship 5.00
Bicol Truck 6.00
Train 7.50
Cagayan Truck 10.00
Rizal Truck 2.00
Source: Philippines. A Feasibility Study of a 120-Sow Piggery Project, 1972.
From Table 2.5 it can be seen that there is a very wide range of transport costs. The table includes only the cost of transporting live pigs from different places to Manila. In addition to this cost, other
transfer costs have to be considered, namely loading and unloading charges, inspection fees, feed en route, shrinkage, etc. These costs explain
32 (See Table 2.2 for the average wholesale price of live pigs in different regions of the Philippines.)
Methods of procurement and disposal - The two common methods of
selling live hogs are (1) per kilo liveweight, and (2) per head. Selling on a liveweight basis involves weighing the animals either at the farm or at the town market. The total value of the animals is determined by multiplying the total weight by the agreed price(s) per kilo. This method is preferred over selling by the head since it provides farmers a "fair" value for the animals. The value is "fair" in the sense that the farmer knows the weight of his pigs.
The second way of selling hogs is on a "per head" basis. Weights are estimated by the buyers who, being experienced, are fairly precise in their estimates. A total price is offered based on the estimated weights, which are not generally known by the farmers.
In general, fattened and culled hogs are sold on a liveweight basis while weanlings are sold on a "per head" basis. In Mindanao and Western Visayas, selling of all hogs (including weanlings) is generally on a liveweight basis. In all other areas, selling on a "per head" basis is practised by less than AO per cent of all the farmers.
Methods of payment - The different methods of payment used by middlemen in the procurement and selling of hogs are as follow:
(1) cash and carry; (2) combination cash and carry; (3) cash advances; (4) credit, and (5) others which include barter. The majority of the buyers procure pigs on a "cash and carry" basis. Those who procure most
frequently on credit are the butcher-retailers.
2.2 The Piggery Contract Growing Agreement
A piggery contract growing scheme is a new concept in Philippine agriculture. As with poultry, the scheme involves an agreement between the commercial producers of pigs and the growers.^ Tlie commercial
producers are referred to as the owner in the contract. The growers, on the other hand, could be small pig raisers, or unemployed persons with or without experience in pig raising, or others with whom the owner feels it worthwhile entering into a contract. But unlike poultry, a piggery
contract growing agreement has not yet been imposed as a condition by the Board of Investments (BOI) to registered corporations engaged in pig
8
production, as well as to those corporations seeking registration.
2.2.1 Highlights of the contract
At present there is a single BOI registered piggery project
9 10 practising contract growing. In brief, the contract stipulated the
following:
1. The grower has to post a Surety Bond equivalent to P500 per head for the quantity desired to grow. In the event that a surety bond cannot be arranged by the grower, he has to mortgage a titled property located within a city, preferably within the Greater Manila area, with a value corresponding
to the required bond.
2. The grower has to provide the land, buildings, facilities, skill, labour and security for the farm.
7. The commercial producers of pigs are those corporations engaged in breeding and production of pigs.
8. In poultry, the BOI required all registered companies to contract grow at least 60 per cent of their broiler production. The same condition is applied to those seeking registration, i.e., they can be registered only if they would practise contract growing.
9. Republic Flour Mills Corporation started their piggery contract growing scheme in 19 75.
34^
3. The owner has to provide the weanlings, both sexes and two months old, with initial weight ranging from 10-18 kilos. The owner has also to provide about 2.3 kilos of medicine
(water soluble) per 100 head, veterinary services, and 272 kilos of feeds per head for a period of four months.
For and in consideration of growing the pigs for four months, the owner has to pay the grower P35 per head of 80 kilo
liveweight and P6 per kilo in excess of 80 kilo liveweight. However, a penalty of P6 per kilo below 80 kilos is imposed by the owner.
5. The grower is allowed a 1 per cent mortality allowance. Mortality beyond allowed percentage is chargeable to the
grower, value computed at the age of the animal.
6. Weighing of marketable pigs has to be done at the owner's dressing and processing plant.
7. Weanlings, feeds, and other supplies are delivered to the contract grower's farm free of charge and finished hogs are picked up also free of charge.
2.2.2 Pros and cons of contract growing
Piggery contract growing agreements, as with poultry, have advantages and disadvantages both from the owner's and growers' viewpoints. These advantages and disadvantages are discussed below (Yalong, 1973) :
The owner - The owner often feels that saving can be made by better labour efficiency and flock management rather than through contract growing. While this contention may be true for an inefficient contract grower, it would not hold true for efficient ones. Company labour will not necessarily be more efficient than contract growers. These matters still lie in individual performance.
35
factor that needs consideration in substituting company labour for contract growers is fringe b e n e f i t s . Contract growers do not get any
fringe b e n e f i t s . Company labour might ask for and get such benefits as h o s p i t a l i z a t i o n , insurance, social security payments, vacations,
retirement p l a n s , workmen's compensation, e t c . The threat of labour unions organizing workers in the company is another consideration.
The grower - The advantages of being a contract grower are as follows:
1. It allows the grower to stretch a given amount of investment capital into a large business by concentrating his money on equipment and buildings (fixed capital) and forgetting about
the prices of w e a n l i n g s , feeds, and other piggery supplies
(operating capital). For a given amount of investment capital, a pig raiser can also finance a larger expansion under a
contract than he could without one.
2 . Contracting reduces the risk of price fluctuations since the grower is paid a guaranteed rate.
3. Contracting furnishes the grower with up-to-date technical information. The owner is usually aware of the latest developments and can make this information available to growers through his servicemen. He can also force adoption of better husbandry practices.
4 . It makes the job of decision-making easier for the growers. Decisions such as breed to be used, feeds, vaccination and medication are made by the owner. And the decisions are made by men w h o have more information available than the growers. 5 . It provides an outlet for all the produce. Marketing is not
36
6. Contracting may result in the organization of a more
efficient system of production and marketing than existed before.
7. It enables a man with no previous experience to get into business and have a better chance of success than if he were on his own. Under supervision of the owner, he can
learn the latest husbandry techniques and have access to the latest technology.
8. There is maximum utilization of buildings, equipment and labour because of the stable and assured supply of pigs. It is the practice of some raisers to decrease their
pig population during certain periods of the year to avoid glut and low prices in the market. As a consequence, the buildings, equipment and labourers are not fully utilized. The following is a brief look at some disadvantages of being a contract grower:
1. Returns to a top-notch grower are quite apt to be lower under contract than if he were on his own.
2. Under certain situations and for growers with high managerial ability, contracts may not reduce or
eliminate overall risks such as those which would result from dealing with an owner who is not a good businessman, manager or decision-maker.
Another risk is the termination of the grower's contract, for one reason or another, long before his building and equipment are paid for.
3. The o w n e r ' s s e r v i c e m a n can p o s s i b l y be a d i s e a s e c a r r i e r .
If d i s e a s e s t r i k e s b e c a u s e of the s e r v i c e m a n , it c o u l d
h a v e d r a s t i c r e s u l t s s i n c e o u t b r e a k s are u s u a l l y c o n s i d e r e d
the fault of the g r o w e r .
W h e t h e r c o n t r a c t i n g b e c o m e s an i m p o r t a n t a s p e c t of the s w i n e
i n d u s t r y in the P h i l i p p i n e s w i l l d e p e n d to a great e x t e n t upon the
p r o f i t a b i l i t y of c o n t r a c t g r o w i n g . If it b e c o m e s more r e m u n e r a t i v e to
the o w n e r , then o t h e r c o r p o r a t i o n s e n g a g e d in pig r a i s i n g w i l l b e
38
CHAPTER 3
THE ANALYTICAL FRAMEWORK AND METHODOLOGY
In project analysis there is a critically important distinction to be kept in mind between two complementary points of v i e w . For any
p r o j e c t , we are interested, in the first instance, in the total return or p r o d u c t i v i t y , or profitability to the whole society or economy of all the resources committed to the project regardless of w h o in the society contributes them, and regardless of who in the society receives the b e n e f i t s . This is the social or economic return of the p r o j e c t , and we determine it by applying w h a t we w i l l term economic analysis.
In contrast, each of the individual financial entitles which
participates in a project - farmers, b u s i n e s s m e n , entrepreneurs, private c o r p o r a t i o n s , and public agencies - is properly concerned about the
return to the equity capital which it contributes. We may consider this the financial return to an equity participation in a p r o j e c t , and we determine it through what w e w i l l term financial analysis or private return (Gittinger, 1972).
The technique of cost-benefit analysis, involving comparisons of discounted cash f l o w s , is the main analytical tool employed in the study. Discussions of investment criteria, sensitivity analyses, and evaluation criteria are included in this chapter.
Another aspect of the study is shadow pricing benefits and cost components of a p r o j e c t . This is explained in Chapter 5 in relation to assessment from the social v i e w p o i n t . The shadow price or accounting price is the market price adjusted to allow for the effects of
changes in subsidy programs, the effects of price support activities, and the effects of changes in supply and demand conditions in general
(McKean, 1958).
3.1 Cost-Benefit Analysis
Cost-benefit analysis is a way of setting out the factors which need to be taken into account in making certain economic choices. It can also be applied to proposed changes in laws or regulations, to new pricing
schemes and the like. Cost-benefit analysis has long been considered as the most practical way of assessing long-term investment projects (Prest and Turvey, 1965). It takes into account the timing of cash flows,
whereby it is recognized that an amount received or spent now is worth more than the same amount received or spent at some point of time in the future.
Cost-benefit analysis implies enumeration and evaluation of all the relevant benefits and costs to determine whether the net benefits are at least as great as those obtainable from other marginal investment opportunities. It involves choice which implies maximization of the present value of all benefits less that of all costs, subject to any specific constraints. This approach can be applied to both public and private sector projects, with differences in application depending on the viewpoint taken.
Investment criteria - The cost-benefit analysis approach is applied to assess the desirability of a piggery contract growing scheme in the Philippines. Several investment criteria^ are used in appraising the project from both the private (i.e., owner's and growers') and social viewpoints, to wit: