• * * • + • •
Theme 2
Economy and finance
Series Β
Short-term statistics
ISSN 1024-4239
m
eurostat
ECU-EMS Information
& Central Bank Interest Rates
3 D 1998
Monthly
Bilateral fluctuations of the ERM currencies
Graph 1 on page 5 shows the trends in the bilateral fluctuation of ERM currencies between 2 January 1998 and 27 February 1998 calculated on a daily basis.
This graph shows that during the whole period under consideration, there was relative stability in the ERM. The IEP was the strongest currency in the ERM grid for the seventeenth month in succession. The graph also shows that during the first week of January the IEP lost significant ground against the DEM and the other ERM currencies, resulting in the width of the band within which all ERM currencies moved to decrease considerably from 5.92% on 2 January to 2.99% on 9 January. From 12 January onwards, the IEP recovered slightly against the DEM and the other ERM currencies, then showed little further movement until the end of the period under consideration. The width of the band within which all ERM currencies moved, decreased slightly from 2.99% on 9 January to 2.78% on 27 February 1998. The graph shows that from 12 January the BEF, followed very narrowly by the NLG, DEM and the ATS, was in a relatively weak position against the other ERM currencies.
By the end of February, all ERM currencies but the IEP moved within a band of 0.51% which is slightly wider than at the end of the previous month (0.47%, if the IEP is excluded).
Central bank interest rates
During February changes to key interest rates focused attention on Iberia, where the Bank of Spain reduced its primary official rate, the repo rate, in conjunction with the tendering procedure of 13 February. The rate was cut from 4.75% to an all-time low of 4.50%. The last time the rate went down was in December 1997.
This change brought the Spanish rates closer to those of its European partners. The repo rate in Germany, for example, stands at 3.30%.
The Bank of Portugal also cut its official interest rates in February. At the start of the month the repo rate was reduced from 5.3% to 5.1% and later in the month on 26 February, the first day of the period for constituting banks' statutory reserves, the Portuguese central bank trimmed its other key rates. The rate for liquidity-absorption operations was reduced by 20 basis points, to stand at 4.60%, while the emergency lending rate was also cut by 20 points and is now 6.6%. As in Spain, these rate cuts, prompted by encouraging inflation figures, brought the Portuguese rates closer to those of its European partners.
eurostat
STATISTICAL OFFICE OF THE EUROPEAN COMMUNITIES
L-2920 Luxembourg — Tél. 4301-1 — Télex COMEUR LU 3423
B-1049 Bruxelles, rue de la Loi 200 — Tél. 299 1111
Note
For any
TEL:
FAX:
information on the statistics
+352 434020-20
+352 434020-22 ou 25
+4301-32929
in this bulletin contact Luxembourg:
ASCOLI L./SCHMITZ R.
WARTON-WOODS S. / DELOBBE O.
(Central Bank Interest Rates)
EUROSTAT
Monetary and Financial Statistics
Jean Monnet Building
APC C4/04
L-2920 Luxembourg
© European Communities, 1998
Reproduction is authorized provided the source is acknowledged.
TABLE OF CONTENTS
Comments 1
European Monetary System
Table I. Central rates and intervention limit rates 4
Graph 1. Bilateral fluctuations of the ERM currencies 5
Graph 2. Divergence indicator of the ERM currencies 5
ECU exchange rates
Table II. ECU exchange rates 6
Change in the purchasing power of the ECU
Table III. Harmonised indices of consumer prices adjusted for ECU exchange rate changes 8
Table IV. Non-Harmonised indices of consumer prices adjusted for ECU exchange rate changes —-10
ECU bond market
Table V. ECU bond issues 12
Table VI. Last month's ECU bond issues 12
Table VII. Outstanding amount of ECU bonds 13
Table VIII. Total of the secondary market turnover and % of market taken by ECU securities 13
ECU interest rates
Table IX. Operation rates of the EMI and interest rates and yields of ECU investments 14
Graph 3. ECU yield curve 15
Graph 4. Evolution of ECU yields 15
Central bank interest rates
Table X. Central Bank interest rates 16
Graphs Evolution of central bank interest rates over the last 12 months 19
eurostat TABLE I
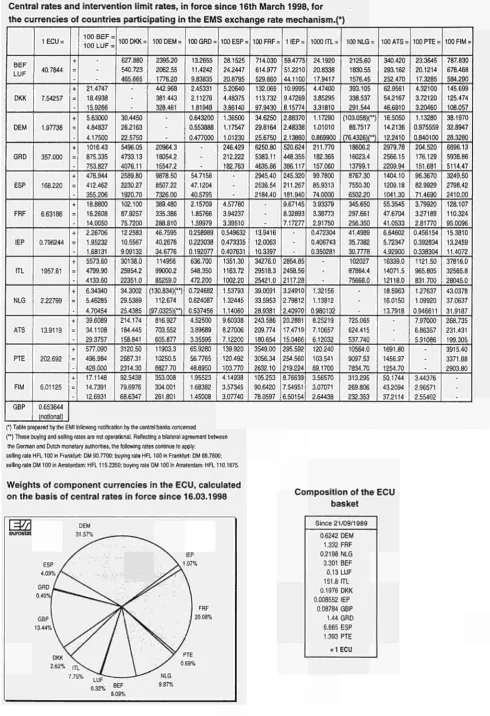
Central rates and intervention limit rates, in force since 16th March 1998, for the currencies of countries participating in the EMS exchange rate mechanism.(*)
BEF LUF DKK DEM GRD ESP FRF IEP ITL NLG ATS PTE FIM GBP 1ECU = 40.7844 7.54257 1.97738 357.000 168.220 6.63186 0.796244 1957.61 2.22799 13.9119 202.692 6.01125 0.653644 (notional) + + + + + + + + + + + +
100 BEF = 100 LUF =
-21.4747 18.4938 15.9266 5.63000 4.84837 4.17500 1016.43 875.335 753.827 478.944 412.462 355.206 18.8800 16.2608 14.0050 2.26706 1.95232 1.68131 5573.60 4799.90 4133.60 6.34340 5.46285 4.70454 39.6089 34.1108 29.3757 577.090 496.984 428.000 17.1148 14.7391 12.6931
100 DKK =
627.880 540.723 465.665
-30.4450 26.2163 22.5750 5496.05 4733.13 4076.11 2589.80 2230.27 1920.70 102.100 87.9257 75.7200 12.2583 10.5567 9.09132 30138.0 25954.2 22351.0 34.3002 29.5389 25.4385 214.174 184.445 158.841 3120.50 2687.31 2314.30 92.5438 79.6976 68.6347
100 DEM =
2395.20 2062.55 1776.20 442.968 381.443 328.461
-20964.3 18054.2 15547.2 9878.50 8507.22 7326.00 389.480 335.386 288.810 46.7595 40.2676 34.6776 114956 99000.2 85259.0 (130.834)Π 112.674 (97.0325H") 816.927 703.552 605.877 11903.3 10250.5 8827.70 353.008 304.001 261.801
100 GRD =
13.2655 11.4242 9.83835 2.45331 2.11276 1.81948 0.643200 0.553888 0.477000
-54.7156 47.1204 40.5795 2.15709 1.85766 1.59979 0.258989 0.223038 0.192077 636.700 548.350 472.200 0.724682 0.624087 0.537456 4.52500 3.89689 3.35595 65.9280 56.7765 48.8950 1.95523 1.68382 1.45008
100 ESP =
28.1525 24.2447 20.8795 5.20640 4.48375 3.86140 1.36500 1.17547 1.01230 246.429 212.222 182.763
-4.57780 3.94237 3.39510 0.549632 0.473335 0.407631 1351.30 1163.72 1002.20 1.53793 1.32445 1.14060 9.60338 8.27006 7.12200 139.920 120.492 103.770 4.14938 3.57345 3.07740
100 FRF =
714.030 614.977 529.660 132.066 113.732 97.9430 34.6250 29.8164 25.6750 6250.80 5383.11 4635.86 2945.40 2536.54 2184.40
-13.9416 12.0063 10.3397 34276.0 29518.3 25421.0 39.0091 33.5953 28.9381 243.586 209.774 180.654 3549.00 3056.34 2632.10 105.253 90.6420 78.0597 11EP = 59.4775 51.2210 44.1100 10.9995 9.47269 8.15774 2.88370 2.48338 2.13860 520.624 448.355 386.117 245.320 211.267 181.940 9.67145 8.32893 7.17277
-2854.85 2458.56 2117.28 3.24910 2.79812 2.40970 20.2881 17.4719 15.0466 295.592 254.560 219.224 8.76639 7.54951 6.50154
1000 ITL =
24.1920 20.8338 17.9417 4.47400 3.85295 3.31810 1.17290 1.01010 0.869900 211.770 182.365 157.060 99.7800 85.9313 74.0000 3.93379 3.38773 2.91750 0.472304 0.406743 0.350281
-1.32156 1.13812 0.980132 8.25219 7.10657 6.12032 120.240 103.541 89.1700 3.56570 3.07071 2.64438
100 NLG =
2125.60 1830.55 1576.45 393.105 338.537 291.544 (103.058)(") 88.7517 (76.4326)(") 18606.2 16023.4 13799.1 8767.30 7550.30 6502.20 345.650 297.661 256.350 41.4989 35.7382 30.7778 102027 87864.4 75668.0
-725.065 624.415 537.740 10564.0 9097.53 7834.70 313.295 269.806 232.353
100 ATS =
340.420 293.162 252.470 62.9561 54.2167 46.6910 16.5050 14.2136 12.2410 2979.78 2566.15 2209.94 1404.10 1209.18 1041.30 55.3545 47.6704 41.0533 6.64602 5.72347 4.92900 16339.0 14071.5 12118.0 18.5963 16.0150 13.7918
-1691.80 1456.97 1254.70 50.1744 43.2094 37.2114
100 PTE =
23.3645 20.1214 17.3285 4.32100 3.72120 3.20460 1.13280 0.975559 0.840100 204.520 176.129 151.681 96.3670 82.9929 71.4690 3.79920 3.27189 2.81770 0.456154 0.392834 0.338304 1121.50 965.805 831.700 1.27637 1.09920 0.946611 7.97000 6.86357 5.91086
-3.44376 2.96571 2.55402
100 FIM =
787.830 678.468 584.290 145.699 125.474 108.057 38.1970 32.8947 28.3280 6896.13 5938.86 5114.47 3249.50 2798.42 2410.00 128.107 110.324 95.0096 15.3810 13.2459 11.4072 37816.0 32565.8 28045.0 43.0378 37.0637 31.9187 268.735 231.431 199.305 3915.40 3371.88 2903.80
(') Table prepared by the EMI following notification by the central banks concerned. (") These buying and selling rates are not operational. Reflecting a bilateral agreement between the German and Dutch monetary authorities, the following rates continue to apply: selling rate HR 100 in Frankfurt: DM 90.7700; buying rate HFL 100 in Frankfurt: DM 86.7800; selling rate DM 100 In Amsterdam: HFL 115.2350; buying rate DM 100 in Amsterdam: HFL 110.1675.
Weights of component currencies in the ECU, calculated
\m
eurostat
Graph 1 : Bilateral fluctuations of the ERM currencies
-7% -L -7%
2-1-98 16-1-98 30-1-98 13-2-98 27-2-98
Graph 2: Divergence indicator
75
T-60
45
-
3015
-15
---30
-45
---60
-75 02-01-98
75
60
--45
-- 30
15
-- -15
ATS DKK
NLG
16-01-98 30-01-98 13-02-98
-30
+ -45
-60
ns
[image:6.595.71.552.81.678.2]eurostat
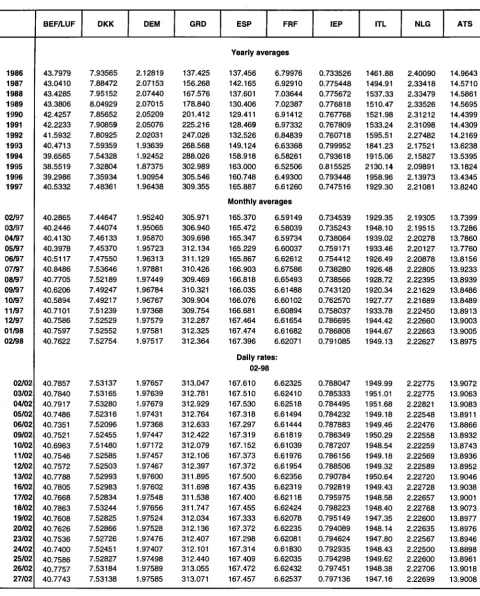
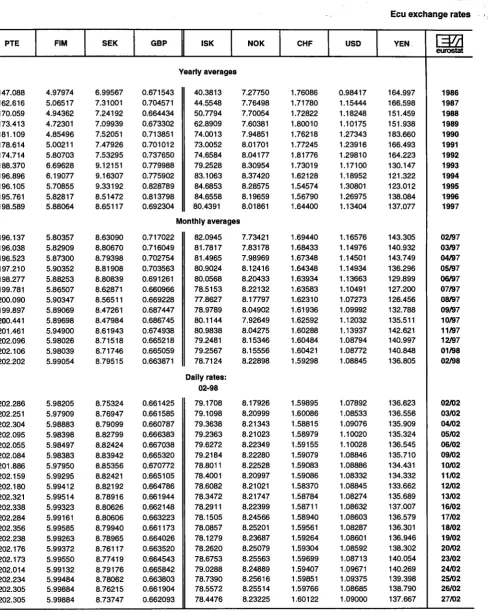
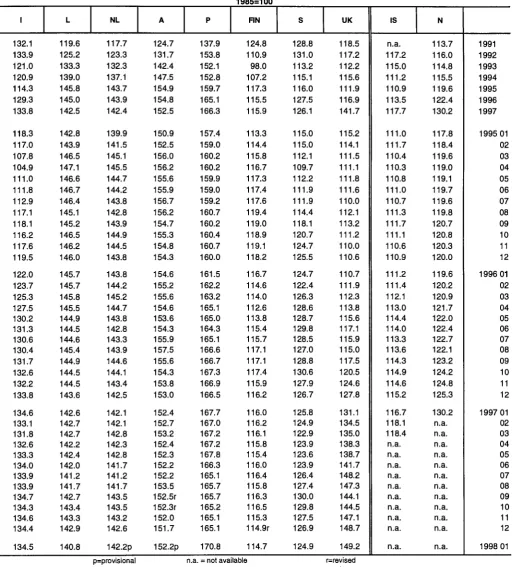
TABLE II
Ecu exchange rates
1986 1987 1988 1989 1990 1991 1992 1993 1994 1995 1996 1997 02/97 03/97 04/97 05/97 06/97 07/97 08/97 09/97 10/97 11/97 12/97 01/98 02/98 02/02 03/02 04/02 05/02 06/02 09/02 10/02 11/02 12/02 13/02 16/02 17/02 18/02 19/02 20/02 23/02 24/02 25/02 26/02 27/02 BEF/LUF 43.7979 43.0410 43.4285 43.3806 42.4257 42.2233 41.5932 40.4713 39.6565 38.5519 39.2986 40.5332 40.2865 40.2446 40.4130 40.3978 40.5117 40.8486 40.7705 40.6206 40.5894 40.7101 40.7586 40.7597 40.7622 40.7857 40.7840 40.7917 40.7486 40.7351 40.7521 40.6963 40.7546 40.7572 40.7788 40.7805 40.7668 40.7863 40.7608 40.7626 40.7536 40.7400 40.7586 40.7757 40.7743 DKK 7.93565 7.88472 7.95152 8.04929 7.85652 7.90859 7.80925 7.59359 7.54328 7.32804 7.35934 7.48361 7.44647 7.44074 7.46133 7.45370 7.47550 7.53646 7.52189 7.49247 7.49217 7.51239 7.52529 7.52552 7.52754 7.53137 7.53165 7.53280 7.52316 7.52096 7.52455 7.51480 7.52585 7.52503 7.52993 7.52983 7.52834 7.53244 7.52825 7.52866 7.52726 7.52451 7.52827 7.53184 7.53138 DEM 2.12819 2.07153 2.07440 2.07015 2.05209 2.05076 2.02031 1.93639 1.92452 1.87375 1.90954 1.96438 1.95240 1.95065 1.95870 1.95723 1.96313 1.97881 1.97449 1.96784 1.96767 1.97368 1.97579 1.97581 1.97517 1.97657 1.97639 1.97679 1.97431 1.97368 1.97447 1.97172 1.97457 1.97467 1.97600 1.97602 1.97548 1.97656 1.97524 1.97528 1.97476 1.97407 1.97498 1.97589 1.97585 GRD 137.425 156.268 167.576 178.840 201.412 225.216 247.026 268.568 288.026 302.989 305.546 309.355 305.971 306.940 309.698 312.134 311.129 310.426 309.469 310.321 309.904 309.754 312.287 312.325 312.364 313.047 312.781 312.929 312.764 312.633 312.422 312.079 312.106 312.397 311.895 311.698 311.538 311.747 312.034 312.136 312.407 312.101 312.440 313.055 313.071
ESP FRF
Wà
[image:7.595.24.513.68.681.2]eurostat
TABLE II Ecu exchange rates
PTE 147.088 162.616 170.059 173.413 181.109 178.614 174.714 188.370 196.896 196.105 195.761 198.589 196.137 196.038 196.523 197.210 198.277 199.781 200.090 199.897 200.441 201.461 202.096 202.106 202.202 202.286 202.251 202.304 202.095 202.055 202.084 201.886 202.159 202.180 202.321 202.338 202.284 202.356 202.238 202.176 202.173 202.014 202.234 202.305 202.305 FIM 4.97974 5.06517 4.94362 4.72301 4.85496 5.00211 5.80703 6.69628 6.19077 5.70855 5.82817 5.88064 5.80357 5.82909 5.87300 5.90352 5.88253 5.86507 5.90347 5.89069 5.89698 5.94900 5.98026 5.98039 5.99054 5.98205 5.97909 5.98883 5.98398 5.98497 5.98383 5.97950 5.99295 5.99412 5.99514 5.99323 5.99161 5.99585 5.99263 5.99372 5.99550 5.99132 5.99484 5.99884 5.99884 SEK 6.99567 7.31001 7.24192 7.09939 7.52051 7.47926 7.53295 9.12151 9.16307 9.33192 8.51472 8.65117 8.63090 8.80670 8.79398 8.81908 8.80839 8.62871 8.56511 8.47261 8.47984 8.61943 8.71518 8.71746 8.79515 8.75324 8.76947 8.79099 8.82799 8.82424 8.83942 8.85356 8.82421 8.82192 8.78916 8.80626 8.80606 8.79940 8.78965 8.76117 8.77419 8.79176 8.78062 8.76215 8.73747
GBP ISK NOK
TABLE III
Change in the purchasing power of the ECU
(Harmonised indices of consumer prices adjusted for ECU exchange rate changes)
1996=100 1995 1996 1997 1995 01 02 03 04 05 06 07 08 09 10 11 12 1996 01 02 03 04 05 06 07 08 09 10 11 12 1997 01 02 03 04 05 06 07 08 09 10 11 12 1998 01 EUR 15 96.60Γ 100.0 102.9 96.1 C 96.3 95.50 95.50 96.3 96.50 96.40 97.1 97.50 97.20 97.4 97.90 98.00 98.5 99.10 99.60 100.2 100.30 100.10 100.0 100.50 101.00 101.1 101.60 102.0 102.1 102.1 102.4 102.7 102.9 103.3 103.4 103.5 103.5 103.6 103.8 103.6p ERM* 99.8 100.0 99.9 97.60 98.5 99.40 100.10 99.9 100.10 100.30 100.0 100.10 100.30 100.5 100.60 99.80 100.1 100.40 100.40 100.2 99.90 100.10 100.2 100.10 99.90 99.6 100.10 100.2 99.9 99.9 99.7 100.0 99.9 99.4 99.7 100.2 100.2 100.0 100.0 99.8p ECU 98.50 100.0 101.8 97.10 97.6 98.20 98.60 98.5 98.70 98.60 98.6 98.90 98.90 99.0 99.10 98.90 99.3 99.80 100.00 100.1 100.10 100.00 100.0 100.30 100.50 100.5 100.70 101.0 101.2 101.3 101.4 101.7 101.8 102.0 102.2 102.2 102.2 102.4 102.4 102.2p Β 100.2 100.0 98.4 98.1 98.9 100.6 101.1 100.7 100.7 100.7 100.1 100.0 100.5 100.4 100.4 100.5r 100.5r 100.5 100.5 100.2r 99.8 99.7 100.2 100.0 99.8 99.4 99.1 99.0 98.7 98.4 98.3 98.8 98.5 97.9 97.9 98.4 98.6 98.4 98.0 98.1 DK 98.4r 100.0 100.3 95.3r 96.1 r 96.9r 98.9r 99.3r 99.2r 98.7r 98.5r 99.0r 99.7r 99.7Γ 99.6r 99.2 99.7 100.2 100.1 99.8 99.8 99.8 100.2 100.6 100.6 100.2r 99.8 99.7Γ 99.9r 100.3r 100.2r 101 .Or 100.9r 99.5r 99.9 100.7 100.6 100.4 100.0Γ 100.1 D 100.7 100.0 98.6 98.3 99.5 101.4 101.6 101.3 101.4 101.4 100.4 100.3 101.0 100.6 100.7 100.4 100.8 100.6 100.1 99.9 99.9 100.3 100.7 100.0 99.5 99.0 98.7 98.8 99.0 99.0 98.5 98.9 98.8 98.3 98.6 98.7 98.6 98.2 98.3 98.3 EL 93.5 100.0 104.1 92.3 91.4 92.3 93.2 94.2 94.8 92.5 92.8 94.6 94.2 93.9 95.1 94.7 94.1 97.6 99.8 101.5 101.9 100.2 99.5 101.9 103.4 102.6 103.0 102.7 102.1 104.2 104.2 103.8 104.6 102.6 103.2 104.7 105.3 105.8 106.2 104.8 E 95.3 100.0 98.7 92.7 93.3 91.1 93.0 95.2 95.8 96.3 96.8 96.6 96.5 97.3 98.4 99.5 99.7 99.9 101.0 100.8 99.6 99.7 100.0 100.5 100.1 99.7 99.5 99.5 98.4 98.4 98.5 98.6 98.3 97.8 98.4 99.3 99.3 99.0 99.1 99.0 F 97.5 100.0 99.4 95.8 96.1 96.5 97.6 96.5 97.0 97.5 98.3 98.4 98.0 99.1 99.0 99.3 99.3 100.2 100.7 100.7 100.3 100.3 99.8 99.9 100.3 99.7 99.6 99.4 99.5 99.8 99.5 99.6 99.2 98.3 98.9 99.7 99.8 99.9 99.8 99.4 IRL 95.20 100.0 107.4 95.80 95.5 93.70 94.00 95.1 95.20 94.60 95.9 96.40 95.30 95.0 95.60 95.80 96.6 97.00 97.70 99.2 100.10 99.80 99.9 101.40 102.10 104.2 106.60 106.8 108.9 108.9 108.6 105.6 106.6 108.7 108.3 108.2 105.6 106.6 106.2 102.3 I 88.5 100.0 103.4 91.4 90.4 83.4 81.3 86.0 86.6 87.5 90.6 91.4 89.9 91.0 92.5 94.4 95.7 97.1 98.7 100.9 101.6 101.1 100.9 101.9 102.6 102.2 103.5 104.0 102.8 102.0 102.6 103.2 103.6 103.6 103.4 104.0 104.0 104.0 103.9 103.8 L 100.8 100.0 98.3 98.7 99.6 101.3 101.7 101.3 101.4 101.1 100.2 100.4 101.2 101.2 101.0 100.7 100.7 100.6 100.3 99.9 99.7 99.8 100.4 100.0 99.5 99.4 98.9 98.5 98.5 98.5 98.1 98.2 98.1 97.4 97.8 98.5 98.7 98.6 98.4 98.5 p=provisional n.a. = not available r=revised i=estimatedm
TABLE III
Change in the purchasing power of the ECU
(Harmonised indices of consumer prices adjusted for ECU exchange rate changes)
1996=100 NL 100.5 100.0 98.6 98.0 99.2 101.9 102.2 101.6 101.2 100.2 99.5 100.4 101.1 100.8 100.1 99.9 100.4 101.4 101.2 100.4 99.6 99.3 99.6 100.3 99.9 99.3 98.7 98.1 98.1 99.0 98.8 99.0 98.1 97.4 97.9 99.3 99.4 99.1 98.6 98.0p A 100.2 100.0 98.3 98.2 99.0 101.1 101.1 100.8 100.8 100.6 99.8 99.8 100.4 100.2 99.9 100.6 100.8 100.9 100.3 99.7 99.9 100.1 100.3 99.8 99.4 99.3 99.1 98.5 98.8 99.0 98.5 98.6 98.3 97.5 97.8 98.1 98.2 98.2 98.3 98.3p Ρ 97.0 100.0 100.5 95.7 96.5 97.2 97.3 97.1 96.6 96.6 97.5 97.2 97.2 97.4 97.2 98.3 98.5 98.9 100.0 99.8 99.5 100.0 100.9 101.0 101.2 101.0 100.7 101.5 101.0 101.2 101.0 101.3 100.5 99.8 100.1 100.1 99.7 99.7 99.7 99.5 FIN 101.0 100.0 100.3 98.0 98.9 100.0 100.6 101.2 101.0 101.2 102.7 102.3 102.2 102.3 101.6 100.7 99.0 98.6 97.4 98.5 99.9 100.3 101.3 101.3 101.5 100.3 100.7 100.6 100.6 100.5 100.1 99.9 100.4 100.7 100.3 100.6 100.7 99.7 99.3 99.3 S 90.7 100.0 100.2 89.9 90.0 87.8 85.9 87.8 87.5 87.3 89.4 92.4 94.3 97.5 98.1 97.1 95.4 98.6 100.6 100.9 101.8 100.8 99.8 101.4 102.9 100.8 100.0 99.6 99.0 97.6 98.4 98.3 98.4 100.2 101.1 103.5 103.5 101.6 101.2 100.1 UK 95.70 100.0 119.7 98.8 97.7 95.7 95.0 95.6 95.3 93.9 95.7 96.7 95.2 94.1 94.7 94.9 95.8 96.3r 97.4 99.0 100.3 99.0r 98.4 100.6 103.0r 106.6 109.2 111.7 114.4 114.8 117.3r 117.6 119.9 125.0Γ 124.1 121.2 121.4 123.6Γ 124.9 124.8 IS 97.8 100.0 107.2 97.7 98.2 97.2 97.4 97.8 97.9 97.7 98.2 98.3 98.0 97.6 97.8 97.9 98.2 98.8 99.9 100.8 100.6 99.9 100.0 100.4 101.1 100.9 101.5 102.8 104.0 104.4 105.7 106.2 107.4 109.7 110.9 109.8 108.7 107.4 108.9 110.0 Ν 98.2 100.0 104.9 96.9 97.4 98.4 97.8 98.0 98.4 98.2 98.3 99.0 99.1 98.7 98.3 97.7 98.3 98.7 99.4 99.7 100.0 100.3 99.7 100.5 101.5 101.9 102.3 106.6 108.4 107.4 105.0 103.5 102.7 102.0 102.4 104.5 106.4 105.0 104.8 104.1
C H *
100.6 100.0 95.9 96.3 97.1 100.6 101.9 100.6 100.9 100.0 99.9 101.8 102.9 102.9 102.6 102.5 101.7 102.3 101.7 100.0 99.5 99.8 101.6 100.4 99.3 96.4 94.6 93.2 93.1 93.6 94.3 95.7 96.1 96.1 97.1 97.3 97.0 98.2 98.6 98.3 US* 94.3 100.0 114.7 98.0 97.0 93.0 91.6 93.2 92.7 91.8 94.9 96.3 94.1 93.9 95.3 96.7 97.3 98.4 100.0 101.6 101.2 100.0 99.2 100.6 101.8 100.5 102.7 105.9 110.9 112.6 113.2 112.8 114.1 117.6 121.3 118.7 116.7 114.8 117.4 120.2
J P *
112.7 100.0 102.7 111.5 111.2 115.4 122.7 123.2 122.7 117.2 111.6 107.0 103.6 102.1 103.6 100.7 100.8 101.3 102.1 104.5 101.3 99.4 99.6 99.3 98.1 96.5 97.2 96.5 96.3 97.9 98.0 103.7 108.7 110.6 111.4 106.8 104.9 99.0 97.9 100.0 1995 1996 1997 1995 01 02 03 04 05 06 07 08 09 10 11 12 1996 01 02 03 04 05 06 07 08 09 10 11 12 1997 01 02 03 04 05 06 07 08 09 10 11 12 1998 01 p=provisional
* Important: This data
n.a. = not available r=revised
\3ΖΔ
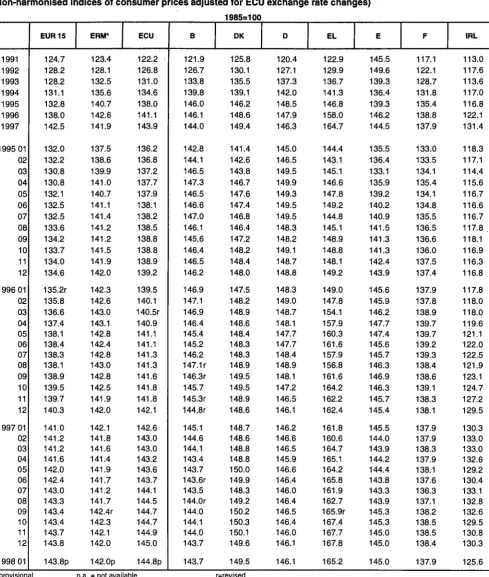
eurostatTABLE IV
Change in the purchasing power of the ECU
(Non-harmonised indices of consumer prices adjusted for ECU exchange rate changes)
1985=100 1991 1992 1993 1994 1995 1996 1997 1995 01 02 03 04 05 06 07 08 09 10 11 12 1996 01 02 03 04 05 06 07 08 09 10 11 12 1997 01 02 03 04 05 06 07 08 09 10 11 12 1998 01 EUR 15 124.7 128.2 128.2 131.1 132.8 138.0 142.5 132.0 132.2 130.8 130.8 132.1 132.5 132.5 133.6 134.2 133.7 134.0 134.6 135.2r 135.8 136.6 137.4 138.1 138.4 138.3 138.1 138.9 139.5 139.7 140.3 141.0 141.2 141.2 141.6 142.0 142.4 143.0 143.3 143.4 143.4 143.7 143.8 143.8p ERM* 123.4 128.1 132.5 135.6 140.7 142.6 141.9 137.5 138.6 139.9 141.0 140.7 141.1 141.4 141.2 141.2 141.5 141.9 142.0 142.3 142.6 143.0 143.1 142.8 142.4 142.8 143.0 142.8 142.5 141.9 142.0 142.1 141.8 141.6 141.4 141.9 141.7 141.2 141.7 142.4Γ 142.3 142.1 142.0 142.0p ECU 122.2 126.8 131.0 134.6 138.0 141.1 143.9 136.2 136.8 137.2 137.7 137.9 138.1 138.2 138.5 138.8 138.8 138.9 139.2 139.5 140.1 140.5r 140.9 141.1 141.1 141.3 141.3 141.6 141.8 141.8 142.1 142.6 143.0 143.0 143.2 143.6 143.7 144.1 144.5 144.7 144.7 144.9 145.0 144.8p Β 121.9 126.7 133.8 139.8 146.0 146.1 144.0 142.8 144.1 146.5 147.3 146.5 146.6 147.0 146.1 145.6 146.4 146.5 146.2 146.9 147.1 146.9 146.4 145.4 145.2 146.2 147.1 r 146.3Γ 145.7 145.3Γ 144.8Γ 145.1 144.6 144.1 143.4 143.7 143.6Γ 143.5 144.0r 144.0 144.1 144.0 143.7 143.7 DK 125.8 130.1 135.5 139.1 146.2 148.6 149.4 141.4 142.6 143.8 146.7 147.6 147.4 146.8 146.4 147.2 148.2 148.4 148.0 147.5 148.2 148.9 148.6 148.4 148.3 148.3 148.9 149.5 149.5 148.9 148.6 148.7 148.6 148.8 148.8 150.0 149.9 148.3 149.2 150.2 150.3 150.1 149.6 149.5 D 120.4 127.1 137.3 142.0 148.5 147.9 146.3 145.0 146.5 149.5 149.9 149.3 149.5 149.5 148.3 148.2 149.1 148.7 148.8 148.3 149.0 148.7 148.1 147.7 147.7 148.4 148.9 148.1 147.2 146.5 146.1 146.2 146.6 146.5 145.9 146.6 146.4 146.0 146.4 146.5 146.4 146.0 146.1 146.1 EL 122.9 129.9 136.7 141.3 146.8 158.0 164.7 144.4 143.1 145.1 146.6 147.8 149.2 144.8 145.1 148.9 148.8 148.1 149.2 149.0 147.8 154.1 157.9 160.3 161.6 157.9 156.8 161.6 164.2 162.2 162.4 161.8 160.6 164.7 165.1 164.2 165.8 161.9 162.7 165.9Γ 167.4 167.7 167.8 165.2 E 145.5 149.6 139.3 136.4 139.3 146.2 144.5 135.5 136.4 133.1 135.9 139.2 140.2 140.9 141.5 141.3 141.3 142.4 143.9 145.6 145.9 146.2 147.7 147.4 145.6 145.7 146.3 146.9 146.3 145.7 145.4 145.5 144.0 143.9 144.2 144.4 143.8 143.3 143.9 145.3 145.3 145.0 145.0 145.0 F 117.1 122.1 128.7 131.8 135.4 138.8 137.9 133.0 133.5 134.1 135.4 134.1 134.8 135.5 136.5 136.6 136.0 137.5 137.4 137.9 137.8 138.9 139.7 139.7 139.2 139.3 138.4 138.6 139.1 138.3 138.1 137.9 137.9 138.3 137.9 138.1 137.6 136.3 137.1 138.2 138.5 138.5 138.4 137.9 IRL 113.0 117.6 113.6 117.0 116.8 122.1 131.4 118.3 117.1 114.4 115.6 116.7 116.6 116.7 117.8 . 118.1 116.9 116.3 116.8 117.8 118.0 118.0 119.6 121.1 122.0 122.5 121.9 123.1 124.7 127.2 129.5 130.3 133.0 133.0 132.6 129.2 130.4 133.1 132.8 132.6 129.5 130.8 130.3 125.6p=provisional n.a. = not available r=revised
'Greece will be included in the March data
eurostat
TABLE IV
Change in the purchasing power of the ECU
(Non-harmonised indices of consumer prices adjusted for ECU exchange rate changes)
1985=100 I 132.1 133.9 121.0 120.9 114.3 129.3 133.8 118.3 117.0 107.8 104.9 111.0 111.8 112.9 117.1 118.1 116.2 117.6 119.5 122.0 123.7 125.3 127.5 130.2 131.3 130.6 130.4 131.7 132.6 132.2 133.8 134.6 133.1 131.8 132.6 133.3 134.0 133.9 133.9 134.7 134.3 134.6 134.4 134.5 L 119.6 125.2 133.3 139.0 145.8 145.0 142.5 142.8 143.9 146.5 147.1 146.6 146.7 146.4 145.1 145.2 146.5 146.2 146.0 145.7 145.7 145.8 145.5 144.9 144.5 144.6 145.4 144.9 144.5 144.5 143.6 142.6 142.7 142.7 142.2 142.4 142.0 141.2 141.7 142.7 143.4 143.3 142.9 140.8 NL 117.7 123.3 132.3 137.1 143.7 143.9 142.4 139.9 141.5 145.1 145.5 144.7 144.2 143.8 142.8 143.9 144.9 144.5 143.8 143.8 144.2 145.2 144.7 143.8 142.8 143.3 143.9 144.6 144.1 143.4 142.5 142.1 142.1 142.8 142.3 142.8 141.7 141.2 141.7 143.5 143.5 143.2 142.6 142.2p A 124.7 131.7 142.4 147.5 154.9 154.8 152.5 150.9 152.5 156.0 156.2 155.6 155.9 156.7 156.2 154.7 155.3 154.8 154.3 154.6 155.2 155.6 154.6 153.6 154.3 155.9 157.5 155.6 154.3 153.8 153.0 152.4 152.7 153.2 152.4 152.3 152.2 152.2 153.5 152.5r 152.3r 152.0 151.7 152.2p Ρ 137.9 153.8 152.1 152.8 159.7 165.1 166.3 157.4 159.0 160.2 160.2 159.9 159.0 159.2 160.7 160.2 160.4 160.7 160.0 161.5 162.2 163.2 165.1 165.0 164.3 165.1 166.6 166.7 167.3 166.9 166.5 167.7 167.0 167.2 167.2 167.8 166.3 165.1 165.7 165.7 165.2 165.1 165.1 170.8 FIN 124.8 110.9 98.0 107.2 117.3 115.5 115.9 113.3 114.4 115.8 116.7 117.3 117.4 117.6 119.4 119.0 118.9 119.1 118.2 116.7 114.6 114.0 112.6 113.8 115.4 115.7 117.1 117.1 117.4 115.9 116.2 116.0 116.2 116.1 115.8 115.4 116.0 116.4 115.8 116.3 116.5 115.3 114.9r 114.7 S 128.8 131.0 113.2 115.1 116.0 127.5 126.1 115.0 115.0 112.1 109.7 112.2 111.9 111.9 114.4 118.1 120.7 124.7 125.5 124.7 122.4 126.3 128.6 128.7 129.8 128.5 127.0 128.8 130.6 127.9 126.7 125.8 124.9 122.9 123.9 123.6 123.9 126.4 127.4 130.0 129.8 127.5 126.9 124.9 UK 118.5 117.2 112.2 115.6 111.9 116.9 141.7 115.2 114.1 111.5 111.1 111.8 111.6 110.0 112.1 113.2 111.2 110.0 110.6 110.7 111.9 112.3 113.8 115.6 117.1 115.9 115.0 117.5 120.5 124.6 127.8 131.1 134.5 135.0 138.3 138.7 141.7 148.2 147.3 144.1 144.5 147.1 148.7 149.2 IS n.a. 117.2 115.0 111.2 110.9 113.5 117.7 111.0 111.7 110.4 110.3 110.8 111.0 110.7 111.3 111.7 111.1 110.6 110.9 111.2 111.4 112.1 113.0 114.4 114.0 113.3 113.6 114.3 114.9 114.6 115.2 116.7 118.1 118.4 n.a. n.a. n.a. n.a. n.a. n.a. n.a. n.a. n.a. n.a. Ν 113.7 116.0 114.8 115.5 119.6 122.4 130.2 117.8 118.4 119.6 119.0 119.1 119.7 119.6 119.8 120.7 120.8 120.3 120.0 119.6 120.2 120.9 121.7 122.0 122.4 122.7 122.1 123.2 124.2 124.8 125.3 130.2 n.a. n.a. n.a. n.a. n.a. n.a. n.a. n.a. n.a. n.a. n.a. n.a. 1991 1992 1993 1994 1995 1996 1997 1995 01 02 03 04 05 06 07 08 09 10 11 12 1996 01 02 03 04 05 06 07 08 09 10 11 12 1997 01 02 03 04 05 06 07 08 09 10 11 12 1998 01
p=provisional n.a. = not available r=revised
sa
eurostat
TABLE V
ECU bond issues(*) (Mio ECU)
1991
1992 1993 1994 1995 1996 1997
1996 III IV
1997 I II III IV
1997 11 12
1998 01 02
TOTAL EURO
27 163
19 242 6 870 6 485 5 596 3 180 7 425
1 330 375
3 295 1 820 810 1 820Γ
200 470r
1 700 3 975
European Union
Total
19 266
11 675 5 020 5 010 5 046 3 180 6 425
1 330 375
3 295 1 670 810 970r
200 470r
1 700 3 575
Business sector 6 581
4 870 1 565 1 825 956 2 215 3 775
1 030 265
1 745 670 710 650
200 150
1 700 3 450
Govern ments 7 900
2 475 250 1 300 3 075 115
1 000
0
60
0 1 000 0 320r
0 320r
0 0
Institu tions 4 785
4 330 3 205 1 885 1 015 850 1 650
300 50
1 550 0 100 0
0 0
0
125
Non-European Union
Total
7 897
7 567 1 850 1 475 550 0
1 000
0 0
0 150 0 850
0 0
0
400
Business sector 3 932
3 902 250 1 075 550 0
600
0
0
0 150 0 450
0 0
0 0
Govern ments 3 790
2 850 1 600 400
0 0
400
0
0
0 0 0 400
0 0
0
400
Organi sations 175
815 0 0 0 0 0
0
0
0 0 0 0
0 0
0
0
Domestic**
3 134
4 151
6 508
7 311
6 784
8 216 10 205
1 905
1 991
2 574
2 160
3 451
2 020 313 404
779 435
EURO + DOMESTIC
30 297
23 393 13 378 13 796 12 380 11 396 17 630
3 235 2 366
5 869 3 985 4 261 3 840r
513 874r
2 479 4 4 1 0
(*) Recording based on the p=provisional
payment date r=revised
[image:12.595.44.557.33.704.2](**) Only domestic issues which can be assimilated with Eurobonds
TABLE VI
Last month's ECU bond issues(*)
Issue Payment
Date
06.02.1998 25.02.1998
06.02.1998 02.03.1998 05.02.1998 12.02.1998 10.02.1998 03.03.1998 11.02.1998 24.02.1998 24.02.1998 19.03.1998 23.02.1998 05.03.1998
25.02.1998
19.02.1998 04.03.1998
12.02.1998 26.02.1998
Borrowers country
BES Finance Ltd (Cayman Islands) (PO)
Landwirtschaftliche Rentenbank
France OAT
Federal Republic of Brazil
Abbey National Treasury Services (UK)
Parmalat Finance Corp
Merrill Lynch
SBC Jersey Branch
Kingdom of Spain
Republic of Italy
Amount Issued (Mio Ecu)
250
150
435
500
1000
270
300
75
1000
4000
Issue Price
100
101.152
99.9
99.863
101.513
100
99.475
100
98.813
98.047
Coupon
-4.75
5.25
8.625
4.875
1
5.125
1
6
5
Term (years)
3
5+9m
10+2m
5
5
7+9m
7
3
30+10m
10+3m
Maturity
25.02.2001
30.12.2003
25.04.2008
03.03.2003
24.02.2003
31.12.2005
05.03.2005
25.02.2001
31.01.2029
01.05.2008
Lead Manager
JP Morgan Paribas
BNP
Auct
Paribas SBC Warburg
Paribas Salomon
Paribas
Merill Lynch Paribas SBC Warburg
Dillon Read Barclays/CSFB
Deutsche Santander JP Morgan Paribas SBC Warburg
Dillon Read
Listing
LU
EMPI
PA
LX
LN
LU
LN
EMPI
LX
LX
Notice
-■
■
-(') See backpage for January's data
[image:12.595.45.556.59.364.2]L ^
[image:13.595.54.537.448.756.2]eurostat
TABLE VII
Outstanding amount of ECU bonds
(Mio ECU)
28/02/98 31/01/98 31/12/97 31/12/97 31/12/96 31/12/95 Issuers GOV SUPRA Others Total GOV SUPRA Others Total GOV SUPRA Others Total GOV SUPRA Others Total GOV SUPRA Others Total GOV SUPRA Others Total
Residual maturity in years
<1 21 241 2 435 4 702 28 378 16 241 2 245 4 437 22 923 15 491 2 220 4 877 22 588 15 491 2 220 4 877 22 588 9 254 3 512 5 437 18 203 12 526 3 047 6 963 22 536 1-3 19912 6 310 7 124 33 346
20 599 6 275 6 439 33 313 23 349 5 150 6 649 35 148 23 349 5 150 6 649 35 148
30 681 4 950 8 864 44 495 25 589 5 732 9 954 41 275 3-5 10 255 4 475 5 902 20 632 14 568 4 700 6 852 26120 14 568
5 850
6 652
27 070
14 568
5 850
6 652
27 070
13 927
6 620
6 474
27 021
19 483
5 150
6 099
30 732
5-7
6 592
2 000
3 868
12 460 6 592
2 000
3 768
12 360 6 592
2 000
3 698
12 290 6 592
2 000
3 698
12 290 6 929
1 500
1 632
10 061
10 746
4 900
4 337
19 983
7-10 13 094
700
2 230
16 024
13 094
700
2 290
16 084
11 594
700
2 360
14 654
11 594
700
2 360
14 654 9 992
700
2 436
13 128 7 468
700
1 438
9 606
>10
4 000
100 225
4 325 4 000
100 225
4 325 4 000
100 225
4 325 4 000
100 225
4 325 4 750
600 625
5 975 4 750
600
1 325
6 675
Total 75 093 16 020 24 051 115164 75 093 16 020 24 011 115124 75 593 16 020 24 461 116 074 75 593 16 020 24 461 116 074 75 533 17 882 25 468 118 883 80 562 20129 30116 130 807
GOV = Central governments SUPRA = Supranational institutions
TABLE VIII
Total secondary market turnover and % of market taken by ECU securities
(*)
1991 1992 1993 1994 1995 1996 1997 1996 12 1997 1 2 3 4 5 6 7 8 9 10 11 12 Turnover All currencies7 543 435 12 817 697 21 147 243 26 885 805 32 410 622 44 633 301 49 592 103
3 608 927
3 949 284 3 825 231 4 062 392 3 899 815 3 559 238 4 313 629 4 498 891 3 861 874 4 417 712 4 859 602 4 256 071 4 088 364
in millions of U S D
of which
ECU
1 299 480 1 795 023 1 396 407 1 760 679 2 281 559 2 040 722 1 567 883
137 257 174 392 150 546 135 394 154 051 127 621 144 345 136 725 105 739 108 832 126 777 105 222 98 239 USD
2 024 440 2 471 247 3 381 535 4 726 177 5 718 454 8 311 709 12 166 646
686 296 818 577 886 764 974 487 898 121 943 729 1 074 070 1 164 972 1 068 133 1 069 910 1 281 583 1 092 279
894 021 Eurobonds straights 25.69 23.15 11.14 11.16 8.45 5.67 3.11 4.64 4.45 4.37 2.56 4.81 3.34 3.28 3.01 2.94 2.03 1.94 2.38 3.26
% of market held by E C U securities by
Others straights 11.71 8.66 3.76 3.72 4.52 3.38 3.21 3.39 4.19 3.81 3.57 3.96 3.96 3.48 3.08 2.79 2.50 2.75 2.46 2.20 Converti-bles 1.26 2.76 1.78 1.20 0.77 0.92 0.40 0.13 0.31 0.49 0.52 0.56 0.68 0.21 0.97 0.13 0.14 0.40 0.11 0.10 Floating rate notes 2.49 3.94 1.96 0.69 1.48 1.18 0.69 1.05 0.99 0.80 0.82 1.07 0.57 0.61 0.41 0.44 0.74 0.71 0.78 0.43 instrument Certificates of deposit 4.52 6.47 6.70 0.34 0.37 0.00 0.00 0.00 0.00 0.00 0.00 0.00 0.00 0.00 0.00 0.00 0.00 0.00 0.00 0.00 Short- & med. term notes 19.30 20.83 17.22 23.65 26.95 16.98 5.75 9.54 10.00 7.54 6.26 5.48 5.03 5.74 5.54 4.66 4.84 5.16 4.77 4.56
(') Yearly figures are calculated as a total of quarterly figures; there may be some differences with the total of monthly data
TABLE IX
Interest rates and yields of ECU investments (%)
1992 1993 1994 1995 1996 1996 9 10 11 12 1997 1 2 3 4 5 6 7 8 9 10 11 12 1998 1 2 EMI* 10.29 8.21 5.92 5.88 4.35 4.25 4.00 4.00 4.00 4.00 3.75 3.75 4.00 4.00 4.00 4.00 4.00 4.00 4.00 4.25 4.25 4.25 4.25
Deposits (maturity in months)**
1 10.43 8.27 5.95 5.85 4.34 4.14 4.06 4.07 4.11 4.01 4.04 4.12 4.05 4.01 4.02 4.09 4.20 4.16 4.27 4.38 4.27 4.18 4.24 3 10.41 7.99 5.98 5.90 4.31 4.15 4.06 4.07 4.06 3.99 4.03 4.13 4.07 4.05 4.05 4.11 4.25 4.22 4.37 4.49 4.35 4.22 4.24 6 10.27 7.65 6.05 5.98 4.32 4.17 4.07 4.09 4.07 3.98 4.02 4.16 4.11 4.09 4.09 4.15 4.32 4.32 4.46 4.56 4.44 4.28 4.25 12 10.01 7.11 6.21 6.15 4.39 4.28 4.12 4.15 4.09 3.98 4.02 4.21 4.19 4.16 4.15 4.21 4.39 4.41 4.59 4.66 4.52 4.31 4.26
Yield on ECU bonds (maturity In years)
1 7.28 6.35 6.23 4.45 4.38 4.20 4.23 4.13 4.02 4.02 4.26 4.23 4.18 4.19 4.24 4.47 4.49 4.65 4.70 4.57 4.33 4.26 2 6.87 6.77 6.66 4.79 4.66 4.36 4.41 4.27 4.13 4.13 4.45 4.46 4.35 4.31 4.33 4.62 4.62 4.82 4.84 4.68 4.38 4.28 3 6.74 7.01 6.99 5.17 5.03 4.66 4.70 4.54 4.39 4.35 4.69 4.74 4.60 4.54 4.50 4.80 4.79 4.98 4.98 4.82 4.50 4.38 4 6.78 7.13 7.25 5.55 5.42 5.03 5.03 4.87 4.71 4.62 4.97 5.05 4.88 4.82 4.73 4.99 4.97 5.13 5.13 4.96 4.65 4.53 5 6.91 7.24 7.46 5.90 5.78 5.39 5.36 5.20 5.05 4.91 5.25 5.35 5.17 5.11 4.97 5.18 5.15 5.27 5.26 5.09 4.80 4.68 6 7.04 7.39 7.63 6.18 6.07 5.69 5.63 5.49 5.35 5.18 5.50 5.62 5.43 5.37 5.19 5.36 5.31 5.39 5.39 5.18 4.90 4.79 7 7.14 7.55 7.76 6.40 6.30 5.93 5.86 5.72 5.60 5.41 5.72 5.85 5.66 5.59 5.39 5.52 5.46 5.51 5.50 5.26 4.99 4.89 8 7.20 7.66 7.85 6.57 6.47 6.12 6.04 5.91 5.81 5.62 5.91 6.04 5.85 5.79 5.57 5.69 5.61 5.61 5.60 5.34 5.08 4.98 9 7.22 7.69 7.88 6.72 6.61 6.27 6.19 6.07 5.98 5.78 6.07 6.19 6.01 5.96 5.74 5.85 5.74 5.70 5.69 5.43 5.20 5.09 10 7.19 7.56 7.86 6.85 6.72 6.39 6.32 6.22 6.14 5.90 6.20 6.30 6.14 6.11 5.90 6.00 5.88 5.80 5.78 5.56 5.38 5.25 Dally rates 2.02.98 3.02.98 4.02.98 5.02.98 6.02.98 9.02.98 10.02.98 11.02.98 12.02.98 13.02.98 16.02.98 17.02.98 18.02.98 19.02.98 20.02.98 23.02.98 24.02.98 25.02.98 26.02.98 27.02.98 4.25 4.25 4.25 4.25 4.25 4.26 4.25 4.25 4.25 4.24 4.24 4.23 4.22 4.22 4.22 4.22 4.22 4.22 4.22 4.22 4.26 4.25 4.26 4.26 4.27 4.28 4.27 4.26 4.25 4.24 4.24 4.23 4.22 4.22 4.22 4.22 4.22 4.22 4.22 4.22 4.28 4.28 4.28 4.28 4.28 4.28 4.28 4.27 4.26 4.25 4.25 4.23 4.22 4.22 4.22 4.22 4.22 4.22 4.22 4.22 4.30 4.30 4.30 4.31 4.31 4.31 4.31 4.27 4.26 4.25 4.25 4.23 4.22 4.22 4.22 4.22 4.21 4.22 4.22 4.22 4.23 4.26 4.29 4.34 4.30 4.31 4.29 4.29 4.29 4.23 4.25 4.24 4.22 4.23 4.25 4.23 4.25 4.28 4.24 4.24 4.29 4.30 4.35 4.34 4.33 4.33 4.31 4.30 4.29 4.26 4.25 4.23 4.23 4.24 4.27 4.23 4.24 4.26 4.25 4.25 4.41 4.41 4.46 4.45 4.44 4.44 4.42 4.39 4.38 4.36 4.35 4.33 4.34 4.35 4.37 4.33 4.34 4.36 4.35 4.34 4.56 4.57 4.59 4.60 4.59 4.59 4.58 4.52 4.52 4.51 4.50 4.47 4.49 4.50 4.50 4.48 4.49 4.50 4.49 4.49 4.71 4.72 4.74 4.76 4.74 4.74 4.73 4.67 4.66 4.66 4.65 4.62 4.63 4.65 4.64 4.62 4.65 4.65 4.63 4.63 4.83 4.83 4.86 4.88 4.87 4.86 4.86 4.81 4.78 4.78 4.77 4.73 4.74 4.75 4.76 4.73 4.76 4.76 4.74 4.73 4.93 4.92 4.98 4.98 4.98 4.96 4.96 4.92 4.87 4.87 4.85 4.82 4.83 4.84 4.86 4.82 4.84 4.84 4.82 4.82 5.03 5.02 5.08 5.07 5.09 5.06 5.05 5.03 4.97 4.96 4.94 4.90 4.91 4.92 4.95 4.91 4.93 4.92 4.90 4.91 5.15 5.15 5.20 5.20 5.20 5.19 5.17 5.13 5.09 5.07 5.06 5.01 5.02 5.05 5.06 5.03 5.05 5.04 5.00 5.03 5.29 5.33 5.33 5.37 5.34 5.36 5.34 5.22 5.27 5.20 5.23 5.18 5.16 5.23 5.19 5.21 5.22 5.22 5.15 5.20
* Operation rates of the EMI: see explanatory notes
" See backpage for January's data
n.a. = not available
L ^
eurostat
Graph 3: ECU yield curve
6.00
5.75
ω
>-5.50
5.25
5.00
4.75
4.50
4.25
4.00
J _ _ _ , J
J . . . r- J
J r -A
000^ΖΎ J
4 5 6 7 Maturity (years)
28-feb-97
30-jan-98 27-feb-98
10
Graph 4: Evolution of ECU yields over the last 18 months
7.0
6.5
6.0
5.5
5:0
4.5
■ e r - - : - *1! ! · - ι" Τ r ' r "· ■"
. - 1 - - r L J ^ r ' - r - ■ - - V P I ^ ; - " I. . . ,
10 years
3 years
Sep Oct Nov Dec Jan Feb Mar Apr May Jun Jul Aug Sep Oct Nov Dec Jan Feb
1997
eurostat TABLE Χ
Central bank interest rates
Β
DKI REPO I DR | LR | REPO | 3Ρ"ΤΒ
EL
LR I ORDR I AUCT | AR | CR
DR
CD
DR
REPO AR02/97 03/97 04/97 05/97 06/97 07/97 08/97 09/97 10/97 11/97 12/97 01/98 02/98
Rates at the end of:
2.50 2.50 2.50 2.50 2.50 2.50 2.50 2.50 2.75 2.75 2.75 2.75 2.75
3.00 3.00 3.00 3.00 3.00 3.00 3.00 3.00 3.30 3.30 3.30 3.30 3.30
4.25 4.25 4.25 4.25 4.25 4.25 4.25 4.25 4.55 4.55 4.55 4.55 4.55
3.00 3.00 3.00 3.00 3.00 3.00 3.00 3.00 3.30 3.30 3.30 3.30 3.30
3.25 3.25 3.25 3.25 3.25 3.25 3.25 3.25 3.50 3.50 3.50 3.50 3.50
3.50 3.50 3.50 3.50 3.50 3.50 3.50 3.50 3.75 3.75 3.75 3.75 3.75
3.50 3.50 3.50 3.50 3.50 3.50 3.50 3.50 3.75 3.75 3.75 3.75 3.75
2.50 2.50 2.50 2.50 2.50 2.50 2.50 2.50 2.50 2.50 2.50 2.50 2.50
4.50 4.50 4.50 4.50 4.50 4.50 4.50 4.50 4.50 4.50 4.50 4.50 4.50
3.00 3.00 3.00 3.00 3.00 3.00 3.00 3.00 3.30 3.30 3.30 3.30 3.30
3.10 3.10 3.10 3.10 3.10 3.10 3.10 3.10 3.10 3.10 3.10 3.10 3.10
15.50 15.50 15.50 14.50 14.50 14.50 14.50 14.50 14.50 14.50 14.50 14.50 14.50
20.00 20.00 20.00 19.00 19.00 19.00 19.00 19.00 19.00 19.00 19.00 23.00 23.00
25.00 25.00 25.00 24.00 24.00 24.00 24.00 24.00 24.00* 24.00* 24.00* 24.00* 24.00*
6.00 5.75 5.50 5.25 5.25 5.25 5.25 5.25 5.00 5.00 4.75 4.75 4.50
6.10 5.75 5.60 5.30 5.30 5.30 5.30 5.30 5.05 5.05 4.80 4.80 4.55
Recent actual changes 02.01.98
05.01.98 06.01.98 07.01.98 08.01.98 09.01.98 12.01.98 13.01.98 14.01.98 15.01.98 16.01.98 19.01.98 20.01.98 21.01.98 22.01.98 23.01.98 26.01.98 27.01.98 28.01.98 29.01.98 30.01.98 31.01.98 30.01.98 02.02.98 03.02.98 04.02.98 05.02.98 06.02.98 09.02.98 10.02.98 11.02.98 12.02.98 13.02.98 16.02.98 17.02.98 18.02.98 19.02.98 20.02.98 23.02.98 24.02.98 25.02.98 26.02.98 27.02.98
23.00
5.75
4.80
4.50 4.55
Please see explanatory notes at the end of the publication for the key to the various rates. Data series with the same abbreviation are not necessarily internationally comparable. * The rate of 24% Is subject to a surcharge of 0.4% daily as from October 31,1997 onwards and 0.2% daily as from December 29,1997 onwards.
TABLE Χ Central bank interest rates
IRL
DR I LR I REPO |R-REPÕ
NL
PR R I SFR I DR R I PRO | PRO AUCT REPO STF AR I SPR I LR I DR [ LR I REPO
Rates at the end of:
3.10 3.10 3.10 3.10 3.10 3.10 3.10 3.10 3.30 3.30 3.30 3.30 3.30
4.60 4.60 4.60 4.60 4.60 4.60 4.60 4.60 4.60 4.60 4.60 4.60 4.60
6.25 6.25 6.25 6.75 6.75 6.75 6.75 6.75 6.75 6.75 6.75 6.75 6.75
6.75 6.75 6.75 6.75 6.25 6.25 6.25 6.25 6.25 6.25 5.50 5.50 5.50
8.25 8.25 8.25 8.25 7.75 7.75 7.75 7.75 7.75 7.75 7.00 7.00 7.00
7.35 7.34 7.09 6.77 6.26 6.27 6.71 6.61 6.79 6.21
6.16 6.29 6.07 6.15
2.00 2.50 2.50 2.50 2.50 2.50 2.50 2.50 2.75 2.75 2.75 2.75 2.75
2.70 2.90 2.90 2.90 2.90 3.00 3.00 3.00 3.30 3.30 3.30 3.30 3.30
4.50 4.50 4.50 4.50 4.50 4.50 4.50 4.50 4.50 4.50
2.50 2.50 2.50 2.50 2.50 2.50 2.50 2.50 2.50 2.50 2.50 2.50 2.50
4.75 4.75 4.75 4.75 4.75 4.75 4.75 4.75 4.75 4.75 4.75 4.75 4.75
3.00 3.00 3.00 3.00 3.00 3.00 3.00 3.00 3.20 3.20 3.20 3.20 3.20
6.500 6.520 6.300 6.000 6.000 5.703 5.501 5.501 5.502 5.300 5.308 5.308 5.100
8.30 8.30 7.80 7.70 7.70 7.40 7.20 7.20 7.20 6.90 6.90 6.80 6.60
6.20 6.20 5.80 5.70 5.70 5.40 5.20 5.20 5.20 4.90 4.90 4.80 4.60
6.200 6.200 5.800 5.700 5.700 5.400 5.200 5.200 5.200 4.900 4.900 4.800 4.600
6.500 6.500 6.300 6.000 6.000 5.702 5.500 5.500 5.500 5.300 5.327 5.300 5.104
02/97 03/97 04/97 05/97 06/97 07/97 08/97 09/97 10/97 11/97 12/97 01/98 02/98
Recent actual changes
6.23
6.07
5.300
6.80 4.80 4.800
01.98 01.98 01.98 01.98 01.98 01.98 01.98 01.98 01.98 01.98 01.98 01.98 01.98 01.98 01.98 01.98 01.98 01.98 01.98 01.98 01.98 01.98 01.98
6.16
5.100 5.100
6.17
5.95
5.91
6.15
5.104
6.60 4.60 4.600
02.98 02.98 02.98 02.98 02.98 02.98 02.98 02.98 02.98 02.98 02.98 02.98 02.98 02.98 02.98 02.98 02.98 02.98 02.98 02.98
m
TABLE Χ
Central bank interest rates
FIN UK IS CH US
PR | FED JP
BR | TR | AR DR I AR I REPO I IBR BR | PR | R E P O | CD AR DR LR DR
Rates at the end of: 02/97
03/97 04/97 05/97 06/97 07/97 08/97 09/97 10/97 11/97 12/97 01/98 02/98
4.00 4.00 4.00 4.00 4.00 4.00 4.00 4.00 4.00 4.00 4.00 4.00 4.00
3.00 3.00 3.00 3.00 3.00 3.00 3.00 3.25 3.25 3.25 3.25 3.25 3.25
5.00 5.00 5.00 5.00 5.00 5.00 5.00 5.25 5.25 5.25 5.25 5.25 5.25
2.50 2.50 2.50 2.50 2.50 2.50 2.50 2.50 2.50 2.50 2.50 2.50 2.50
5.25 5.25 5.25 5.25 5.25 5.25 5.25 5.25 5.25 5.25 5.25 5.25 5.25
4.10 4.10 4.10 4.10 4.10 4.10 4.10 4.10 4.10 4.10 4.35 4.35 4.35
5.47 5.58 6.04 6.04 6.04 5.58 5.58 5.88 6.09 6.09 6.35 5.68 5.68
6.00 6.00 6.00 6.25 6.50 6.75 7.00 7.00 7.00 7.25 7.25 7.25 7.25
6.50 6.50 6.50 6.50 6.50 6.50 6.50 6.50 6.50 6.80 6.80 6.80 6.80
6.90 6.90 6.90 6.90 6.90 6.90 6.90 6.90 6.90 7.20 7.20 7.20 7.20
6.60 6.60 6.60 6.60 6.60 6.60 6.60 6.60 6.60 6.90 6.90 6.90 6.90
5.25 5.25 5.25 5.25 5.25 5.50 5.50 5.50 5.50 5.50 5.50 5.50 5.50
1.00 1.00 1.00 1.00 1.00 1.00 1.00 1.00 1.00 1.00 1.00 1.00 1.00
3.750 4.375 3.750 2.875 3.875 3.625 3.375 3.875 3.875 3.750 3.750 3.000 2.750
5.00 5.00 5.00 5.00 5.00 5.00 5.00 5.00 5.00 5.00 5.00 5.00 5.00
5.25 5.50 5.50 5.50 5.50 5.50 5.50 5.50 5.50 5.50 5.50 5.50 5.50
0.50 0.50 0.50 0.50 0.50 0.50 0.50 0.50 0.50 0.50 0.50 0.50 0.50
Recent actual changes 02.01.98
05.01.98 06.01.98 07.01.98 08.01.98 09.01.98 12.01.98 13.01.98 14.01.98 15.01.98 16.01.98 19.01.98 20.01.98 21.01.98 22.01.98 23.01.98 26.01.98 27.01.98 28.01.98 29.01.98 30.01.98 31.01.98 30.01.98 02.02.98 03.02.98 04.02.98 05.02.98 06.02.98 09.02.98 10.02.98 11.02.98 12.02.98 13.02.98 16.02.98 17.02.98 18.02.98 19.02.98 20.02.98 23.02.98 24.02.98 25.02.98 26.02.98 27.02.98
5.68
3.125
3.000 2.875
3.000 3.125 3.250
3.125
3.000 2.875 3.000 3.125
3.000
2.875 2.750
eurostat
Evolution of central bank interest rates over the last 12 months
10
7
4
[U
DRCR
10
7
pi
DR„ C D
3.3.97 2.6.97 1.9.97 1.12.97 27.2.98 3.3.97 2.6.97 1.9.97 1.12.97 27.2.98
10
7
a
■DRLR
"■«"**»■* Repo
1
3.3.97 2.6.97 1.9.97 1.12.97 27.2.98
10
28
23
18
13
•DR LR OR
T_
7
1
a
•RepoAR
3.3.97 2.6.97 1.9.97
10 τ
1.12.97 27.2.98
I ■ ■ 1 Π
4 T
1
a
AuctRepo
3.3.97 2.6.97 1.9.97 1.12.97 27.2.98 3.3.97 2.6.97 1.9.97 1.12.97 27.2.98
10
4
STF
0
7
4 ^ — D R Repo LR
ι
El
~ ~ l _ T T — <
3.3.97 2.6.97 1.9.97 1.12.97 27.2.98
10 τ
a
SPR AR •LR3.3.97 2.6.97
10
7 τ
4
Q
1.9.97 1.12.97 27.2.98
•DR LR Repo
3.3.97 2.6.97 1.9.97 1.12.97 27.2.98 3.3.97 2.6.97 1.9.97 1.12.97 27.2.98
eurostat
Evolution of central bank interest rates over the last 12 months
10 τ
7
--1
Θ
-PRO DRO10 τ
7
--1
BR -TR
3.3.97 2.6.97 1.9.97 1.12.97 27.2.98 3.3.97 2.6.97 1.9.97 1.12.97 27.2.98 10
10 7
4
-1
Θ
AR■Repo
7
4
--1
-BR
7
--1
3.3.97 2.6.97 1.9.97 1.12.97 27.2.98 3.3.97 2.6.97 1.9.97 1.12.97 27.2.98
10
τΓϋΊ ι
D_ ι
1 0T[Ñ]
7 -Repo
4 τ
1
■AR
3.3.97 2.6.97 1.9.97 1.12.97 27.2.98 3.3.97 2.6.97 1.9.97 1.12.97 27.2.98
10 R 6 4 2
-LjüJ
— DR LR' « . i : , .
10
4 L
_L
1•DR FED
3.3.97 2.6.97 1.9.97 1.12.97 27.2.98 3.3.97 2.6.97 1.9.97
10
1.12.97 27.2.98
8
6
4
-2
--[jpj
l
DR
3.3.97 2.6.97 1.9.97 1.12.97 27.2.98
EXPLANATORY NOTES
Exchange rate grid (Table I)
The intervention limit rates fixed in the official grid do not correspond exactly to + or - 15 % of the central rates, since for each currency pair (whose exchange rates are Inversely proportional to one another) the lower limit of one corresponds to the upper limit of the other.
Bilateral fluctuations of the ERM currency
(Graph 1 on page 5)
The daily market exchange rates of all currencies are compared with the relevant bilateral central rates and the differentials between the two calculated.
The graph is divided symmetrically by a horizontal axis along which the points would be plotted if all currencies were at their bilateral central rate and there were therefore no fluctuations.
The curves are drawn by linking the daily points showing the relative positions of each currency. These should be compared in pairs. To find the differential between two currencies, subtract the (positive or negative) values along the y-axis corresponding to each currency.
The graph is drawn with the curve of the stronger currency above that of the weaker. It shows therefore the relative position of each currency vis-à-vis the other currencies.
When two curves intersect or merge over a period of time there is no differential between the two currencies and their market exchange rate equals their bilateral central rate.
The maximum spread recorded between two currencies is signified by the band, symmetrical with the horizontal axis. The fluctuations of the other currencies in relation to either of the two currencies in question are shown within the maximum spread.
The divergence indicator (Graph 2 on page 5)
The divergence indicator (DI) measures the degree of movement of a specific EMS currency against its maximum divergence spread. In effect, the DI is a mechanism which detects the EMS currencies that deviate upwards or downwards from the Community average as represented by the ECU.
For a given currency the divergence indicator is obtained:
(i) first by calculating the appreciation or depreciation of the market rate of the ECU in terms of that currency against its ECU-related central rate;
(ii) and then by comparing the result obtained with the maximum divergence spread (MDS), which is the intervention limit, corrected by the weight of each currency in the basket in such a way that an increase in
the weight of a currency reduces its maximum divergence spread.
In order to permit a comparison of movements in the divergence indicators for each of the EMS currencies, the MDS is expressed as an index number ranging between +/-100. At an absolute index number of 75, a currency reaches its divergence threshold. When a currency crosses its "threshold of divergence", this results in a presumption that the authorities concerned will correct this situation by taking adequate measures.
ECU exchange rates (Table II)
The exchange rates for the ECU against the national currencies of the member states of the Community, the USD and yen are shown as annual averages, monthly averages (for the current year), and daily rates (for the latest available month).
Change in the purchasing power of the ECU
(Harmonised indices of consumer prices adjusted
for ECU exchange rate changes)
(Table III)
For each country the index of harmonised consumer prices in ECUs is calculated by multiplying the national harmonised consumer price index (HICP) by the average movement of the national currency in relation to the ECU during the month. It measures the change in the purchasing power of one ECU in the country concerned. A rise in the index means a fall in the purchasing power of the ECU.
Three composite indices are calculated, the first covering all the member states of the Community (EUR15), the second covering 13 member states whose currencies participate in the European Monetary System exchange rate mechanism (ERM), and the third covering the 12 member countries whose currencies go to make up the ECU. (Although the peseta has been participating in the exchange rate mechanism since 19/06/89 and has been included in the calculation of the ECU since 21/09/89, it is only taken into account in the indices relating to the ERM which are included in this bulletin for data after 30/09/89).
These three indices are calculated as weighted arithmetic means (chain indices). The weightings are defined as follows: for the EUR 15 and ERM indices, the relative share of each member state in the final consumption of households for the group of countries in question (EUR15 or ERM), at current prices and exchange rates (annual weighting). For the ECU index, the relative share of each member state's currency in the calculation of the ECU (monthly weighting).
The base year is 1996. These indices may be used for indexing new contracts in ECU.
aa
eurostat
ECU-EMS Information and central bank interest rates Explanatory notes
Harmonised Indices of Consumer Prices (HICPs) are designed to facilitate international comparisons of consumer price inflation. The focus lies on comparability among the indices of the different Member States as well as the relative movements. They will form the basis of the Monetary Union Index of Consumer Prices (MUICP) to be used for the monitoring of inflation in the euro-area.
HICPs are harmonized not only on coverage but also in several methodological aspects (details are given in the Eurostat news release "Harmonising the way the EU measures inflation", No 21/97, of 5 March 1997, and in Regulations (EC) No 2494/95, No 1749/96, No 2214/96, and No 2454/97). HICPs provide the best statistical basis for international comparisons of consumer price inflation and very considerable progress has been made in harmonizing methodologies.
The HICPs are compiled using a version of the international "Classification of individual consumption by purpose" which has been specially adapted for the HICPs and is known as COICOP/HICP. Since March 1997 the Commission (Eurostat) has been disseminating every month about 100 sub-indices and their weights.
Change in the purchasing power of the ECU
(Non-harmonised indices of consumer prices adjusted for ECU exchange rate changes)
(Table IV)
For each country the non harmonised index of consumer prices in ECUs is calculated by multiplying the national non harmonised consumer price index by the average movement of the national currency in relation to the ECU during the month. It measures the change in the purchasing power of one ECU in the country concerned. A rise in the index means a fall in the purchasing power of the ECU.
Three composite indices are calculated, the first covering all the member states of the Community (EUR 15), the second covering 13 member states whose currencies participate in the European Monetary System exchange rate mechanism (ERM), and the third covering the 12 member countries whose currencies go to make up the ECU. (Although the peseta has been participating in the exchange rate mechanism since 19/06/89 and has been included in the calculation of the ECU since 21/09/89, it is only taken into account in the indices relating to the ERM which are included in this bulletin for data after 30/09/89).
These three indices are calculated as weighted arithmetic means (chain indices). The weightings are defined as follows: for the EUR 15 and ERM indices, the relative share of each member state in the final consumption of households for the group of countries in question (EUR 15 or ERM), expressed in ECUs at current prices and exchange rates (annual weighting). For the ECU index, the relative share of each member state's currency in the calculation of the ECU (monthly weighting).
The base year is 1985. These indices may be used for indexing existing contracts in ECU; for new contracts the new harmonised CPI in ECU may be used instead. The non harmonised price indices in ECU will be published until December 1998.
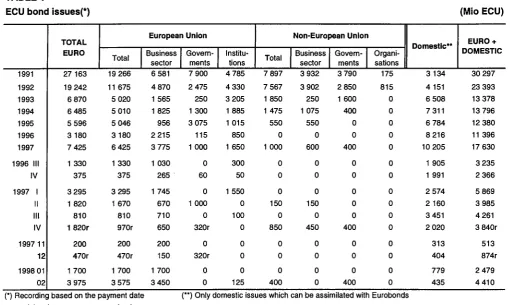
ECU bond issues (Tables V & VI)
In table V, issues are recorded as at the payment date. This bulletin covers ECU issues in the Eurobond market, which includes international and foreign issues and domestic issues which can be assimilated with Eurobond issues. More specifically, the domestic issues should be free of withholding tax in the hands of non-residents and subject to similar clearing and settlement procedures. This includes
ECU issues offering the option of conversion into other currencies. Main source: International Financing Review.
Table V shows, under the headings:
— Business sector and Governments: national issuers, both private and public.
— Institutions: the European Investment Bank and the Commission of the European Communities (EEC, ECSC, Euratom).
— Organisations: the specialist institutions of the United Nations, the World Bank, the Council of Europe, etc....
Table VI shows detailed information on the latest known issues, irrespective of the payment date.
Outstanding amount of ECU bonds (Table VII)
This table shows the bonds in ECUs outstanding at the end of the last three months and at the end of the last three years. These statistics are taken from a particularly comprehensive database and measure the volume of ECU bonds in circulation. The overall figure is broken down in two ways - by residual maturity and by type of issuer.
Total of the secondary market turnover and % of market taken by ECU securities (Table VIII)
This table shows the volume of transactions on securities conducted by the international clearing houses Cedel and Euroclear. The market shares of the various types of instrument are calculated. These statistics do not cover all transactions throughout the world, since internal movements are not included. They do, however, give a realistic idea of market developments.
interest rates and yields on ECU investments (Table IX)
The interest rates for 1, 3, 6 and 12 months deposits are calculated on the basis of the London market rates LIBID as follows:
— until October 1993: source: Financial Times, Friday rate.
— from November 1993: source : Bank of England, British Banker's Association, daily rates.