Int. J. Electrochem. Sci., 6 (2011) 3550 - 3563
International Journal of
ELECTROCHEMICAL
SCIENCE
www.electrochemsci.org
Determination of Aminonitrophenols in Hair Dyes Using a
Carbon Paste Electrode and a Boron-Doped Diamond Film
Electrode – A Comparative Study
Hana Dejmkova*, Jiri Barek, and Jiri Zima
Charles University in Prague, Faculty of Science, Department of Analytical Chemistry, UNESCO Laboratory of Environmental Electrochemistry, Albertov 6, CZ-12843 Prague 2, Czech Republic.
*
E-mail: [email protected]
Received: 1 June 2011 / Accepted: 12 July 2011 / Published: 1 August 2011
Methods for the determination of aminonitrophenols as dyeing agents are proposed, using carbon paste electrode (CPE) and boron-doped diamond film electrode (BDDFE) as working electrodes in differential pulse voltammetry and HPLC with electrochemical detection. Comparison of both electrodes is given, concerning the applicable potential range, background current, reversibility of electrode reaction, repeatability and sensitivity of the aminonitrophenols’ determination. Optimum conditions for the determination of aminonitrophenols in hair dye samples were found and selected methods are employed for the determination of 4-amino-3-nitrophenol in practical samples of hair dyes.
Keywords: Carbon paste electrode, boron-doped diamond film electrode, voltammetry, hair dyes, HPLC with amperometric detection
1. INTRODUCTION
[13, 14] and for voltammetry [15]. Besides, their structure also makes aminonitrophenols convenient model compounds for the electrochemical measurements.
Carbon paste electrodes (CPE) and boron-doped diamond film electrodes (BDDFE) are frequently used both in voltammetry and in amperometry. Their constitution and physical properties are completely different, the former consisting of pasty mixture of carbon powder and a suitable pasting liquid and the latter being a layer of a hard and chemically inert micro- or nanocrystallic diamond. Nevertheless, their electrochemical behaviour is often described by the same words.
Carbon paste electrodes offer, due to their consistence, easy renewal of the electrode surface, which was the original reason for their development [16]. Their properties are strongly dependent on the material used for their preparation. Further field for specific modifications is opened by the possibility to admix a suitable compound into the paste [17, 18]. Their main disadvantage is lower chemical and mechanical stability, an important drawback particularly for the utilization in flow systems. However, this problem can be overcome by the selection of suitable electrode material [19].
BDDFEs are specific by their hardness and chemically inert surface. Pure diamond is a very good insulator, but when doped, its conductivity can reach (depending on the doping level) 100 S cm–1 [20]. The surface of the electrode is hydrogen-terminated after the fabrication; it is hydrophobic and rather inactive. In dependence to the nature of molecules undergoing electrochemical reaction, it might be necessary to cover the surface by oxygen-carrying groups by cathodic and anodic polarization [21]. The state of the electrode surface together with the boron doping level influences the reversibility of the electrode reaction; however, BDDFE generally does not reach the reversibility accessible on platinum or similar metals [22].
Similarly to each other, both electrodes are reported to have wide potential window and low background current [17, 23]. Both of them also in their own way deal with the passivation of their surface: CPE was designed to enable quick mechanical surface renewal, while BDDFE is very resistant to surface fouling [24]. Papers comparing CPE [25, 26] or BDDFE [24, 27] to glassy carbon electrode were published, but direct comparison of these two materials was not reported.
The aim of this work is to develop methods for the determination of five isomers of aminonitrophenol. The methods are based on two electrochemical techniques, differential pulse voltammetry (DPV) and HPLC with amperometric detection. For the comparison, HPLC with spectrophotometric detection is used. Electrochemical methods use two working electrodes, CPE and BDDFE, and the results are compared to present the relative advantages of the electrodes. Selected methods are employed for the determination of the studied compounds in real samples of hair dyes.
2. EXPERIMENTAL
2.1. Chemicals
CAS Number 610-81-1), all by Aldrich. The stock solutions (c = 1 mmol L–1) were prepared by dissolving the exact amount of the respective substance in methanol and were kept at a laboratory temperature. It was proved spectrophotometricaly that the solutions are stable for at least six months.
Britton-Robinson (B-R) buffers served as supporting electrolytes for voltammetric measurements. The same buffers, diluted 10 times with water, were used for chromatographic measurement. For pH 2, diluted B-R buffer was replaced by 0.01 M phosphate buffer (0.01 mol L–1 sodium dihydrogenphosphate adjusted to the desired pH value by concentrated phosphoric acid). All chemicals used for buffer preparation were of analytical grade purity and obtained from Lachema Brno, Czech Republic. Other used chemicals were potassium ferrocyanide (p.a., Lachema Brno, Czech Republic), methanol (for HPLC, Chromservis, Czech Republic) and deionized water (Millipore).
2.2. Apparatus
HPLC measurements were performed using high pressure pump Beta 10, injector valve with 20 L loop, UV/VIS detector Sapphire 800 (all Ecom, Czech Republic) and amperometric detector ADLC 2 (Laboratorní přístroje, Czech Republic) connected in series and LiChroCART 125-4 Purospher STAR RP-18E (5 m) column (Merck). The HPLC system was controlled via Clarity 2.3 software (DataApex, Czech Republic). The three-electrode wall-jet system was used for electrochemical detection with a working electrode adjusted against the outlet capillary at a controlled distance, a platinum wire auxiliary electrode, and an Ag/AgCl (3 M KCl) reference electrode RAE 113 (Monokrystaly Turnov, Czech Republic), to which all the potential values are referred [28].
Voltammetric measurements were carried out using Eco-Tribo-Polarograph, controlled by software Polar Pro 5.1 (both PolaroSensors, Prague, Czech Republic). Cyclic voltammetry (CV) and differential pulse voltammetry (DPV) techniques were employed with the same electrode set.
As working electrodes, three electrodes were compared during the experiments with different treatment prior measurements. The boron-doped diamond film electrode (BDDFE, active area 12.4 mm2, Adamant Technologies, Switzerland) was subjected to electrochemical cleaning and activating step consisting in application of the potential of –3.0 V for 10 s and of +3.0 V for 10 s in 1M nitric acid. The glassy carbon paste electrode (CPE) was prepared from 100 L of mineral oil (Fluka) and 250 mg of spherical microparticles of glassy carbon with a diameter from 0.4 to 12 m (Alfa Aesar, Germany). Carbon paste was packed in the Teflon electrode body with 3 mm inner diameter (active area 7.1 mm2).The surface of the electrode was renewed by wiping with wet filtration paper. Glassy carbon electrode (GCE, active area 3.1 mm2, Metrohm, Switzerland) was used for the comparison of general properties of the electrodes. It was polished with 0.05 µm alumina slurry on a wet polishing cloth and rinsed with distilled water.
2.3. Procedures
Unless specified otherwise, following parameters were used: cyclic voltammograms were measured at a scan rate of 100 mV s–1, working in cathodic, anodic and whole potential range; differential pulse voltammograms were measured at pulse width of 100 ms, pulse height of 50 mV and scan rate of 20 mV s–1. HPLC measurements were performed with flow rate of 1 mL min–1. Detection wavelength 215 nm was selected from UV spectra of the analytes. Oxygen from the solutions was removed by purging with nitrogen.
Solutions were prepared by exact dilution of methanolic stock solutions by B-R buffers and methanol in a way to obtain 10 % (v/v) of methanol for voltammetric experiments and 50 % (v/v) of methanol for chromatographic experiments. The concentration of 100 mol L–1 was used during the optimization.
Calibration dependences were evaluated by least squares linear regression method. The determination limits were calculated as the concentration of the analyte which gave a signal ten times the standard deviation of the lowest evaluable concentration [29].
2.4. Hair dye samples
Six shades of two hair dye brands were analyzed: Igora Classic (Schwarzkopf) dyes of shades 6-0, 6-68, 7-77 and 9-0 and Dusy Color (Euro-Friwa) dyes of shades 9.2 and 6.6.
For the preparation of a sample, 0.10 g of the dye was sonicated in 10 mL of methanol. Solutions for voltammetric measurements were prepared by dilution of 1 mL of this methanolic solution by 9 mL of a buffer. For chromatographic measurement, 1 ml of the methanolic solution was run through an SPE column LiChrolut RP-18 E (Merck, Germany) to remove possible strongly adsorbing compounds. The column was washed by 4 mL of methanol and water was added to total volume of 10 mL. 20 L of the resulting solution were injected in the chromatographic system.
For the determination of 4A3NP in real samples, standard addition method was used, with two consequent additions of 50 L of 1.10–3
M methanolic solution of 4A3NP to 10 mL of dye solution.
3. RESULTS AND DISCUSSION
3.1. Electrode characteristics
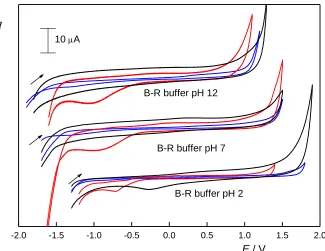
On the other hand, the background currents of the electrodes normalized to the electrode area follow the expectations. BDDFE exhibits the lowest background currents, closely followed by CPE and the background current of GCE is several times higher.
In Fig. 1, we can also notice the signal in the cathodic potential region of CPE, which corresponds to the oxygen present in the paste. This is an important disadvantage of carbon paste electrodes, as oxygen often interferes with the response of reducible analytes.
-2.0 -1.5 -1.0 -0.5 0.0 0.5 1.0 1.5 2.0
I
10 A
B-R buffer pH 12
B-R buffer pH 7
B-R buffer pH 2
E / V
Figure 1. Cyclic voltammograms measured at BDDFE (blue), CPE (red), and GCE (black) in B-R buffer of pH 2, pH 7 and pH 12 (starting from negative potentials, scan rate 100 mV s–1).
Reversibility of the electrode reaction was tested using the simple one-electron oxidation of [Fe(CN)6]4– (0.01M solution in 1M KCl). The theoretical peak potential separation of 59 mV was
somewhat exceeded on GCE, reaching value of 80 mV. The performance of CPE was even poorer, reaching over 90 mV and thus suggesting a quasi-reversible behavior, and the shift of the peak on BDDFE was almost twice the theoretical value (110 mV). This behavior in a way eliminates the advantage of a wide potential window. Besides, non-linearity of the dependence of the peak height on either the scan rate or the second root of the scan rate on BDDFE suggests that the electrode reaction is controlled neither exclusively by diffusion, nor exclusively by adsorption.
3.2. Voltammetric determination
[image:5.596.135.460.190.441.2]
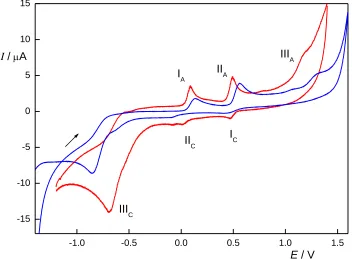
electrochemical reaction is amino-hydroxylaminophenol, whose quasi-reversible oxidation to nitroso derivative gives rise to peaks IA and IIC [31]. In the anodic area, there are two anodic peaks (IIA and
IIIA in Fig. 1), corresponding to the oxidation of amino and hydroxy group. The reactions are almost
irreversible, with only a small indication of a cathodic peak (IC) corresponding to the peak IIA. This
behaviour is common for this kind of compounds due to the fast chemical transformation of the reaction products. Similarly to the ferrocyanide oxidation, shift of the peak potentials on BDDFE was observed towards higher positive and negative potentials in anodic and cathodic area, respectively, in comparison to CPE.
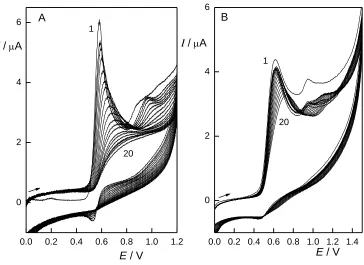
As the oxidation reactions of anilines and phenols often result in formation of a polymeric layer on the electrode surface and consequent passivation of the electrode, the repeatability of the measurements was tested by a set of measurements performed both with and without surface cleaning. CPE deals with the passivation by mechanical surface renewal. Without renewal, the electrode response drops to approximately 20 % of the original peak height during 20 voltammetric cycles of 2A4NP (Fig. 3). With renewal, the measurements on the electrode was found to have RSD 4.9 % (n=20), which is similar to previously reported results [32]. The repeatability of BDDFE is very good (RSD< 1%), but only if measurements can be performed on the same electrode surface. However, even BDDFE is not entirely resistant to passivation. Twenty consecutive voltammograms of 2A4NP show the decrease of the peak height to 70 % of the original value (Fig. 3). Activation of the electrode is possible by applying potential of –3 V for 10 s and of +3 V for 10 s in 1M HNO3. When employing
this procedure, RSD decreases to 4.5 % (n=10), which is almost identical as if measuring on CPE.
-1.0 -0.5 0.0 0.5 1.0 1.5
-15 -10 -5 0 5 10 15
IIIC
IIC IC
IIIA
IIA
IA
I / A
[image:6.596.124.476.443.702.2]E / V
Figure 2. Cyclic voltammograms of 2A5NP (c = 100 µmol L–1) at CPE (red) and BDDFE (blue) in
DP voltammograms of all studied compounds were measured in pH range from 2 to 12 in both the anodic and cathodic potential range. Optimum pH (see Table 1) was chosen according to the highest current response and consequent high signal/noise ratio. In the case of cathodic measurements on CPE, acidic pH was used, because it offers the best obtainable separation between oxygen and analyte peaks.
0.0 0.2 0.4 0.6 0.8 1.0 1.2 1.4 0
2 4 6
0.0 0.2 0.4 0.6 0.8 1.0 1.2 0
2 4 6
20 1
B
I / A
E / V
20 1
A
I / A
E / V
Figure 3. Cyclic voltammograms (1. – 20. cycles) of 2A4NP (c = 100 µmol L–1) at CPE (A) and BDDFE (B) without surface cleaning. B-R buffer pH 4 : MeOH (9:1, v/v), starting at 0 V, scan rate 100 mV s–1.
Under the optimum conditions, calibration dependences were measured (see Table 1). Cathodic measurements on CPE show the lowest precision and sensitivity, due to the interference of the analyte peak and oxygen peak. The lowest determinable concentration is several mol L–1. Determination limits on BDDFE are approximately ten times lower in both cathodic and anodic potential region. Determination limits obtained on CPE in anodic region are slightly lower, probably due to the better reversibility and consequent higher and narrower DPV peaks.
[image:7.596.119.483.186.451.2]
Table 1. Parameters of the calibration dependences of DPV determination of tested aminonitrophenols.
Analyte Media pH
Linear concentration
range
Slope Intercept Correlation coefficient
Determination limit (mol L–1) (mA L mol–1) (nA) (mol L–1)
CPE, oxidation
2A3NP pH 5 0.2 – 100 33.6 3.0 0.9992 0.2
2A4NP pH 3 0.4 – 100 60.7 10.3 0.9991 0.2
2A5NP pH 5 0.2 – 100 70.0 14.9 0.9984 0.3
4A2NP pH 5 0.2 – 100 61.2 3.6 0.9976 0.2
4A3NP pH 5 0.2 – 100 41.5 3.5 0.9985 0.2
CPE, reduction
2A3NP pH 2 6 – 100 –34.4 121 0.9950 6.5
2A4NP pH 2 4 – 100 –22.2 10.7 0.9917 5.7
2A5NP pH 2 6 – 100 –10.2 59.7 0.9964 4.6
4A2NP pH 2 4 – 100 –33.3 101 0.9993 2.1
4A3NP pH 2 4 – 100 –15.5 –21.6 0.9975 5.5
BDDFE, oxidation
2A3NP pH 2 1 – 100 23.9 27.4 0.9993 0.5
2A4NP pH 12 1 – 100 21.5 29.6 0.9971 0.9
2A5NP pH 8 1 – 100 27.9 –20.3 0.9995 0.6
4A2NP pH 8 1 – 100 18.2 7.8 0.9994 0.5
4A3NP pH 2 1 – 100 25.7 37.0 0.9974 0.4
BDDFE, reduction
2A3NP pH 2 0.2 – 100 –25.0 3.7 0.9991 0.3
2A4NP pH 6 0.2 – 40 –47.2 32.1 0.9996 0.4
2A5NP pH 8 0.4 – 100 –45.2 –12.0 0.9980 0.3
4A2NP pH 2 1 – 100 –34.7 29.0 0.9985 0.6
4A3NP pH 6 0.4 – 100 –41.52 38.4 0.9991 0.2
3.3. HPLC determination
0 1 2 3 4 5 6 7
0.00 0.05 0.10 0.15 0.20
0.0 0.2 0.4 0.6 0.8 1.0 4A2NP
2A4NP
2A5NP 4A3NP
2A3NP
A
t
/ min
I
/
A
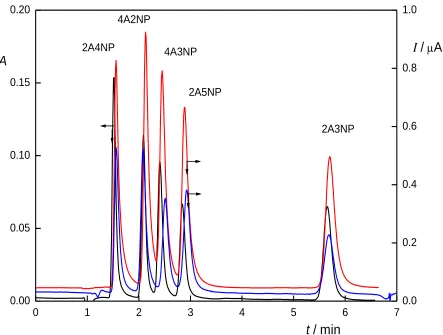
Figure 4. Chromatograms of tested aminonitrophenols (c = 100 µmol L–1) with spectrophotometric detection (black), amperometric detection on CPE (red) and amperometric detection on BDDFE (blue). Column LiChroCART 125-4 Purospher STAR RP-18E (5 µm), mobile phase B-R buffer pH 2 : MeOH (65:35, v/v), λDET = 215 nm, EDET(CPE) = 0.8 V, EDET(BDDFE) = 1.0
V.
Under the optimum separation conditions, hydrodynamic voltammograms were measured, using CPE and BDDFE as working electrodes. Similarly to the behaviour observed during voltammetric measurements, wider potential range is available when using BDDFE, but this advantage is compensated by the potential shift of the signal in comparison with CPE. Peak heights are lower on BDDFE in comparison to CPE, but at the same time, BDDFE exhibits several times lower noise.
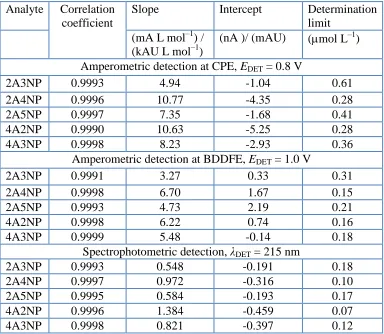
Based on the hydrodynamic voltammograms, working potentials of +0.8 V for CPE and +1.0 V for BDDFE were selected. Concentration dependences were measured in the concentration range from 0.2 to 100 mol L–1 (Table 2). Spectrophotometric detection and amperometric detection on BDDFE proved to be most sensitive, with determination limit below 0.3 mol L–1
, closely followed by amperometric detection on CPE. The difference is mainly caused by the higher noise obtained on CPE.
[image:9.596.78.521.99.434.2]
Table 2. Selected parameters of the calibration dependences of HPLC determination of aminonitrophenols.
Analyte Correlation coefficient
Slope Intercept Determination
limit
(mA L mol–1) /
(kAU L mol–1)
(nA )/ (mAU) (mol L–1) Amperometric detection at CPE, EDET = 0.8 V
2A3NP 0.9993 4.94 -1.04 0.61
2A4NP 0.9996 10.77 -4.35 0.28
2A5NP 0.9997 7.35 -1.68 0.41
4A2NP 0.9990 10.63 -5.25 0.28
4A3NP 0.9998 8.23 -2.93 0.36
Amperometric detection at BDDFE, EDET = 1.0 V
2A3NP 0.9991 3.27 0.33 0.31
2A4NP 0.9998 6.70 1.67 0.15
2A5NP 0.9993 4.73 2.19 0.21
4A2NP 0.9998 6.22 0.74 0.16
4A3NP 0.9999 5.48 -0.14 0.18
Spectrophotometric detection, λDET = 215 nm
2A3NP 0.9993 0.548 -0.191 0.18
2A4NP 0.9997 0.972 -0.316 0.10
2A5NP 0.9995 0.584 -0.193 0.17
4A2NP 0.9996 1.384 -0.459 0.07
4A3NP 0.9998 0.821 -0.397 0.12
3.3. Practical application on hair dye samples
[image:10.596.107.491.111.445.2]Recovery of the studied analytes after the preparation of the real samples was tested by analysis of spiked samples using anodic DPV on CPE and HPLC with amperometric detection on CPE. The dye shade 9-0 was selected as a suitable matrix, as no interfering peaks or analyte signals were observed prior spiking.
Table 3. Recovery of the studied analytes after the sample preparation (analytes spiked to dye shade 9-0).
Analyte Recovery (%)
DPV on CPE HPLC, amperometric det. on CPE
2A3NP 100.9 97.1
2A4NP 95.2 100.3
2A5NP 99.4 100.8
4A2NP 96.9 103.3
[image:10.596.127.471.637.758.2]
Aminonitrophenols were spiked separately with the amount of stock solution corresponding to 0.1 mg /1 g of dye. Obtained results are summarized in Table 3; in all cases, higher recovery than 95 % was observed.
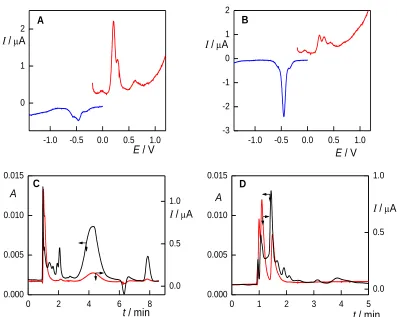
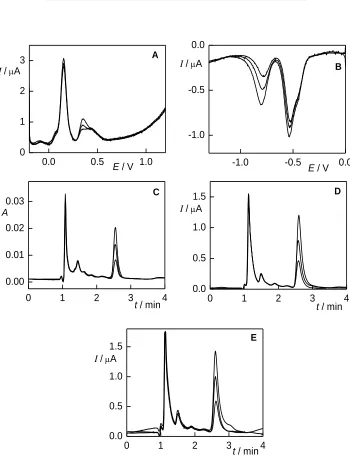
As was previously mentioned, only DPV on CPE in anodic potential region, DPV on BDDFE in cathodic potential region, HPLC with spectrophotometric detection and HPLC with amperometric detection on CPE and BDDFE were selected for the analysis of the real samples. Selected voltammograms and chromatograms are shown in Fig. 5 and Fig. 6.
Some drawbacks of the developed methods appeared during the measurements with real samples. In most of the measurements, response of several other compounds was present. These undesired signals were most frequent in the case of DPV on CPE in anodic potential range and in HPLC with spectrophotometric detection, as can be seen in Fig. 5. The poor selectivity might complicate the application of these methods in some samples. Nevertheless, in the case of the dye shade 7-77, the other compounds present did not interfere with the 4A3NP signal in the extent disabling the determination (see Fig. 6).
Figure 5. DP voltammograms (A, B) and HPLC chromatograms (C, D) of hair dye samples (shade 6-68 (A, C) and 6.6 (B, D). Voltammetry on CPE (red) in B-R buffer pH 5 and BDDFE (blue) in B-R buffer pH 6, pulse width 100 ms, pulse height 50 mV, scan rate 20 mV s–1. HPLC chromatograms obtained with spectrophotometric detection (black) and amperometric detection on CPE (red), column LiChroCART 125-4 Purospher STAR RP-18E (5 µm), mobile phase B-R buffer pH 2 : MeOH (65:35, v/v), λDET = 215 nm, EDET = 0.8 V.
-1.0 -0.5 0.0 0.5 1.0 -3
-2 -1 0 1 2
-1.0 -0.5 0.0 0.5 1.0 0
1
2 A B
E / V E / V
I / A I / A
0 1 2 3 4 5
0.0 0.5 1.0
0 2 4 6 8
0.0 0.5 1.0
0.000 0.005 0.010 0.015
0.000 0.005 0.010 0.015
I / A I / A
t / min t / min
C
A
D
[image:11.596.99.496.349.666.2]
Table 4. Content of 4A3NP in dye shade 7-77 found by the developed methods. 4A3NP content (mg/g of dye)
HPLC spectrophotometry 0.94 ± 0.03
CPE 0.96 ± 0.04
BDDFE 1.01 ± 0.04
DPV CPE (anodic) 0.79 ± 0.11
BDDFE (cathodic) 0.98 ± 0.12
Figure 6. DP voltammograms (A, B) and HPLC chromatograms (C, D, E) of hair dye shade 7-77 with two standard additions of 4A3NP. Voltammetry on CPE (A) in B-R buffer pH 5 and BDDFE (B) in B-R buffer pH 6, pulse width 100 ms, pulse height 50 mV, scan rate 20 mV s–1. HPLC chromatograms obtained with spectrophotometric detection (C) and amperometric detection on CPE (D) and BDDFE (E), column LiChroCART 125-4 Purospher STAR RP-18E (5µm), mobile phase B-R buffer pH 2 : MeOH (65:35, v/v), λDET = 215 nm, EDET(CPE) = 0.8 V,
EDET(BDDFE) = 1.0 V.
0.0 0.5 1.0
0 1 2
3 A
I / A
E / V -1.0 -0.5 0.0
-1.0 -0.5 0.0
B
I / A
E / V
0 1 2 3 4
0.00 0.01 0.02
0.03 C
A
t / min 0 1 2 3 4
0.0 0.5 1.0
1.5 D
I / A
t / min
0 1 2 3 4
0.0 0.5 1.0
1.5 E
I / A
DPV on BDDFE in cathodic potential range requires the removal of interfering oxygen. However, the matrix of hair dyes contains high level of surfactants, which makes the most common nitrogen purging experimentally difficult because of foaming. Therefore, DPV on BDDFE in cathodic potential range and HPLC with electrochemical detection show the most favourable properties. 4A3NP was found in dye shade 7-77, where its presence is also declared; otherwise, the presence of aminonitrophenols was not observed. The content of 4A3NP was determined by standard addition method; results are summarized in Table 3 and selected chromatograms and DP voltammograms are shown in Fig. 6. The obtained values are in good agreement, except for DPV on CPE in anodic potential region, where the determination is complicated by the interference of another peak.
4. CONCLUSIONS
BDDFE and CPE were used as the working electrodes during the experiments in order to compare their performance. BDDFE dominates over CPE in lower background current, lower inclination to passivation, and potential window width, also due to the oxygen present in the paste. On the other hand, the reversibility of the electrode reaction on BDDFE is lower, which also negatively influences the height of DPV peaks. For the voltammetric determination of aminonitrophenols in hair dyes, the latter two parameters are most important. In amperometric detection, BDDFE exhibits slightly higher signal to noise ratio, which results in the lower detection limits. Nevertheless, for the HPLC determination of aminonitrophenols in hair dyes, the performance of the electrodes is comparable; the difference might be more limiting if more demanding determinations are performed.
Several methods for the determination of five isomers of aminonitrophenol in hair dye samples were developed: DPV on CPE in anodic potential range (supporting electrolyte B-R buffer pH 5, containing 10 % (v/v) of methanol), DPV on BDDFE in cathodic potential range (supporting electrolyte B-R buffer pH 6, containing 10 % (v/v) of methanol), HPLC separation (column LiChroCART 125-4 Purospher STAR RP-18E (5 m), mobile phase B-R buffer pH 2 containing 35 % (v/v) of methanol) with spectrophotometric detection (DET = 215 nm), amperometric detection on
CPE (EDET = 0.8 V) and amperometric detection on BDDFE (EDET = 1.0 V). Voltammetric methods
are naturally less selective and therefore not suitable for some combination of present compounds because of the possible peak overlapping. On the other hand, the determination is quick and undemanding, which might be advantageous for some applications. HPLC with spectrophotometric detection also exhibits lower selectivity due to its response to all present compounds. HPLC with amperometric detection possesses the most favorable properties, although its sensitivity is slightly lower than in case of spectrophotometric detection.
ACKNOWLEDGEMENTS
References
1. IARC Monographs on the Evaluation of the Carcinogenic Risks to Humans, Vol 57, Lyon, 1993. 2. L.S. Gold, T.H. Slone, B.R. Stern, L. Bernstein, Mutat. Res., 286 (1993) 75.
3. F. Chen, S. Oikawa, Y. Hiraku, M. Murata, N. Yamashita, S. Kawanishi, Cancer Lett., 126 (1998) 67.
4. H. Sosted, T. Menne, Contact Dermatitis, 52 (2005) 317. 5. R.E. Albert, Environ. Health Perspect., 105 (1997) 940.
6. Regulation (EC) No 1223/2009 of the European Parliament and of the Council of 30 November 2009 (eur-lex.europa.eu) (Accessed 9.11.2010).
7. W. Yu, W. Chen, X. Zhou, L. Wang, X. Sun, C. Wang, H. Chen, Fenxi Ceshi Xuebao, 28 (2009) 975.
8. O. Nunez, T. Ikegami, K. Miyamoto, N. Tanaka, J. Chromatogr. A, 1175 (2007) 7.
9. T. Ikegami, T. Hara, H. Kimura, H. Kobayashi, K. Hosoya, K. Cabrera, N. Tanaka, J. Chromatogr. A, 1106 (2006) 112.
10.V. Andrisano, R. Gotti, A.M. DiPietra, V. Cavrini, Chromatographia, 39 (1994) 138. 11.S.-P. Wang, H.-J. Chen, J. Chromatogr. A, 979 (2002) 439.
12.Q.X. Li, M.S. Zhao, S.J. Gee, M.J. Kurth, J.N. Seiber, B.D. Hammock, J. Agric. Food Chem., 39 (1991) 1885.
13.M. Narita, K. Murakami, J.-M. Kauffmann, Anal. Chim. Acta, 588 (2007) 316. 14.D.M. Radzik, J.S. Brodbelt, P.T. Kissinger, Anal. Chem., 56 (1984) 2927. 15.I.G. Casella, M. Contursi, J. Electrochem. Soc., 154 (2007) D697.
16.R.N. Adams, Anal. Chem., 30 (1958) 1576.
17.J. Zima, I. Svancara, J. Barek, K. Vytras, Crit. Rev. Anal. Chem., 39 (2009) 204. 18.I. Svancara, K. Vytras, J. Barek, J. Zima, Crit. Rev. Anal. Chem., 31 (2001) 311. 19.J. Barek, A. Muck, J. Wang, J. Zima, Sensors, 4 (2004) 47.
20.R.G. Compton, J.S. Foord, F. Marken, Electroanalysis, 15 (2003) 1349.
21.H. Girard, N. Simon, D. Ballutaud, M. Herlern, A. Etcheberry, Diam. Relat. Mater., 16 (2007) 316. 22.A. Kraft, Int. J. Electrochem. Sci., 2 (2007) 355.
23.K. Peckova, J. Musilova, J. Barek, Crit. Rev. Anal. Chem., 39 (2009) 148. 24.R. Trouillon, D. O'Hare, Electrochim. Acta, 55 (2010) 6586.
25.M.A.T. Gilmartin, J.P. Hart, Analyst, 117 (1992) 1613.
26.K. Cizek, J. Barek, S. Kucukkolbasi, M. Ersoz, J. Zima, Chem. Anal., 52 (2007) 1003.
27.M. Wei, Y. Zhou, J. Zhi, D. Fu, Y. Einaga, A. Fujishima, X. Wang, Z. Gu, Electroanalysis, 20 (2008) 137.
28.J. Zima, H. Dejmkova, J. Barek, Electroanalysis, 19 (2007) 185.
29.J. Inczedy, T. Lengyel, A.M. Ure, Compendium of Analytical Nomenclature (Definitive Rules 1997), Blackwell Science, Santa Fe, NM, USA, 1998.
30.J. Musilova, J. Barek, K. Peckova, V. Vyskocil, J. Fischer, Proceeding of conference 59. Zjazd chemikov – Tatranské Matliare, ChemZi, 1/3 (2007) 165.
31.L. Luo, X. Zou , Y. Ding , Q. Wu, Sens. Actuators B, 135 (2008) 61. 32.I. Svancara, K. Schachl, Chem. Listy, 93 (1999) 490.