EC Structural Funds
-The Structural Funds
in 1996
Eighth annual report
COM(97) 526
30 October 1997
Note to the reader
This report has been prepared by the Directorate-General for Regional Policy and Cohesion (DG XVI) in collaboration with the Directorates-General for Employment, Industrial Relations and Social Affairs (DG V), Agriculture (DG VI) and Fisheries (DG XIV) and with contributions from the Directorates-General for Competition (DG IV), Transport (DG VII), Environment, Nuclear Safety and Civil Protection (DG XI), Science, Research and Development (DG XII), Telecommunications, Information market and Exploitation of Research (DG XIII), Internal Market and Financial Services (DG XV), Energy (DG XVII), Budgets (DG XIX) Financial Control (DG XX) and Enterprise Policy, Distributive Trades, Tourism and Cooperatives (DGXXIII).
A great deal of additional information on the European Union is available on the Internet. It can be accessed through the Europa server (http://europa.eu.int).
Cataloguing data can be found at the end of this publication.
Luxembourg: Office for Official Publications of the European Communities, 1997
ISBN 92-828-1786-5
© European Communities, 1997
Reproduction is authorized provided the source is acknowledged.
8th Annual Report on the Structural Funds (1996)
TABLE OF CONTENTS
INTRODUCTION
A.1996
I. The first Cohesion Report 2. Support for employment
3. The implementation of assistance in I996: The main points in this report
B. A SPECIAL FOCUS ON RESEARCH AND TECHNOLOGICAL INNOVATION I. The context
2. S~,uctural Funds and development of the technological potential of the regions
PART A THE STRUCTURAL FUNDS IN 1996
CHAPTER I IMPLEMENTATION OF PROGRAMMING
3
9
11 li I3 I4
17 17 20
23
25
A. ASSISTANCE BY OBJECTIVE 27
I. General overview 27
1.1. The implementation of the Objectives in 1996 27
1.2. 1996 in the context of programming for 1994-99 28
2. Objectives 1 and 6 30
2.1. Implementation of Objectives I and 6 in 1996 30
2.2. 1996 in the context of programming for 1994-99 33
3. Objective 2 34
3.1. Implementation of Objective 2 in 1996 34
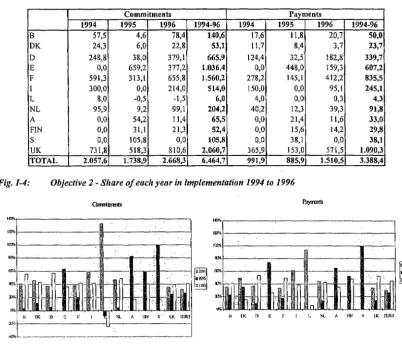
3.2. 1996 in the context of programming for 1994-96 36
3.3. Preparing for the period 1997-99 37
4. Objectives 3 and 4 39
4.1. Implementation of Objectives 3 and 4 in 1996 39
4.2. 1996 in the context of programming for 1994/95-96/99 40
5. Objective 5(a) 42
5.1. Objective 5(a) agriculture 42
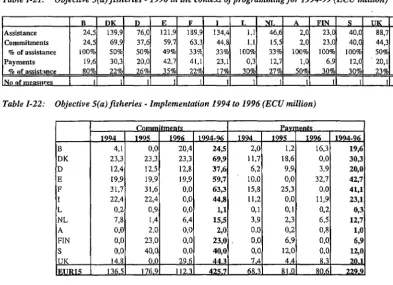
5.2. Objective 5(a) fisheries 46
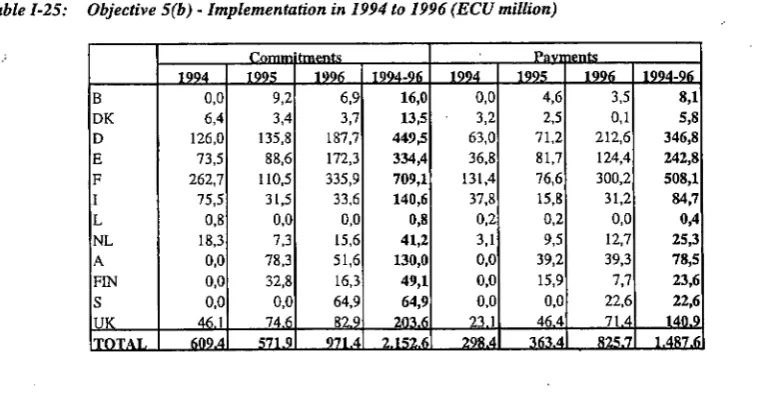
6. Objective 5(b) 48
6.1. The implementation ofObjective 5(b) in 1996 48
6.2. 1996 in the context of programming for 1994-99 49
B. OTHER ASSISTANCE 51
I. Community Initiatives 51
1.1. Overview 51
1.2. The individual Initiatives 56
2. Innovative measures and technical assistance 74
2.1. Innovative measures and technical assistance under Articles 7 and I 0 of the ERDF
Regulation 74
2.2. Innovative measures and technical assistance under A11icle 6 of the ESF Regulation 80
2.3.lnnovative measures and technical assistance under Article 8 ofthe EAGGF Regulation 81
4 8th Annual Report on the Structural Funds (1996)
CHAPTER II
BUDGET IMPLEMENTATION, CHECKS AND FINANCIAL
MANAGEMENT, COORDINATION OF THE VARIOUS FINANCIAL
INSTRUMENTS, COMPLEMENTARITY WITH THE OTHER COMMUNITY
POLICIES
85
A. BUDGETARY IMPLEMENTATION OF THE STRUCTURAL FUNDS 87
1. Budget implementation in 1996 87
1.1. General implementation in 1996 87
1.2. Implementation of each Fund in 1996 in the context of 1994-99 94
2. Implementation of programming for 1994-99 101
2.1. Implementation 1994-96 101
2.2. Implementation of each Fund in 1994-96 in the context of 1994-99 102
B. CHECKS AND FINANCIAL MANAGEMENT 107
I. Checks I 07
1.1. Checks carried out by the Commission's Structural Funds departments 107
1.2. Inspections carried out by Financial Control · I 09
1.3. Enquiries carried out by the anti-fraud unit I 09
1.4. Notification of irregularities by the Member States 109
2. Improving financial management II 0
C. COORDINATION OF THE VARIOUS FINANCIAL INSTRUMENTS 110
I. Cohesion Fund 110
2. The EIB Ill
3.ECSC 112
4. European Investment Fund 112
5. The financial mechanism of the European Economic Area 113
D. COMPLEMENTARITY WITH THE OTHER COMMUNITY POLICIES 113
I. The Structural Funds and employment 113
2. The Structural Funds and equal opportunities 114
3. The Structural Funds and the environment 115
4. The Structural Funds, the common agricultural policy and rural development 116
5. The Structural Funds and the common fisheries policy 1!7
6. The Structural Funds and SMEs 118
7. The Structural Funds and tourism 119
8. The Structural Funds and energy 120
9. The Structural Funds and trans-European Networks 121
I 0. The Structural Funds and the transparency of public contracts 123
II. The Structural Funds and competition policy 124
12. The Structural Funds, education and training 125
13. The Structural Funds and culture 125
14. The Structural Funds and disability 126
CHAPTER Ill
INTER-INSTITUTIONAL DIALOGUE, REGIONAL
PARTNERSHIP DIALOGUE WITH THE ECONOMIC AND SOCIAL
PARTNERS, INFORMATION AND COMMUNICATION
127
A. INTER-INSTITUTIONAL DIALOGUE 129
I. Dialogue with the European Parliament 129
2. Dialogue with the Economic and Social Committee 130
3. Relations with the Committee of the Regions 131
4. Informal meetings of the ministers responsible for regional policy and spatial planning 132
8th Annual Report on the Structural Funds (1996) 5
B. REGIONAL PARTNERSHIP 134
1. Consideration and promotion of new forms of partnership 134
2. Increasing the partners' capacities 136
3. Opinions of the other institutions on the application of the partnership principle 137
C. DIALOGUE WITH THE ECONOMIC AND SOCIAL PARTNERS 137
I. The socio-economic partnership in the implementation and monitoring of structural assistance 137
2. The economic and social partners at Community level 138
D. INFORMATION AND COMMUNICATION, SPREADING GOOD PRACTICE 141
I. Information and communication 141
2. Spreading good practice and exchanges of experience 143
CHAPTER IV EVALUATION
147
INTRODUCTION 149
A. PRIOR APPRAISAL OF OBJECTIVE 2 (1997-99) 149
B. ON-GOING ASSESSMENT 152
C. EX POST EVALUATION 154
I. Objective 2 1989-93 154
2. Other ex post evaluations 158
D. ASSESSMENT OF MAJOR PROJECTS 158
I. Introduction 158
2. Assessment of the appraisals 160
E. THEMATIC EVALUATION AND OTHER EVALUATION ACTIVITIES 161
PART B THE STRUCTURAL FUNDS IN DETAIL
163
CHAPTER V SUMMARY BY MEMBER STATE
165
1. BELGIUM 167
\.1. Implementation of assistance by Objective in 1996 167
1.2. Implementation of the Community Initiatives in 1996 173
2. DENMARK 176
2.1. Implementation of assistance by Objective in 1996 176
2.2. Implementation of the Community Initiatives in 1996 179
3. GERMANY 182
3 .1. Implementation of assistance by Objective in 1996 182
3.2. Implementation ofthe Community initiatives in 1996 191
4. GREECE 194
4.1. Implementation of assistance by Objective in 1996 195
4.2. Implementation of the Community Initiatives in 1996 198
5. SPAIN 200
6 Blh Annual Reporl on the Structural Funds (1996)
6. FRANCE 211
6.1. Implementation of assistance by Objective in 1996 211
6.2.1mplementation ofthe Community Initiatives in 1996 220
7. IRELAND 223
7.1. Implementation of assistance by Objective in 1996 223
7.2. Implementation of the Community Initiatives in 1996 225
8.ITALY 227
8.1. Implementation of assistance by Objective in 1996 227
8.2. Implementation of the Community Initiatives in 1996 235
9. LUXEMBOURG 239
9.1. Implementation of assistance by Objective in 1996 239
9.2. Implementation ofthe Community Initiatives in 1996 242
10. THE NETHERLANDS 244
10 .1. Implementation of assistance by Objective in '1996 244
I 0.2. Implementation of the Community Initiatives in 1996 250
11. AUSTRIA 253
11.1. Implementation of assistance by Objective in 1996 253
11.2. Implementation of the Comrpunity Initiatives in 1996 258
12. PORTUGAL 261
12.1. Implementation of assistance by Objective in 1996 261
12.2. Implementation of the Community Initiatives in 1996 264
13. FINLAND 265
13.1. Implementation of assistance by Objective in 1996 265
13 .2. Implementation of the Community Initiatives in 1996 . 270
14. SWEDEN 275
14.1. In:tplementation of assistance by Objective in 1996 275
14.2. Implementation of the Community Initiatives in 1996 28J.
15. UNITED KINGDOM 283
15 .I. Implementation of assistance by Objective in 1996 283
15.2. Implementation of the Community Initiatives in 1996 291
CHAPTER VI FINANCIAL IMPLEMENT AT ION 1996
295.
TABLE 1: FINANCIAL IMPLEMENTATION BY OBJECTIVE IN 1996 297
TABLE 2: FINANCIAL IMPLEMENTATION OF THE COMMUNITY INITIATIVES 305
TABLE3: FINANCIAL IMPLEMENTATION OF TRANSITIONAL AND INNOVATIVE
8th Annual Report on the Structural Funds (1996) 7
CHAPTER VII FINANCIAL IMPLEMENTATION 1994-96
309
TABLE 1: FINANCIAL IMPLEMENTATION 1994-96 BY OBJECTIVE 311
TABLE 2: FINANCIAL IMPLEMENTATION 1994-96 OF THE COMMUNITY
INITIATIVES 319
TABLE 3: FINANCIAL IMPLEMENTATION 1994-96 OF TRANSITIONAL AND
INNOVATIVE MEASURES 328
CHAPITER VIII REGIONAL BREAKDOWN OF FINANCIAL
IMPLEMENTATION
331
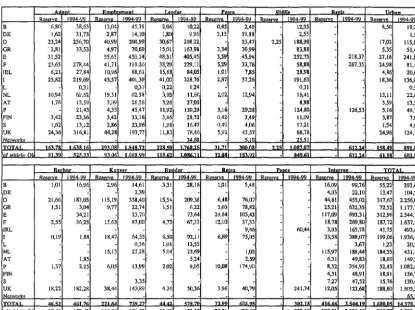
TABLE 1: REGIONAL BREAKDOWN OF FINANCIAL IMPLEMENTATION 1996 333
TABLE 2: REGIONAL BREAKDOWN OF FINANCIAL IMPLEMENTATION 1994-96 339
CHAPTER IX MAJOR PROJECTS
345
MAJOR PROJECTS 347
CHAPTER X ERDF AND ESF PILOT PROJECTS
349
8th Annual report on the Strucruml Funds (1996) 11 This Report is compiled in accordance with Article 16 of Regulation (EEC) No 2052/88 as amended
and the detailed provisions of Article 31 of Regulation (EEC) No 4253/88 as amended. It presents the
application in 1996 of the Structural Funds regulations, particularly the implementation of their Objectives (Objectives 1 to 6). The report is structured in accordance with the requirements of the Regulations, but also contains some changes. The innovation introduced in the Seventh Annual Report (1995) of dealing with a horizontal subject throughout the report has been retained, the topic chosen for this report being support for technology development. As in previous years too, full treatment has been given to the financial information and the prospects for 1996 in the context of programming for 1994-99. The structure of the report continues to evolve, however. For the first time, all the information on the various items of assistance from the Structural Funds in each Member State has been brought together in a single Chapter so as to provide an overall- but accurate- view of the structural programmes implemented in each country. Similarly, assessment activities have also been covered in a single Chapter.
The Report therefore falls into two main parts. The first- Chapters I to N- takes a general look at what was achieved in 1996 at Community level. Chapter I covers the implementation of structural assistance in 1996 (Community support frameworks and single programming documents, Community Initiatives, innovative measures) in the context of multiannual programming. This is a presentation for the Community as a whole. Chapter II looks at budget implementation in 1996, also in multiannual
terms, and other financial issues such as financial management and monitoring of utilisation. It also
covers complementarity with the other Community policies, a topic which, as in previous years, continues to receive particular attention. Chapter III is devoted to various institutional mattei·s concerning the Structural Funds, ranging from relations between the Community's different institutions to socio-economic and regional partnership and public information on the work of the
Funds. Chapter N looks at work on assessment in general, both evaluations forming part of Structural
Fund programmes (prior appraisals and interim and ex post evaluations and those carried out on more specific topics (major projects, subject-based assessments, methods of evaluation).
The second part of the Report - Chapters V to X · looks in detail at the implementation of the Structural Funds, once again from a number of points of view. Chapter V deals with programmes and achievements in each Member State. The following Chapters, which contain only financial tables, give details of financial implementation in 1996 (Chapter VI), implementation from 1994 to 1996 (Chapter VII), the regional breakdown of financial implementation (Chapter VIII), major projects (Chapter IX), and ERDF and ESF pilot projects (Chapter X).
A. 1996
1. The first Cohesion Report1
The Commission adopted the first Report on Economic and Social Cohesion in November 1996, in accordance with Article 130b of the EC Treaty, which requires a report "on the progress made towrn:-ds achieving economic and social cohesion and on the manner in which the various means provided for in this Article have contributed to it". The report analyses progress towards cohesion in the Member States, the regions and social groups and the effects on cohesion of the policies of the Member States and the Union.
The Member States have demonstrated constant progress towards greater convergence over the last ten years. Per capita income in the four poorest Member States has risen from 66% of the Community average to 74%. Unemployment is now the main economic challenge facing Member States. Although 7 million net jobs have been created over the last ten years, this has not absorbed the increase in the labour force so that the total number unemployed in the Union in 1995 was 18 million, a rate of just under 11%. Unemployment is particularly high in Spain, where it now accounts for one quarter of the labour force, and in Finland, where the figure has risen sharply to one-sixth of the labour force.
12 8th Annual report on the Structural Funds (1996)
The regions at the centre of the Union are considerably richer than those on the periphery, i.e. Greece, southern Italy, southern Spain, Portugal, Ireland, northern Finland, the new Lander, the French overseas departments. The 25 richest regions have an average per capita income two and a half times greater than the poorest regions and the situation has hardly changed in this respect over time. In 1995 the unemployment rate in the 25 worst hit regions was 22.4%, almost five times higher than in the 25least affected regions (4.6%). There is a high concentration of unemployment at sub-regional level, particularly in urban areas, where the numbers unemployed may account for between one third and . one half of the labour force.
Disparities in income are caused not only by geographical but also by social factors. This report looks at the proportion of the population living below the poverty line (defined as an income of 50% or less of the national figure). At the end of the 80s, the highest figures in this regard were recorded in Portugal (27%), Italy (22%), Greece (20%), Spain (17%) and the United Kingdom (17%). Poverty appears to be increasing slightly, although it has fallen in some of the poorest Member States (Ireland, Spain and Portugal). Poverty is frequently related to unemployment, which itself has a substantial impact on society: in the first half of 1996, the rate of unemployment among young people under 25 years of age was 21%, double the average for all age groups together where it stood at 12.5% for women and 9.5% for men. The most worrying feature is the "hard core" of long-term unemployed: in 1995, 49% of people out of work had been looking for a job for a year or more.
The report also looks at the impact of national policies on cohesion. From a macroeconomic viewpoint, the Member States have, in general, made considerable progress in bringing inflation and interest rates under control and reducing the public debt and deficits. These results are important, because they are a pre-condition for increased investment and the success of cohesion policies. The regional policies of the Member States also make a contribution, but expenditure is concentrated mainly in the richest countries. Between 1989 and 1993, Germany and Italy alone accounted for two
thirds of total expenditure on regional development. It should also be noted that budgetary restrictions
generally result in a fall in national expenditure on regional policy.
The main means of fighting poverty are national policies on taxation and public expenditure. Typical figures for these net transfers are 4% of GDP from regions which are net contributors and 8% of GDP to those which are net beneficiaries. These transfers have had a substantial influence on regional and social cohesion and have reduced income disparities within the Member States by an average of 23%.
Combined with national efforts, the Union's cohesion policies have helped create a new situation in Europe which gives the less-favoured regions and social groups new opportunities. Assistance from the Structural Funds has had a significant impact on per capita income, for example, by increasing growth in the four poorest countries by half a percentage point per year. It is also estimated that it has resulted in over 600 000 net new jobs in those countries and 530 000 in the old industrial areas eligible under Objective 2, which in both cases means a reduction in unemployment rates of about
2.5%. An in-depth study of the rural areas eligible under Objective S(b) in 20 regions shows that the
population has stabilised in about half of them and has even increased in six others. Income fell in only two of those regions. By assisting the poorest regions, Community policies have increased the economic potential of the whole Union. Estimates suggest, for example, that for every ECU 100 spent in the Objective 1 regions, ECU 30 to 40 return to benefit other regions through their exports to the Objective 1 regions.
8th Annual report on the Structural Funds (1996) 13
number of profitable holdings. After the reform, disparities were reduced, although to a lesser extent . than if the Commission's proposal to cap direct aids had been accepted.
The Cohesion Report shows that all regions and all sections of society may benefit from those Community policies where expenditure is lower but which create a climate for change. However, the more central regions and the more advantaged social groups are often better placed to do so. For example, the single market has had a considerable impact on competitiveness throughout the Union, despite unfounded fears that it would prove crushing for the poorer countries. Spain, Portugal and Ireland in particular have seen their chances of finding export opportunities grow. However, as regards trade and investment, the position of Greece and southern Italy has scarcely improved. Turning to transport networks, the countries eligible under the Cohesion Fund have seen improvements in passenger transport although it is true that the countries at the centre of the . Community, at the very heart of the transport network, benefit still more from these policies. In the case of telecommunications networks, the infrastructure required to develop the information society is less advanced in the poor regions, which undoubtedly threatens to widen the gap between rich and poor regions in this respect2.
The Cohesion Report concludes by looking at ways of making the policies more effective. Here too, the watchword is shared responsibilities. The Member States must take the initiatives required to reduce public debt while maintaining programmes based on investment, growth and job creation; the Community policies other than cohesion policy can in turn improve synergies and coordination with the goals of cohesion. The Structural Funds should concentrate more on the most serious problems and the regions in difficulty. Administrative procedures require simplification and the system of monitoring and evaluation must be made more rigorous. The partnership with those. involved at regional and local level and with the private sector could be developed. Finally, the Structural Funds must give priority to combating unemployment and creating lasting jobs and the instruments used must reflect this priority.
2. Support for employment
During 1996 the employment situation remained a major cause for concern within the Union. The guidelines for· macroeconomic policy offer a consistent framework for a lasting solution to employment problems, and the multiannual programmes of the Member States adopted in accordance with the recommendations of the Essen and Madrid European Councils are ofthe utmost importance, since they embody strategic commitments to making the labour market more efficient and increasing investment in human resources. These practical policies therefore ensure synergy with assistance from the Structural Funds. In its communication on Community structural assistance and employment3, the Commission pointed to the growing need to ensure consistency between the strategy of the Union and the measures in the Member States part-financed by the Structural Funds. That communication is part of the Confidence Pact for employment4, which seeks in particular to use the available financial margins in various ways: to support innovative measures for small firms; to improve the dynamic management of employment and investment in human resources; to increase compatibility between working life and family life; and to promote local initiatives for development and employment. The Confidence Pact also stresses the need to improve the political, economic and social partnership in order to improve the way local potential is used to encourage job creation.
In 1996, implementation of this framework for action took two main directions. On the one hand, the communication on Community structural assistance and employment provided a basis for the Commission's guidelines to the Member States in preparation for the second phase of programming
for Objective 2 (1997-99)5. On the other, at the Florence European Council in June 1996, the
2 See part B of this chapter: A special focus on technology development.
3 COM(96) 109 final of 20 March 1996. See Chapter II. D. Complementarity with the other Community policies.
4 CSE(96) 1 final of 5 June 1996.
14 8th Annual report on the Structural Funds (1 996)
Commission proposed promoting territorial pacts for employment to complement existing national policies. At the invitation of the European Council, the pilot regions were selected by the Member States. That approach was confirmed by the Dublin European Council, which called for the swift implementation of 60 pilot projects with the aim of promoting broad regional or local partnerships· demonstrating an exceptional level of mobilisation for employment. Following assessment of the difficulties and prospects by each of the local parties concerned, a joint strategy based on that assessment is devised and given form in commitments by all those involved in a territorial employment pact, with the aim of improving the integration and coordination of measures for employment and, over time, carrying out model operations which can inspire other initiatives.
An employment pact may be promoted at regional or local level, in cities, rural areas or employment areas, provided that unemployment is a major problem and the region is eligible under one of the Objectives of the Structural Funds. The range of partners should be as wide as possible6. As regards the schedule and financing, the reflection phase began at the end of 1996 and the Member States are expected to make the final selection of pact areas in 1997. The pacts can be financed in part by contributions from the EIB and the ElF, and the Monitoring Committees for the Structural Fund
programmes should use the financial margins for manoeuvre available7 to implement them. The
Commission contributes to implementation of the pads in three ways: by supporting these initiatives and circulating the experience gained from them; by providing financial support for preparatory technical assistance work and by organising a mechanism to monitor all the preparatory work, the final content, and the improvements made to structural assistance.
3. The implementation of assistance in 1996 : The main points in this report
A very busy year
The implementation of multiannual programming in 1996 shows that the various forms of assistance are now being put into effect in the Member States and the regions8. The Objectives of the Structural Funds are being implemented through almost 500 individual operations; of these only 50 for all the Objectives taken together, representing less than 3% of total assistance under all the Objectives, were additional to the programmes already adopted in 1994 et 1995. The Objective 2 programmes adopted in 1994 for 1994-96 were wound up and there was active preparation concerning the areas eligible and the main thrust of those to continue them in 1997-99. During the preparation of these programmes, the plans for which were presented and discussed in the second half of the year, the Commission set several priorities for assistance, all of which are concerned with job creation.
Turning to the Community Initiatives, the new programme decisions (123, accounting for 17% of funding under the Community Initiatives, including the reserve) meant that almost all the Initiatives have been translated into operational programmes, half of them in their entirety; 1996 was the year when all the Initiatives began to function. The financial reserve of ECU 1 665 million (at 1995 prices) was allocated by the Commission on the basis of a number of priorities - combating unemployment, equal opportunities and combating exclusion, the environment and the territorial dimension of structural policies. These led to the creation of new strands: Employment "Integra" (combating exclusion), Adapt "BIS" (adaptation to the information society), Interreg II C (trans-national
cooperation on spatial development planning). In 1996 the pilot projects became active after a year's
delay: following successful calls for proposals, selection by the Commission was followed by the start of work on the ground during the year.
This meant that 1996 was a busy year in the 1994-99 programming cycle, the second year of effective implementation since most of the programmes had been adopted at the end of 1994, or in 1995
6 See Chapter III.B. Regional partnership.
7 These are the resources made available by the indexing of amounts of finance, either from the new Objective 2 programmes established for 1997-99, or from the adjustment of programmes under Objectives other than Objective 2 following the mid-term review.
8th Annual report on the Structuml Funds ( 1996) 15 (particularly in the case of the new Member States). All the Monitoring Committees, including those for the Community Initiatives, are now operational and meet once or twice a year, or sometimes more frequently9. As provided for in the regulations, their work in 1996 was mainly of three types: project selection, the adjustment of programmes to the needs of actual implementation (particularly as regards the transition between the first and second phases of Objective 2), and the introduction of interim assessment, comprising, for all assistance under the various Objectives, the selection of independent assessors, the adoption of terms of reference for the assessment reports and the fixing of dates for these reports to be completed (normally mid-1997). This meant that the delay in getting started which occurred in 1995 was made up.
Careful monitoring
As in previous years, the Commission was involved in monitoring implementation. on the ground, which entailed devoting considerable though to ways of improving and simplifying management of the Structural Funds in partnership with the Member States10. This included implementation of the
SEM 2000 guidelines ('sound and efficient management'): beginning work on a better definition of
expenditure eligible for part-financing under the Structural Funds and improvements to budget forecasting and the financial control system. The Commission also continued to improve work on assessment, whether carried out on its own initiative or that of the Member States11. This entailed support for the preparation of interim assessments to make them into programme management instruments, preparation of a detailed methodology for evaluating the account taken of the environment and equal opportunities, the completion of ex post evaluations from the previous period as part of the work on preparing the Cohesion Report, completion of an evaluation of major projects and the launching of thematic assessments on RTD, the environment, small firms and equal opportunities under the Structural Funds. In preparation for the new Objective 2 programmes and the mid-term review of the programmes under the other Objectives, the Commission continued producing policy guidelinesl2 designed to achieve the main goal of creating new jobs, principally through the territorial pacts for employment. The Commission issued communications to encourage culture and tourism as sources of economic activity to develop the regions. It also ensured that horizontal priorities such as the environment and equal opportunities are taken into account when programmes are actually implemented.
A close eye was kept on the four principles underlying the 1988 reform of the Funds. There was an improvement in the way partnership13 took shape in the Monitoring Committees although the situation varied depending on the assistance and the Member State. Realising that much remained to be done and could be done, the Commission acted in three ways: a fresh start and the search for new forms of partnership through the territorial pacts for employment, increasing the capacity of the partners through training for the local-authority· partners as well as for the economic and social partners, and consideration of ways of strengthening the partnership .without loss of effectiveness as part of the broader consideration given to the shape of the Funds after 1999.
The principle of additionality stipulates that Structural Fund resources that are applied in all areas under a given Objective in a Member State should not replace public or comparable expenditure which would otherwise be eligible under the Structural Funds, ensuring that the Community funding has full economic impact. In accordance with Article 9 of the Coordination Regulation, the Commission and the Member State concerned verify, when programmes are established, that public structural or comparable expenditure is maintained at least at the same level as in the previous programming period. Furthermore, to permit the on-going verification of this principle, the Commission and the Member State concerned agree the arrangements for verifying additionality at
9 See Chapter V. Summary by Member State.
IO See Chapter II.B. Checks and financial management. II See Chapter IV. Evaluation.
12 See Chapter II.D. Complementary with the other Community policies.
16 8th Annual ,·eport on the Structural Funds ( 1996)
the time when the programming documents are adopted. The Member State provides the Commission with relevant financial information and indications of the transparency of the financial flows in
question. After the programming period, an ex post verification is carried out to ascertain whether the
Member State has complied with its undertakings to maintain the level of expenditure in question.
During 1994, 1995 and 1996, the prior appraisal of virtually all the programmes for Objectives 1, 214
. and 6 was completed. However, two problems remained at the end of 1996: Objective 1 in France,
where the Commission was still awaiting an update of the figures in the SPDs, and Objective 2 in
Luxembourg (1994-96), where the lack of any financial information on additionality made it
impossible to resume suspended payments. In 1996, the first steps were taken towards prior
verification of additionality under the Objective 2 SPDs for 1997-99. Data provided by the national
authorities in Finland demonstrated compliance with this principle before the end of the year. Further·
information about all the other Member States was expected early in 1997.
The arrangements for the on-going assessment of additionality form part of the programming documents and are an obligation arising from the partnership agreement with each Member State. They entail the annual updating of the data initially provided in the programming documents. At the end of 1996, the results of the on-going assessment of additionality were mixed. A number of Member
States (Austria, Belgium, France, Netherlands and the United Kingdom for Objective 1; Finland and
Sweden for Objective 6) had sent the Commission no up-to-date figures. Germany, Spain, Greece and
Italy reported eligible national public expenditure lower than estimated in the prior 'Qerification of
Objective 1 and, in accordance with monitoring rules, the Commission is awaiting explanations.
Portugal has sent data on a number of occasions but methodological improvements are still expected.
In 1996 the ex post verification of additionality covered the Objective 1 programmes for 1989-93 and
the Objective 2 programmes for 1994-96. In the case of Objective 1, the situation was satisfactory for
Spain and Ireland but for Portugal the data sent require adjustment and in the case of Greece a methodological problem had to be resolved to compare the data for the two programming periods. France and Italy did not send the Commission the information required. In the case of Objective 2,
where the prior appraisal for 1997-99 and the ex post assessment for 1994-96 are being carried m:;·: in
parallel, further information on the period 1994-96 was expected early in 1997. This also applied to
the prior appraisal of the Objective 2 SPDs.
Despite delays and problems in the submission of data, the implementation of the principle of additionality has involved close and intensive cooperation between the Commission and the Member States. Although much still remains to be done to ensure the systematic transmission of uniform data to the Commission, substantial progress has already been made and this will facilitate work in the future.
Considerable financial activity
The main task in 1996 consisted of clear progress in making up the backlog, where too the situation
varies depending on the Objective and the Member State15. After the first three years, half the assistance from the various Objectives had been committed by the Commission and one third had
been paid. Financial activity in 1996 alone accounted for 37% of commitments made since 1994 (as
against 28% for 1994 and 35% for 1995) and 44% of payments for that period (as against 21% for
1994 and 35% for 1995). Similarly, the Community Initiatives took off dramatically, with over half
the assistance committed (thanks to the system of single commitments for amounts of less than ECU
40 million) and 22% paid. For most of the Initiatives 1996 was the year when they really began
operations.
14 Programmes for 1994-96.
8th Annual report on the Structural Funds ( 1996) 17
Execution of the Community budget for the Structural Funds was virtually 100% in 199616. Taking all the Funds, all the forms of assistance and all types of appropriations together, ECU 26.141 billion was committed of the ECU 26.587 billion available, a rate of 98% while rates in the first two years of programming were around 90%. Payments totalled ECU 22.448 billion out of ECU 23.678 billion available, a rate of 95% as compared with 81% in 1995. This very satisfactory rate of implementation in 1996 and the increase in appropriations available as a result of the Edinburgh decisions meant that the amounts implemented in 1996 increased very sharply: by 19% (ECU 4.203 billion) over 1995 in the case of commitments and by 30% (ECU 5.233 billion) in the case of payments.
Commitments under the various Objectives totalled ECU 23.117 billion (89% of total cominitments), of which Objective 1 accounted for 66% (ECU 15.369 billion). Shares of total commitments by Fund ranged from 2% for the FIFG (ECU 406.6 billion) to 53% for the ERDF (ECU 13.802 billion); all except the FIFG committed all the appropriations available. Payments under the Objectives amounted to ECU 20.445 billion (91% of total payments), of which Objective 1 accounted for 72%. Shares of total payments by Fund ranged from 2% for the FIFG (ECU 448 billion) to 53% for the ERDF (ECU 11.901 billion).
B. A SPECIAL FOCUS ON RESEARCH AND TECHNOLOGICAL INNOVATION
One of the characteristics of the current Structural Funds programming period (1994-1999) is the Commission's desire to strengthen coherence between the Community's structural and other policies.
While the 7th Annual Report on the Structural Funds (1995) highlighted the inclusion of
environmental concerns in all structural operations, this Report describes the operations undertaken for the technological development of the regions. Given the wide variety of measures financed by the Structural Funds, the Report covers all the measures and sectors aided by the Funds with this objective in mind, notably research and development, the information society and innovation.
1. The context
The need for complimentarity between the Community's structural and other policies is laid down in Article 130b of the EC Treaty which states that formulation and implementation of the Community's policies and actions and the implementation of the internal market must take into account the objective of strengthened economic and social cohesion, and must in particular seek to reduce
disparities between the levels of development of the various regions. In addition, Article 130f sets for
the Community the objective of strengthening the scientific and technological basis of Community industry and encouraging it to become more competitive at international level while promoting all the research activities deemed necessary by virtue of other Chapters of the Treaty. To effect the interaction required by the Treaty, when preparing the new programming period the Commission adopted guidelines in 1993 in a Cominunication entitled "Cohesion and RTD policy - synergies
between research and technological development policy and economic and social cohesion policy" 17 •
The Communication set out the national and regional disparities in living standards, expenditure and staff involved in RTD, the participation rates of the least-favoured regions in both RTD and the cohesion instruments. It also highlighted the significant disparities between the rich and least-favoured regions in terms of RTD indicators: the disparities between the Member States in terms of public expenditure on RTD, which ranged from 1 to 13 in 1993, were even greater than the disparities in GDP per inhabitant, which ranged from 1 to 5. The Communication also stressed the difficulty the least-favoured regions have in participating in the Community's framework programmes on research and development.
While observing the primary objectives of each policy, the Communication proposed that complimentarity should be increased with a view to making up for the delays in RTD in the least-favoured regions, that account should be taken of economic and social cohesion in the fourth RTD
16 See Chapter II.A. Budget implementation.
18 8th Annual report on the Structural Funds (1996)
framework programme and the importance of RTD and innovation in the development aid provided by the Structural Funds should be strengthened. This was achieved in practice by significantly increasing the Structural Fund appropriations for RTD and innovation 18. The cohesion dimension was better integrated in the 4th RTD framework programme, most notably in operations 3 (dissemination of the results) and 4 (training and researcher mobility). For example, 1% of each specific RTD framework programme is reserved for operations to disseminate and exploit the results, and an "Innovation Programme" in tandem with the operations under Article 10 of the ERDF Regulation was launched in 1995 to introduce regional innovation and technology transfer strategies (RITTS), regional innovation strategies (RIS) and regional technology transfer projects (RTT)19. In the case of researcher training and mobility, 29% of the applications for study grants come from the Objective 1-6 regions and those same regions account for 21-6% of the coordinators for Euroconferences, while host facilities in the Objective 1 regions have increased from 4% in the 3rd RTD framework programme to 15% in the 4th programme. Research workers in the Objective 1 regions also participated in many of the research projects under the 4th programme since in 1996 40% of projects implementing the RTD framework programmes included at least one participant from an Objective 1 region.
Yet the disparities persist
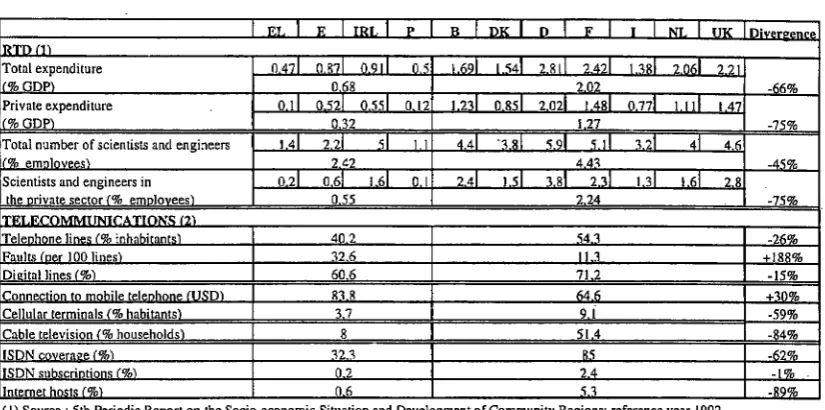
Despite this progress, the scientific and technological indicators show that the technology gap between Member States and regions is still significant. Thus, in the case of RTD expenditure, the disparities between the cohesion countries and the other Member States are very great in terms of gross expenditure as a percentage of GDP, private sector involvement and the number of scientists and engineers employed. Sources of innovation funding are harder to come by in these Member States and there is a significant trade deficit in technology. Research and innovation activities in the four Member States in question are highly concentrated in just a few regions, usually in and around the capital.
RTD • what the Report on economic and social cohesion teaches us :
The most dynamic and successful laboratories and enterprises are located in the heart of Europe in "islands of innovation" which host almost 80% of the laboratories involved in international cooperation in RTD and where an interactive network to develop new products and production processes is characteristic.
In 10 years the expenditure on RTD as a percentage of GDP has increased from 0.4% to 0.63% in Portugal, from· 0.34% to 0.6% in Greece, 0.8% to 1.24% in Ireland. In Spain, it increased from 0.48%
a
0.93%.As regards Member State participation in the RTD framework programmes, the situation is encouraging in some respects. While the relative position of the Member States in terms of expenditure on the 2nd and 3rd RTD framework programmes has not changed, the share of the four cohesion countries has increased from one framework programme to the next. At the same time, the relative position of France, the United Kingdom and Germany only increased marginally or actually decreased.
In qualitative terms, research institutes and public universities continue to be the major participants from Objec ive 1 regions, with little private sector input. New scientific knowledge has nevertheless been obtained and applied through the rapid launch of new products and production processes. Small firms find it hard to benefit from the programmes, however, and while the programmes have brought about closer cooperation between partners from the north and south of Europe, there is a risk that such closeness will diminish the research in terms of its relevance to the specific economic and industrial needs of the least-favoured regions.
The cohesion regions are much slower in adapting to the information society which involves in the first place introducing a high-performance telecommunications system. There is less access to
18 See below.
8th Annual report on the Structural Funds (1996) 19
[image:17.485.31.444.108.313.2]telecommunications networks and to funding and fewer people subscnbe to information services there than in the rest of the Community. Investment in telecommunications in the cohesion countries is, in general, 40% less than of investment in the core regions.2o.·
Table 0-1: General RTD and telecommunications indicators
I RI" I R I IRL I p B I DK I n I F I r I NL I UK
RTD (1)
Total expenditure 0471 OR71 0911 05 _L.69I U41 2 8 II 2.421 1 381 2.o6l 2.21
%GDP\ 0 68 2.02
Private expenditure o_ II 0 521 0 551 0 12 I 231 0.851 2 021 1.481 0.771 uii 147
%GOP\ 0 32 I 27
Total number of scientists and engineers 1 41 2 21 51 L1 4.41 'HI 5.91 5.11 ul 41 4.6
!(% emnlovees\ 2.42 4.43
Scientists and engineers in 021 0 6[ 161 0.1 24L !.51 3.81 2.31 I 31 I 61 28
the orivate sector(% emolovees\ 055 2 24
TF.T. • rTNTC'ATTON.<: (2)
Telenhone lines(% inhabitants\ 40.2 54.3
Faults (oer I 00 lines\ 32 6 II 3
Dioitallines (%\ 606 71 2
ronnection to mobile telenhone !USD\ 838 64.6
Cellular terminals_(% habitants\ 37 9 i
Cable television(% households\ 8 51 4
ISDN coveraoe (%\ J23 85
ISDN subscrintions (%\ 02 2.4
Internet hosts(%\ 0.6 5J
(I) Source : 5th Periodic Report on the Socio-economic Situation and Development of Community Regions: reference year 1992 (2) Source: Communication "Cohesion and the Information Society" (COM(97)7 final)
The increasing speed of technological change
-66%
-75%
-45%
-75%
-26% +188%
-15%
+30% -59% -84% -62% -l% -R9%
The pace of technological change has increased in recent years and the Community and its least-favoured regions are not always equipped to cope with it. The White Paper on Growth, competitiveness and employment highlighted the factors and conditions needed to increase competitiveness on world markets in a time of increased economic, social and technological change. On the one hand, innovation must no longer be seen as a linear process, but as the result of numerous interactions between research laboratories and enterprises either developing or using new technology. The demand for technology to meet new and increasing needs brings this interaction about. Innovation itself takes several forms and is geared as much to the products as to an enterprise's production processes and structure. In this context priority should be given to investing in intangibles in the enterprises themselves (SMEs in particular) and to balancing the demand for technology with supply (especially at regional level). Research and development must thus be extended through the dissemination of results and technology transfer, and be boosted by the need to satisfy new social needs (including, for example, the environment, health, biotechnology, culture).
On the other hand, the development of the information society is bringing about an upheaval in the way enterprises are organised, and will shortly do the same to lifestyles and working practices. A highly sophisticated ability to adjust will be required in response, with accompanying measures needed at several levels, all interlinked. Improvements to basic telecommunications services and infrastructure are needed to complete the European communications networks serving the entire Community territory. It is also necessary however to spread the use of the new information and communication technologies, to SMEs in particular, and to encourage in this regard technological awareness and RTD in this field. The changes will be accepted only if the users of the new information and communications technologies are sufficiently trained. There is thus a need to improve training for the users and the public at large by making teaching and training relevant, and for the producers of these technologies through training and vocational retraining.
20 For more information see in particular: ""European Report on the scie~tific and technological indicators 1994"
(November 1994, EUROFFICE); "Fifth periodic Report on the Socio-economic Situation and Development of
Community Regions" (1994, EUROFFICE); "First Report on Economic and Social Cohesion";
20 8th Annual report on the Structural Funds (1996)
2. Structural Funds and development of the technological potential of the regions
The Structural Funds as the instrument for lasting technology development
All the above has had an effect on Structural Funds aid in the period 1994-99. As the first Report on Economic and Social Cohesion points out, regional technology development requires policies that accompany enterprises undergoing technological change and help the workforce adjust so that regional economic structures can modernise and diversify. The Structural Funds not only provide the regions with the necessary infrastructure for this adjustment, they encourage the regional and local actors to increase regional competitiveness by basing it on innovation and high-valued added industries. To achieve this, investment in technology development has increased strongly between the first and second programming periods, passing from ECU 3.5 billion to ECU 7.5 billion, i.e. 6% of the Community funding.2I.
The approach too has evolved. In the first programming period, the Structural Funds aimed above all
to improve regional capabilities in science and technology by improving RTD infrastructure22 and by helping to develop skills formerly unexploited. This assistance helped public administrations to appreciate the strategic importance of technology development for regional productivity, it encouraged both the forging of links between universities and business and private sector
involvement, and facilitated access to the RTD framework programme. In numerical terms, the
Objective 2 regions devoted the greatest share of appropriations to RTD (9% of the total budget, as against 3% in the Objective 1 regions), but Community funding in 1994 accounted for a fifth of national spending on research and development in Ireland and a third in Portugal.
The programmes for the period 1994-99 promote a new approach. In the first place, the share devoted to the development of technological potential in the Objective 1 regions has increased appreciably (6.5% compared to 2% earlier), while the share in the Objective 2 regions has reached 19% and the place of new technologies and their dissemination is increasing in the other Objectives and the Community Initiatives. Secondly, it would appear that the regional capacity to innovate and adopt
new technologies depends not only on regional supply (R & D capacity and mechanisms to spread the
technology), but also, and to an increasing extent, on demand, or more precisely the receptiveness of the ecoi).omic structure (in particular the SMEs) which is often insufficient because unable to identify · and express its needs. The current programmes therefore try to strengthen enterprise involvement in technology development, to encourage technology transfer from the most developed to the least developed regions and to train users by investing in research infrastructure and developing a definitive strategy based on the market demand rather than on the scientific and technological supply.
21 See Chapter I.A. Assistance by Objective.
8th Annual report on rite StruclUral Funds (1996) 21 More support for technology development is needed
While qualitative progress has undoubtedly been achieved, thanks in particular to the boost given by the Community Initiatives and pilot projects, more assistance is necessary. In the field of research and technology development, 1996 provided an opportunity to reassess the relationship between the ·cohesion policy and the RTD policy. The relationship was on the one hand studied in the first Cohesion Report. Then, following the conclusions of the panel assessing RTD measures taken during the last five years, in April 1997 the Commission adopted the proposal on the 5th framework
programme for 1999-02.23 Following the Green Paper on Innovation24, it also adopted an Action Plan
'tor Innovation25 . It also decided to prepare a Communication on cohesion, innovation, RTD and
competitiveness, extending the 1993 communication on the same subject. This was adopted in 1997.
On information technologies, the Commission adopted a Communication entitled "Cohesion and the information society"26 with a view to having greater account taken of this new dimension in the
Structural Fund programmes. The Communication recognises the interdependence of economic and social cohesion and the development of the information society in Europe. This involves successfully exploiting the interaction between these two spheres of activity at increasingly sophisticated levels of complimentarity. The introduction of the information society is a pivotal factor for regional development. The new developments in information and communications technologies have significant and inescapable effects on employment opportunities, lifestyles and the regional organisation and spread of economic activity. The information society affects the ability of enterprises to diversify and adapt their product range, to increase their penetration into regional and local markets and to imagine new and more effective forms of organisation. The general impact of the information society on all society activities, i.e. education and training, health services, leisure and recreations, public administration, etc, is also creating a new pattern for social relationships.
While the communication acknowledges the Structural Funds' contribution to completing and ·improving telecommunications infrastructure, it also calls for a new approach. A whole series of factors going beyond telecommunications alone are a precondition for true entry into the information society, among which can be cited, the educational and training levels reached by the general population, the roles of the public and private sectors in promoting the information society, public awareness, the ability to organise and invest in an efficient information society strategy. In this regard the communication recognizes the extra effort that must be made as regards telecommunications infrastructure and legislation so that cohesion might be more effectively integrated into the process. The communication notes however that a major effort is needed to stimulate demand by identifying the regional strategies for the information society, by developing training programmes for businessmen and public administrators, by supporting new applications development, by launching public information campaigns through the establishment of public/private partnerships. The Structural Funds are the instrument through which such an integrated, coordinated approach can be developed and through which inter-regional partnerships can be tried out.
23 COM(97) 142 final of 30 April 1997. See also the Communications "Inventing tomorrow- Europe's research
at the service of its people" COM(96) 332 final of 10 July 1996; "Towards the 5th Framework Programme: Additional material for the policy debate" (96) 595 final of 20 November 1996; "Towards the 5th Framework Programme: scientific and technical objectives", COM(97) 47 of 12 February 1997.
24 COM(95) 688 final of 13 December 1995.
25 The First Action Plan for Innovation in Europe, COM(96) 589 final of 21 November 1996,.
8th Annual Report 011 the Structural Funds (J 996) 27
A. ASSISTANCE BY OBJECTIVE1
1. General overview
1.1. The implementation of the Objectives in 1996
The main feature of 1996 was the implementation on the ground of programmes already under way. Although 1996 was the third year of the 1994-99 programming period, it was, for most Objectives, Member States and regions, and for most measures, only the second full year of activity. The Commission adopted only 50 new measures (35 OPs, 8 SPDs, 3 major projects, 4 global grants), which concern Objective 1 of the Greek, Spanish, Irish and Italian CSFs, Objective 3 (United Kingdom only), Objective 5(a) with the adoption of all the OPs under the Italian CSF, and the final stages in launching programming in Sweden with the adoption of the Swedish SPDs under Objectives 4, 5(a) and 5(b). The new assistance totals ECU 3 448 million (comprising 55% from the ESF, 32% from the ERDF and 13% from the EAGGF), and represents less than 3% of total assistance adopted for 1994-99 as a whole.
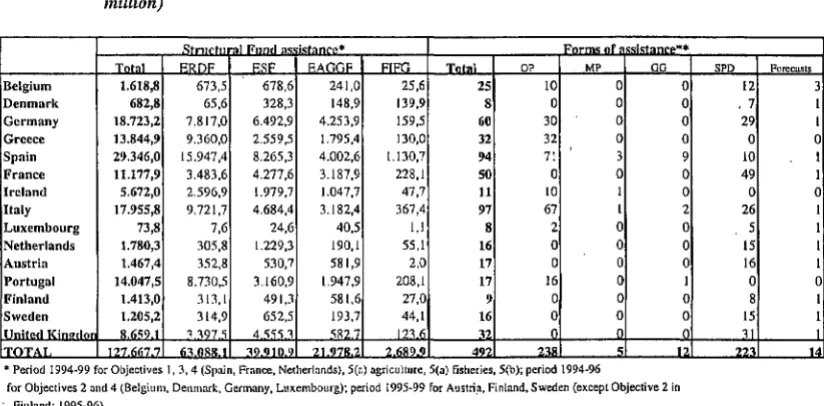
[image:22.486.29.441.343.546.2]Structural Fund programming now involves 492 forms of assistance (i.e. OPs, SPDs, global grants and major projects), by far the largest proportion in the form of SPDs and OPs, which account for 48% each of the total number of measures (global grants account for 2% and major projects for 1 %). On average, taking all Objectives together, there are 33 measures per Member State; however, the range is wide, from 8 in Denmark and Luxembourg to 97 in Italy.
Table 1-1: CSFISPD- Assistance and number of programming documents at the end of 1996 (ECU
million)
.~trnrtn I Fund •••,l<tonr•* Fnrm< nf <<l<lone•**
Tntol F.ROF F.SP F.AGGF FTFG Tnt• I OP MP GG
Belgium 1.618,8 673,5 678,6 241,0 25,6 25 10 0 0
Denmark 682,8 65,6 328,3 148,9 139,9 8 0 0 0
Germany 18.723,2 7.817,0 6.492,9 4.253,9 159,5 60 30 0 0
Greece 13.844,9 9.360,0 2.559,5 1.795,4 130,0 32 32 0 0
Spain 29.346,0 15.947,4 8.265,3 4.002,6 l.l30,7 94 71 3 9
France 11.177,9 3.483,6 4.277,6 3.187,9 228,1 so 0 0 0
Ireland 5.672,0 2.596,9 1.979,7 1.047,7 47,7 11 10 I 0
Italy 17.955,8 9.721,7 4.684,4 3.182,4 367,4 97 67 1 2
Luxembourg 73,8 7,6 24,6 40,5 1,1 8 2 0 0
Netherlands 1.780,3 305,8 1.229,3 190,1 55,1 16 0 0 0
Austria 1.467,4 352,8 530,7 581,9 2,0 17 0 0 0
Portugal 14.047,5 8.730,5 3.160.9 1.947,9 208,1 17 16 0 1
Finland 1.413,0 313,1 491,3 581,6 27,0 9 0 0 0
Sweden 1.205,2 314,9 652,5 193,7 44,1 16 0 0 0
!United KiMdor 8.659.1 1 W7.S 4 'i'iS 1 'i32. 12.'1.6 32 0 0 0
I TOTAL 127.667. 6~.0RR.l 39.910.' 21.978. 2.689.9 492 2111 n
• Period I 994-99 for Oojectlves 1, 3, 4 (Spain, France, Netherlands), 5(a) agriculture, 5(a) fisheries, 5(b); period 1994-96
for Objectives 2 and 4 (Belgium, Denmark, Germany, Luxembourg); period 1995-99 for Austria, Finland, Sweden (except Objective 2 in · Finland: 1995-96)
SPD 12 ,7 29 0 10 49 0 26 5 IS 16 0 8 15 l l _223
** Operational progrnmmes; major projects; globnl grnnts; single programming documents: forecasts of implementation for Objective 5(a) agriculture.
Fmcca._~ s
3 I I 0 1 I 0 1 1 1 1 0 1 1 1 14
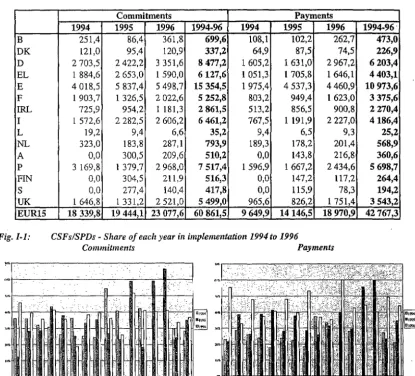
Much of the delay in launching programmes that occurred in 1994 was made up in 1996 as programming was implemented. This is illustrated by financial implementation: commitments made in 1996 represent 37% of total commitments since 1994, taking all the Objectives together; and, even more significantly, payments in 1996 alone represent 44% of total payments since 1994, which is a sign that the measures have now taken off. Implementation also involved more and closer monitoring of programmes under the Monitoring Committees, where the Commission encouraged the sound financial management of assistance, the selection of projects in line with by the Community's priorities (combating unemployment, conserving the environment, promoting equal opportunities,
1 Throughout this Report, unless otherwise specified, sums of money are expressed at current prices, i.e. in the
context of programming, prices for the year the assistance was adopted and amended, and in the context
28 8th Annual Report on the Structural Funds ( 1996)
supporting small firms), and the introduction of an effective and efficient system of interim
assessment. 1996 was also the year for preparing the second stage of programming for Objective 2
assistance and some Objective 4 programming2.
1.2. 1996 in the context of programming for 1994-99
By the end of 1996, practically all the assistance planned for 1994-99 had been adopted. Programme implementation had gathered pace rapidly over the three years and now reached cruising speed for most Objectives, Member States and assistance. Comparing 1996 with the first two years, we find that
37% of commitments for the period 1994-96 were made in 1996, 28% in 1994 and 35% in 1995. On
the payments side, the picture is even clearer: of payments made since 1994, 44% were made in 1996
compared with 21% in 1994 and 35% in 1995.
Table 1-2: CSFs/SPDs- Implementation 1994 to 1996 (ECU million)
Commitments Payments
1994 1995 1996 1994-96 1994 1995 1996 1994-96'
B 251,4 86,4 361,8 699,6 108,1 102,2 262,7 473,0
DK
121,0 95,4 120,9 337,2 64,9 87,5 74,5 226,9D
2 703,5 2 422,2 3 351,6 8 477,2 1 605,2 1 631,0 2 967,2 6 203,4EL 1 884,6 2 653,0 1 590,0 6127,6 1 051,3 1 705,8 1 646,1 4 403,1
E 4 018,5 5 837,4 5 498,7 15 354,5 1 975,4 4 537,3 4460,9 10 973,6
F I 903,7 1 326,5 2 022,6 5 252,8 803,2 949,4 1 623,0 3 375,6
IRL 725,9 954,2 1 181,3 2 861,5 513,2 856,5 900,8 2 270,4
I l 572,6 2 282,5 2 606,2 6 461,2 767,5 1 191,9 2 227,0 4186,4
L 19,2 9,4 6,6 35,2 9,4 6,5 9,3 25,2
NL 323,0 183,8 287,1 793,9 189,3 178,2 201,4 568,9
A 0,0 300,5 209,6 510,2 0,0 143,8 216,8 360,6
p 3 169,8 1 379,7 2 968,0 7 517,4 1 596,9 1 667,2 2 434,6 5 698,7
FIN 0,0 304,5 211,9 516,3 0,0 147,2 117,2 264,4
s
0,0 277,4 140,4 417,8 0,0 115,9 78,3 194,2UK I 646,8 I 331,2 2 521,0 5 499,0 965,6 826,2 1 751,4 3 543,2
EUR15 18 339,8 19 444,1 23 077,6 60 861,5 9 649,9 14146,5 18 970,9 42767,3
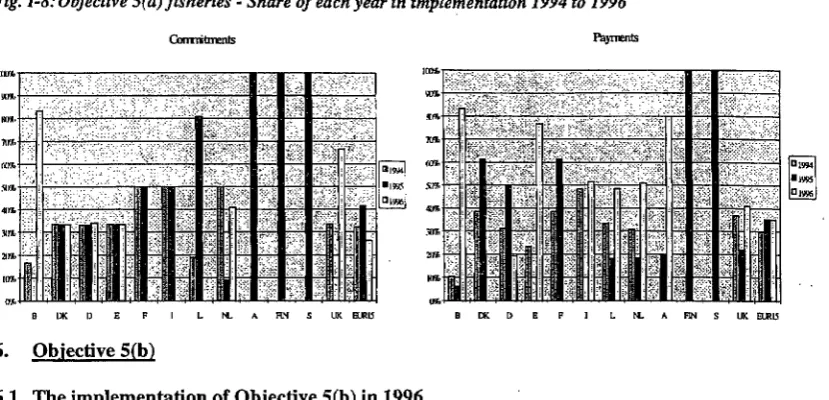
Fig. I-I: CSFs/SPDs- Share of each year in implementation 1994 to 1996
Commitments Payments
·~r-:----...,---...,---,-,---,
< .
'
.I
~~j ;
1,1
I
I I L I'I
.
li I I I ' ·,1 :i :1 'II . 1.·~""i ... L4'"'1 """"' u.' ""': """"l _...1 ....,...! 4""'-"-"'-"""""'-"'-' ... """-" L
'
Financial implementation in the first three years in relation to the overall financing planned for the
period 1994-99 confirms this gathering momentum. Taking all the Objectives together, the share of
financing committed represents almost half the total, and the share paid represents one third of that for
the whole period. However, the situation varies from one Objective to another. Objective 2 is a
special case: the rate of implementation during the first phase, 1994-96, should be assessed in the light of the delay in launching the programmes, which led to a reduction in the amount originally allocated to the first phase, with transfer of financing to the second phase, 1997-99. Of the financing originally
[image:23.494.40.455.224.599.2]