M E T H O D O L O G Y
Open Access
A new high-throughput method for simultaneous
detection of drug resistance associated mutations
in
Plasmodium vivax dhfr
,
dhps
and
mdr1
genes
Céline Barnadas
1,2†, David Kent
3†, Lincoln Timinao
1, Jonah Iga
1, Laurie R Gray
4, Peter Siba
1, Ivo Mueller
1,2,5,
Peter J Thomas
3*and Peter A Zimmerman
4*Abstract
Background:Reports of severe cases and increasing levels of drug resistance highlight the importance of improvedPlasmodium vivaxcase management. Whereas monitoringP. vivax resistance to anti-malarial drug byin vivoandin vitrotests remain challenging, molecular markers of resistance represent a valuable tool for high-scale analysis and surveillance studies. A new high-throughput assay for detecting the most relevant markers related to
P. vivaxdrug resistance was developed and assessed on Papua New Guinea (PNG) patient isolates.
Methods:Pvdhfr, pvdhpsandpvmdr1fragments were amplified by multiplex nested PCR. Then, PCR products were processed through an LDR-FMA (ligase detection reaction - fluorescent microsphere assay). 23 SNPs, including
pvdhfr57-58-61 and 173,pvdhps 382-383, 553, 647 andpvmdr1976, were simultaneously screened in 366 PNGP. vivaxsamples.
Results:Genotyping was successful in 95.4% of the samples for at least one gene. The coexistence of multiple distinct haplotypes in the parasite population necessitated the introduction of a computer-assisted approach to data analysis. Whereas 73.1% of patients were infected with at least one wild-type genotype at codons 57, 58 and 61 ofpvdhfr, a triple mutant genotype was detected in 65.6% of the patients, often associated with the 117T mutation. Only one patient carried the 173L mutation. The mutant 647Ppvdhpsgenotype allele was approaching genetic fixation (99.3%), whereas 35.1% of patients were infected with parasites carrying thepvmdr1976F mutant allele.
Conclusions:The LDR-FMA described here allows a discriminant genotyping of resistance alleles in thepvdhfr,
pvdhps, andpvmdr1 genes and can be used in large-scale surveillance studies.
Background
Plasmodium vivaxis the most widespread of the malaria parasites infecting human hosts and may be responsible for up to 400 million infections each year [1,2]. The widespread belief that this parasite causes only benign malaria has been challenged recently by reports of severe pathology, including cerebral malaria, acute respiratory distress, acute renal failure, and severe
anaemia in patients with P. vivax infections [3-6]. In addition, there are increasing worldwide reports of treat-ment failure after administration of the standard drug regimens, mainly chloroquine (CQ) [7-15]. New drugs are now available, but they are significantly more costly than CQ plus primaquine, the standard treatment for vivax malaria for the last 50 years [16]. In order to change their treatment policies based on local evidence, countries need efficient methods to assess potential for resistance to current standard treatments.
Monitoring in vivo drug resistance remains challen-ging due to the ability ofP. vivax to relapse from long-lasting liver stages. At the same time, the recurrence of parasitaemia due to de novo infection can confound
* Correspondence: [email protected]; [email protected] †Contributed equally
3
Department of Mathematics, Case Western Reserve University, Cleveland, USA
4
Center for Global Health and Diseases, Case Western Reserve University, Cleveland, USA
Full list of author information is available at the end of the article
evaluation of treatment efficacy. Genotyping of recurrent infections [17] makes it possible to distinguish infection by parasites with different genotypes (new infections) [18,19] from infection by parasites with identical geno-types (whether due to relapse or to recrudescence from blood-stage parasites that survived drug treatment) [20]. Of course, even molecular diagnosis cannot distinguish persistent infection fromde novo infection by a geneti-cally identical parasite. In vitro assays, which should provide drug susceptibility data free from the effects of confounding factors, such as host immunity, are still dif-ficult to conduct because of the lack of stable, continu-ousP. vivax in vitro culture [5,21]. Molecular markers of resistance, therefore, represent a useful tool to moni-tor the introduction and spread of anti-malarial resis-tance. ForP. vivax, these markers include mutations in genes encoding the dihydrofolate reductase (PvDHFR) and the dihydropteroate synthase (PvDHPS) that are involved in drug resistance to antifolates (pyrimetha-mine) [22], and sulphonamides (sulphadoxine) [23], respectively. The 976F mutation in the gene encoding the multidrug resistance 1 protein (PvMDR1), which has been associated with 4-aminoquinolines (amodiaquine, CQ) resistance in some [21,24] but not all studies [21,25].
Further investigations are needed to assess the predic-tive value of molecular markers; their use in monitoring of P. vivaxdrug resistance needs to be addressed, geo-graphically, at both a local and a large-scale level [26]. For these reasons, a new assay was developed to detect single nucleotide polymorphisms (SNPs) potentially associated with P. vivax drug resistance, in pvdhfr, pvdhps andpvmdr1 genes (total of 23 allelic variants). This post-PCR multiplex assay uses ligase detection reaction and fluorescent-microsphere technologies. A similar approach was previously developed to screen for Plasmodium falciparumdrug resistance-associated SNPs [27]. The assay was validated using sequenced isolates and a subset of samples from Papua New Guinea (PNG), where CQ resistant P. vivaxwas first described in 1989 [12]. Resistance to sulphadoxine-pyrimethamine (SP) was observed to be low until 2000 [28], when PNG introduced CQ or amodiaquine plus SP as the national first line treatment for bothP. falciparumandP. vivax. Since then, levels of resistance to this combination have increased [24,29]. Here the development and application of this multiplex assay is described; the frequency ofP. vivax genetic markers associated with multiple drug resistance in PNG patient isolates is presented.
Methods
Study population and blood sample collection
Samples were collected between 2006 and 2007 through active detection of malaria infections in a cohort of
children 1-4 yrs of age in Ilaita, East Sepik Province, Papua New Guinea [30]. The study was approved by the PNG Medical Research Advisory Council.Plasmodium vivax infected monkey blood (SalI and Thai-3 strains) was kindly provided by W. E. Collins (Centers for Dis-ease Control and Prevention, Atlanta, GA).Plasmodium falciparumpositive samples were obtained from a cul-ture of the 3D7 strain.
DNA template preparation
DNA was extracted from cell pellets (250μL) using the QIAamp 96 DNA blood kit (Qiagen, Valencia, CA). Genomic DNA was extracted from P. vivax-infected monkey blood or from P. falciparumculture using the QIAamp DNA blood minikit (Qiagen, Valencia, CA).
Plasmodiumspecies diagnosis
Plasmodium species diagnosis was performed using a post-PCR ligase detection reaction - fluorescent micro-sphere assay (LDR-FMA) as described previously [30,31]. Positive samples for P. vivax infections were identified and then assessed for mutations in pvdhfr, pvdhpsandpvmdr1genes.
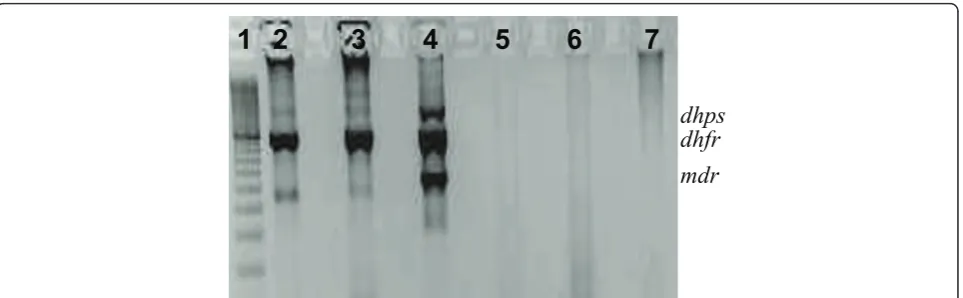
Multiplex PCR amplification ofP. vivax dhfr,dhpsand mdr1target sequences
A nested PCR was developed to perform multiplex amplification of P. vivax dhfr, dhps andmdr1 target sequences. All Nest 1 reactions were performed in a buffer containing 3 pmol of each primer, 67 mM Tris-HCl (pH = 8.8), 3.3 mM MgSO4, 16.6 mM (NH4)2SO4, 10 mM mercaptoethanol, 100μM (each) dATP, dGTP, dCTP, dTTP, and 2.5 U of thermostable DNA polymer-ase. Nest 2 reactions were performed with 3 μL of PCR products from the Nest 1 reaction using the same con-ditions except for the primers (6 pmol). Primer sequences and size of PCR products are given in Table A1 (Additional file 1). PCR amplification was performed under the following conditions: Nest 1 - 94°C for 2 min-utes and 35 cycles at 94°C for 30 seconds, 60°C for 30 seconds, 72°C for 3 minutes, and a final extension at 72° C for 5 minutes; Nest 2 - 94°C for 2 minutes and 45 cycles at 94°C for 30 seconds, 63°C for 30 seconds, 72°C for 90 seconds, and a final extension at 72°C for 4 min-utes. The specificity of the amplification was evaluated following electrophoresis on a 2% agarose gel in 1× TBE buffer (8.9 mM Tris, 8.9 mM boric acid, 2.0 mM EDTA).
Ligase detection reaction - fluorescence microspheres assay (LDR-FMA)
pvmdr1target sequences, products were subjected to a ligase detection reaction between modified upstream allele-specific and downstream conserved sequence pri-mers. Modifications included the addition of unique TAG sequences at the 5’ extremity of the upstream sequence-specific primers and 5’phosphorylation/3’ bio-tinylation of the downstream primers. In a second step, hybridization occurred between TAG and anti-TAG oli-gonucleotide probes bound to fluorescent microspheres. The products of this reaction were then incubated in a solution containing streptavidin-phycoerythrin (SA-PE) to allow binding to the 3’ biotin of the conserved sequence primer.
One μL of multiplex PCR product was subjected to the ligation reaction, performed in a solution (15μL) containing 20 mM Tris-HCl buffer (pH 7.6), 25 mM potassium acetate, 10 mM magnesium acetate, 1 mM NAD+, 10 mM dithiothreitol, 0.1% Triton X-100, 10 nM (200 fmol) each LDR probe, 1 μl of each PCR product, and 2 U of TaqDNA ligase (New England Biolabs, Bev-erly, MA). Reaction mixtures were initially heated to 95° C for 1 min, followed by 32 thermal cycles at 95°C for 15 s (denaturation) and 60.0°C for 2 min (annealing/ ligation). The multiplex LDR product (5μl) was then added to 60μl of hybridization solution (3 M tetra-methylammonium chloride [TMAC], 50 mM Tris-HCl [pH 8.0], 3 mM EDTA [pH 8.0], 0.10% sodium dodecyl sulfate) containing 250 Luminex FlexMAP™ micro-spheres for each allelic set. Mixtures were heated to 95° C for 90 s and incubated at 37°C for 40 min to allow hybridization between SNP-specific LDR products and microsphere-labelled anti-TAG probes. Following hybri-dization, 6μl of streptavidin-R-phycoerythrin (Molecular Probes, Eugene, OR) in TMAC hybridization solution (20 ng/μl) was added to the post-LDR mixture and incu-bated at 37°C for 40 min in Costar 6511 M polycarbo-nate 96-well V-bottom plates (Corning Inc., Corning, NY). Detection of SNP-specific products (Classification signal = microspheres fluorescence/Reporter signal = SA-PE) was performed through a BioPlex liquid array reader (Bio-Rad laboratories, Hercules, CA). All fluores-cence data were compiled into Microsoft Excel spread-sheets using Bio-Rad (Hercules, CA) software, Bio-Plex Manager 4.1.
Sequences of LDR primers are given in Table A2 (Additional file 2). These primers were designed to allow the detection of mutations at five pvdhfrcodons (57-58-61, 117, 173), fourpvdhpscodons (382-383, 553, 647) and one pvmdr1 codon (976), with a total of 23 SNPs detected. LDR primers were designed according to available sequences published in the literature and sequences obtained from PNG isolates. To improve the specificity of the assay, a mismatch (G®A) was intro-duced in the sequence of the primers (at nucleotide 178,
accession no. X98123.1) hybridizing against codons 57-58-61 of pvdhfr gene. This allowed a decrease of the allele-specific background observed.
Obtaining controls and sequencing
Pvdhfr, pvdhps and pvmdr1 genes were amplified by nested PCR from a subset of samples (n = 6); individual species-specific gene fragments were sequenced after purification using the QIAquick PCR purification kit (Qiagen, Valencia, CA). Additionally, six isolates (geno-types known) kindly provided by D. Ménard (Pasteur Institute, Madagascar) and C. Sibley (University of Washington, Seattle, WA) were amplified for pvdhfr gene; PCR products were cloned to obtain positive con-trols for a selection of mutant pvdhfr genotypes: 57I (ata), 58R (agg, aga, cgt), 117N/117T (aac/acc), 173L (ctt). Three isolates were cloned in order to obtain pvdhps wild type, single mutant 383G and double mutant 382C-383G genotype controls, and two isolates to obtain pvmdr1 Y976 and 976F. Cloning was per-formed using a TOPO-TA vector cloning system, and Top10F competent cells (Invitrogen), according to the manufacturer’s instructions; DNA was extracted using the QIAprep Spin Miniprep kit (Qiagen, Valencia, CA). Sequencing reactions were performed by single-pass bidirectional plasmid sequencing (Agencourt Bios-ciences, Beverly, MA).
Results
Plasmodium vivax infections were observed in 366 (52%) of 704 samples evaluated byPlasmodiumspecies diagnosis with a post-PCR LDR-FMA [31]; 113 samples (30.9%) were co-infected with P. falciparum. A LDR-FMA multiplex marker analysis was developed to detect SNPs in pvdhfr, pvdhps and pvmdr1 genes related to anti-malarial drug resistance and used to genotype these 366P. vivaxsamples.
Validation of the nested multiplex PCR approach for a simultaneous amplification ofpvdhfr,pvdhpsandpvmdr1 genes
vivax by the species-specific diagnostic assay. From these samples, 37 (95%) produced PCR products of the expected sizes for the three gene-specific target sequences using both single and multiplex PCR strategies.
Validation ofpvdhfr,pvdhpsandpvmdr1LDR-FMA probe specificity
Sequenced isolates or clones were used to check the specificity of LDR product formation and fluorescent signals detected (Table A3, Additional file 3). At the time of this study, a control template for the pvdhps 553G and 647P mutant alleles was not available.
Eight distinct pvdhfr haplotypes were discriminated across codons 57, 58 and 61. Because of the proximity of the three codons, haplotype-specific primers cover-ing the three codons and displaycover-ing the different allele combinations were designed. Results show that haplo-type-specific background ranged from 168 to 3929 fluorescence units (FU); positive haplotype-specific sig-nals ranged from 6968 to 25348 FU. Independently, three alleles were discriminated at codon 117, with allele-specific background ranging from 374 to 2740 FU, and positive allele-specific signals from 14942 to 24245 FU. Two alleles were discriminated at codon 173, with allele-specific background ranging from 566 to 8083 FU, and positive allele-specific signals from 19770 to 24564 FU.
Fourpvdhps haplotypes were discriminated at codons 382 and 383 (using haplotype-specific primers). Results show that allele-specific background ranged from 202 to 1798 FU; positive allele-specific signals ranged from 4925 to 21682 FU. Two pvmdr1alleles were discrimi-nated at codon 976. Results show that allele-specific background ranged from 811 to 974 FU; positive allele-specific signals ranged from 15634 to 19634 FU.
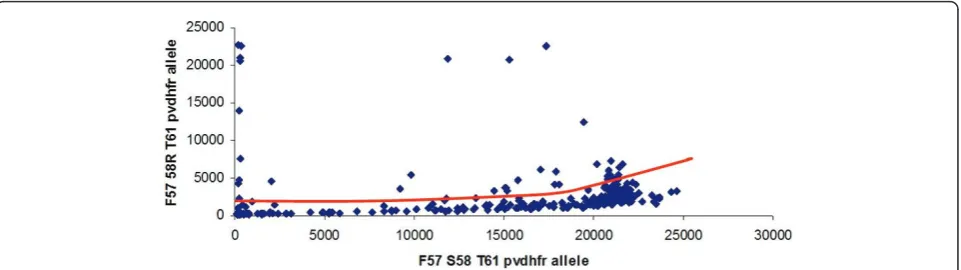
Similar to what was described elsewhere [32], at some loci, an increase of the allele-specific background was observed proportionally to the intensity of another allele-specific signal (Figure 2). This effect was observed on pvdhfr57-58-61 FR(agg)T and pvdhfr57-58-61 FR (aga)T allele-specific backgrounds (whenpvdhfr 57-58-61 FST allele-specific signal was high), onpvdhfr 57-58-61 LR(agg)T allele-specific background (when pvdhfr 57-58-61 LR(aga)T allele-specific signal was high) and onpvdhfr57-58-61 LR(agg)M allele-specific background (when pvdhfr57-58-61 LR(aga)M allele-specific signal was high). A similar effect was observed onpvdhfr 173L allele-specific background (whenpvdhfrI173 allele-spe-cific signal was high). A more moderate effect was observed on pvdhps A647 allele-specific background (when pvdhps 647P allele-specific signal was high). Interpretation of the fluorescent signals using the polar/ multi-dimensional transformation of the data was thus performed.
Computer-assisted multidimensional data analysis
The coexistence of multiple distinct haplotypes in the parasite population necessitated the introduction of a novel approach to the analysis of LDR-FMA datasets from PNG.
Fluorescence signals from bi-allelic datasets were ana-lysed using a polar transformation of the data in order to improve the data analysis of Plasmodium polyclonal infections, as previously described [32]. In the presence of one allele, an increase of the reciprocal allelic SNP signal can be observed, making direct determination of a constant threshold for positivity (presence of the sec-ond allele) inappropriate. Briefly, bivariate data were transformed from Cartesian coordinates (x-axis = allele X fluorescence signal; y-axis = allele Y fluorescence sig-nal) into polar (r,θ) coordinates (here r=x2+y2 and
1 2
3 7
4
5
6
[image:4.595.59.541.88.237.2]dhps
dhfr
mdr
θ= arctan(y/x)) to account for the approximately linear crosstalk interaction inducing the background signal. The magnitude of the combined signal,r, represents the dis-tance in the plane between a point (x,y) and the origin of the graph. The angle,θ, between the x-axis and a ray extending from the origin to the point (x,y) represents the relative strength of the yversusthe X signal. Samples withθ≈0 correspond to pure infections of type X, sam-ples withθ≈90° correspond to pure infections of type Y, and intermediate values ofθrepresenting samples with polyclonal infections. Subsequently, the threshold analy-sis included two steps. The first step determined a threshold for positivity for infections. The set of samples was divided into bins, from rminto rmax, each having a width of 100 fluorescence units (FU). The threshold of positivity was determined as the value of r corresponding to the bin containing the first minimum (in number of counts) after the first maximum closest to r = 0. In addi-tion, we require that the number of samples in the bin be less than the number that would be expected under the uniform distribution (for a full technical description of the algorithm used for bi-allelic data please see [32]). The second step of the threshold analysis discriminated between polyclonal infections and allele-specific back-ground signal. The set of samples was divided into 45 bins ranging fromθ = 0 toθ=π/2 radians (90°). The threshold for the X+/Y- population was set at the first minimum in the histogram asθincreased past the local maximum close toθ= 0 (0°, or horizontal). The thresh-old for the X-/Y+ population was set at the first mini-mum in the histogram as θ decreased past the local maximum close toθ=π/2 (90°, or vertical). Upon estab-lishing the thresholds for distinguishing monoclonal ver-sus polyclonal infections in the polar coordinate plane, an inverse polar coordinate transformation returned the data and the diagnosis threshold to the Cartesian plane.
Diagnosis of multi-allelic datasets (number of alleles > 2) was accomplished through a computer-assisted
procedure analogous to the polar transformation intro-duced in DaRe et al[32]. Each sample was represented as a vector xi=
xi1,. . .,xij,. . .,xin
where the first index (i), 1≤i≤N, represented the sample number (out of N samples) and the index (j), 1≤j≤n represented the allele (out of n alleles). For example, the data set for pvdhfrlocus 117 comprised n = 3 alleles and N = 366 samples; the data set forpvdhpsloci 382-383 comprised n = 4 alleles and N = 366 samples; the data set for pvdhfrloci 57, 58 and 61 comprisedn = 8alleles andN = 366samples. The total magnitude of the fluorescence signal for sampleiwas taken to be the Euclidean length
of the vector, Li=
n j=1
x2
ij. A histogram was constructed
of theN values ofLi, using bins of width 100
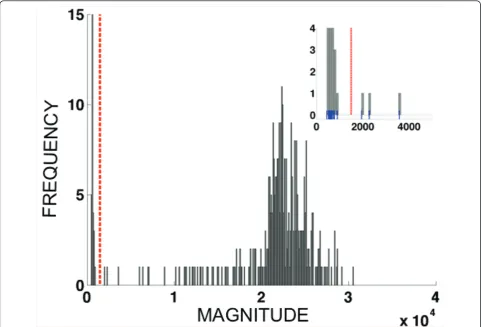
fluores-cence units, and the first minimum of the histogram occurring after the first maximum was used as a diag-nostic cut-off for distinguishing infected versus unin-fected samples. Figure 3 shows the histogram of fluorescence vector magnitudes for data frompvdhfr 57-58-61, along with the threshold obtained. For each sam-ple with vector magnitude exceeding the diagnostic magnitude threshold, the quantities aij=xij/Li were
cal-culated. These values, known asdirection cosines, equal the cosine of the angleθij between theithvector xi and
the jth coordinate axis in n-dimensional space. When the ithsample is infected by parasites carrying at least one allele, butnot infected by parasites carrying thejth allele, the angle θij is close to 90 degrees because the vector lies close to an (n-1)-dimensional subspace of the n-dimensional space spanned by the (n-1)other vector components. Consequently, the vector component xijis
significantly smaller than those representing the alleles carried by infecting parasites, and the direction cosine
[image:5.595.59.540.89.224.2]aij = cos(θij) will be close to zero. In order to assist the practitioner in calling alleles, our data analysis code (written in MATLAB) produces a histogram of all
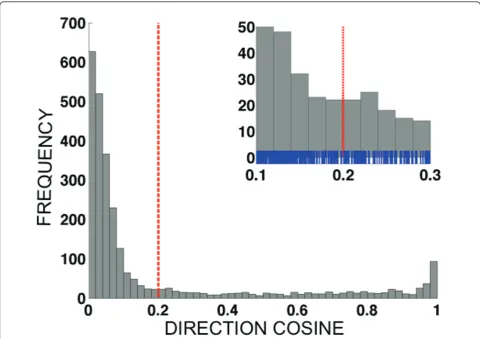
n×Ninf values of the direction cosines for a given data set. Figure 4 shows the histogram of direction cosines produced for thepvdhfr57-58-61 data set (n×Ninf= 8 × 338 = 2704 values).
Once the analysis code produced a histogram, we inspected the histogram visually to identify appropriate diagnostic cut-off values for the direction cosines. Appropriate cut-offs were determined to be 0.20 for pvdhfr 57-58-61, 0.16 forpvdhps382-383, and 0.24 for pvdhfr117, see Figure 4, Additional files 4 and 5 (Figure S2 and S4), respectively. Heuristically, the direction cosine threshold was determined by identifying the max-imum of the direction cosine histogram closest to aij= 0, and athresh, the location of the first minimum of the histogram below that maximum, as determined by eye, was used as the cut-off. Allele jin sample iwas scored aspositiveif aij>athresh, and as negativeif aij≤athresh. Appropriate direction cosine thresholds for these data sets ranged over 0.16≤a≤0.24, corresponding to angles of approximately 75°-80°. Please see Figures S1-S4
(Additional files 4 and 5) for additional examples of the magnitude and direction cosine histograms for multi-allelic data sets.
Application of the LDR-FMA to PNGP. vivaxsamples
All three genes were successfully amplified and geno-typed for 305 (83.3%) of the isolates. A positive result for at least one gene associated with drug resistance (pvdhfr, pvdhpsorpvmdr1) was obtained for 349 (95.4%) of the isolates in the first run. Of the isolates not successfully genotyped 90% showed lower positivity with the Plasmo-diumspecies diagnostic assay (500 to 10 000 FU).
[image:6.595.57.540.89.416.2]Based on pvdhfr, pvdhps and pvmdr1 genotyping, a monoclonal infection was found in only 70/305 (23.0%) samples. The multiplicity of infection (MOI) was deter-mined based on the maximum number of alleles detected at onepvdhfr, pvdhpsorpvmdr1locus for each isolate and estimated at 2.05 with pvdhfr displaying more allelic combinations (MOI = 1.99) than pvdhps (MOI = 1.03) andpvmdr1(MOI = 1.29).
Figure 3Histogram showing the distribution of fluorescence vector lengths{Li:1≤i≤N} for a multi-allelic data set (pvdhfr57-58-61, eight alleles). The dashed vertical line indicates the diagnosis threshold for infectionvs. noninfection. Magnitude threshold = 1500;Ninf=338.
Considering only the monoclonal infections (n = 70), 37 isolates (52.9%) displayed a wild-type pvdhfr allele (F57-S58-T61-S117-I173). The quadruple mutant geno-type (57L-58R-61M-117T-I173) was found in 21 isolates (30.0%); single (n = 2; 2.9%), and double (n = 10; 14.3%) mutant genotypes were also observed (Table 1). All but one of these samples displayed a single mutant type pvdhps 647P allele, and 12 of them (17.1%) thepvmdr1 976F mutation.
When considering all infections (Table 2), the preva-lence of multiple mutant SNP pvdhfralleles was high. Of 305 infected patients, 223 (73.1%) carried parasites with a wild-type genotype at codons 57, 58 and 61, whereas 200 (65.6%) displayed at least a triple mutant genotype, most likely associated with the 117T muta-tion, as this mutation was found in the isolates infecting 206 (67.5%) patients. Only one patient carried parasites
with the 173L mutation. Interestingly, 303 parasite iso-lates (99.3%) carried the mutant pvdhps 647P allele, approaching genetic fixation. In contrast, mutant allelic SNPs in codons 382 or 383 were found in the isolates infecting two to three (0.7 to 1%) patients. The mutant allele associated with P. vivax chloroquino-resistance, pvmdr1 976F, was observed in 107 (35.1%) patient isolates.
Discussion
[image:7.595.57.538.88.427.2]Here is described a new high-throughput method to detect SNPs associated with drug resistance ofP. vivax, simultaneously inpvdhfr,pvdhps andpvmdr1 genes. To improve the efficiency of this assay, a nested PCR approach was chosen which allowed a successful geno-typing in 83.3% of the LDR-FMA P. vivax positive samples.
Figure 4Histograms showing the distribution of allNinf×ndirection cosine values. {aij:1≤i≤Ninf,1≤j≤n} for different multi-allelic data
sets. Only samples judged to be infected based on the magnitude histogram (see Figure 1) are included; the number of infected samples is denotedNinf, and the number of alleles for a given data set is denotedn. The dashed vertical line indicates the diagnosis threshold for infection
The main challenge faced in developing this multi-plexed assay was the interpretation of fluorescence data, due to the simultaneous screening of multiple alleles at one locus and the high level of polyclonality (up to four isolates infecting a single patient). As described pre-viously [32], an increase of background (or off-target) fluorescent signal was consistently observed when PCR amplification produced strong gene-specific fragments. A polar transformation of the fluorescent data measured was performed for bi-allelic datasets; the usefulness of this transformation has been shown before [32]. In con-trast, datasets with more than two alleles present required a multidimensional transformation of the data, based on the same principle as the polar transformation. This analysis was applied to three sets of multi-allelic data (n>2): pvdhfr codons 57-58-61, pvdhfr 117, and pvdhps382-383.
As in the case of bi-allelic data sets, while the coordi-nate transformation/histogram segmentation approach better accounted for advancing background due to off-target hybridization, it is not a bulletproof algorithm that guarantees 100% accurate diagnosis. Indeed, given the intrinsic variability of any biological measurement process it is unlikely such a perfect algorithm exists. A significant limitation of the heuristic algorithm described here, at least from a theoretical point of view, is that independent determination of the diagnostic thresholds for each locus can lead to a situation in which a given sample is judged to be positively infected at some but not all loci, which is an inconsistent result. For example, the field data analysed here comprised 366 samples, each of which showed a positive diagnosis forP. vivax
by LDR-FMA [31]. Of these samples, 17, or 5%, were judged not to have enough net fluorescence signal to be considered positively infected based on the overall mag-nitude of the fluorescence vector for all seven loci inter-rogated. Of the 349 samples that showed a positive overall infection based on the magnitude histogram ana-lysis, another 12.6% (44 samples) failed to have a posi-tive single-allele diagnosis for any allele at one of the loci, leading to an incomplete haplotype determination. As a practical matter, in these cases the algorithm described under Methods was supplemented by censor-ing the samples with an incomplete haplotype determination.
[image:8.595.67.540.101.335.2]A total of 23 alleles were screened simultaneously in the assay, with the possibility of extending the assay towards screening more alleles as 100 microspheres can be detected in the same multiplexed assay on the Bio-Plex liquid array reader. This high multiplexing capacity significantly reduces costs associated with diagnosing complex arrays of SNPs associated with anti-malarial drug resistance. While it would cost approximately 3 USD to genotype one sample using a real-time PCR assay screening for only four alleles (TaqMan), the costs of the PCR-LDR-FMA are similar to screen one sample for more than 20 alleles. In addition, as multiple loci of a gene are screened simultaneously, it is possible to identify new genotypes. If a positive signal is observed at one locus of the gene, but a negative signal at another, this would demonstrate the positivity of the PCR, and at the same time, the presence of a new allele not targeted by any of the LDR primers present in the reaction. In this case, it would then be necessary to sequence the
Table 1Pvdhfr, pvdhps, pvmdr1genotypes prevalence inP. vivaxmonoclonal infections
Number ofP. vivaxmonoinfected samples (%)
dhfrgenotype (codons 57/58/61-117-173) wild type:
FST-S-I 37 (52.9)
double mutant type:
FRT-N-I 2 (2.9)
LRT-S-I 10 (14.3)
quadruple mutant type:
LRM-T-I 21 (30.0)
dhpsgenotype (codons 382/383-553-647) wild type:
SC-A-A 1 (1.4)
single mutant type:
SC-A-P 69 (98.6)
mdr1genotype (codon 976) wild type:
Y 58 (82.9)
mutant type:
PCR product in order to confirm the existence of a new genotype. Modifications to the LDR-FMA are then easily achieved by designing new sequence-specific primers.
Due to the wide use of sulphadoxine-pyrimethamine (SP) to treat falciparum malaria, P. vivax has been exposed worldwide to this anti-malarial drug. In Papua New Guinea, SP has been added to 4-aminoquinolines (CQ and amodiaquine) to treat P. falciparumand P. vivax malaria since 2000. It is therefore not surprising thatpvdhfr andpvdhps mutant alleles [23,33-36] were highly prevalent, with 65.6% of infected patients display-ing a triple mutant dhfr genotype (57L-58R-61M). Because of a high rate of polyclonal infections (83.3%) and a mean MOI of 1.99 calculated frompvdhfr geno-typing results, it is difficult to reconstruct haplotypes and give more than an estimation of their prevalence. As shown by the results obtained from monoclonal
infections, the 117T mutation was associated with the triple mutant haplotype 57L-58R-61M in 100% of the cases. It is therefore possible to predict an overall rate of infection (among monoclonal and polyclonal infected patients) with a quadruple mutant dhfr haplotype to occur in about 66% of the cases.
In vitro results (using a yeast model to express PvDHFR) have shown a strong correlation between mutations in pvdhfrand the amount of drug needed to inhibit the growth in this system. The 50% inhibitory concentration (IC50) of pyrimethamine is increased by 100-460 fold for a dhfrdouble mutant 58R-117N, and more than 500-fold for a quadruple mutant enzyme 57L-58R-61M-117T in comparison to the IC50 mea-sured for the wild-type enzyme [28,34]. Furthermore, the quadruple mutant haplotype has been associated within vivo treatment failure after treatment with arte-sunate-SP in a study conducted in Papua, Indonesia [37]. Similarly, the quadruple mutant haplotype has been associated with SP treatment failure when com-pared to lower mutant parasites (triple mutant to wild type) [38]. Thepvmdr1Y976F mutation (when found in combination withpvdhfrmutations) was associated with treatment failure in a PNG study conducted in 2004-2005 whenP. vivax infected patients were treated with AQ+SP [39].
[image:9.595.57.292.111.512.2]Very few reports have been available on the preva-lence of P. vivax dhfr and dhps mutations in PNG. From 19 isolates collected in 1998 in the Wosera (East Sepik Province) [28], only one (5.3%) displayed a double 57L-58Rpvdhfrmutation. In the same study, of 25 iso-lates collected in 2000 in Liksul (Madang Province), nine displayed apvdhfrmutant genotype (six were dou-ble mutant 57L-58R). More recently, genotyping results for 94 samples collected in three areas from PNG (Simbu, East Sepik and Madang provinces) between 2004 and 2005 showed higher prevalence of mutant genotypes and the appearance of quadruple mutant parasites (pvdhfr57L-58R-61M-117T) in the population [24]. This increase is confirmed here with significantly higher rates of patients infected with mutant genotypes: 57L was found in 78.4% of the participants, 58R in 83.0%, 61M in 65.9%, 117N/T in 70.8%, versus, respec-tively, 59.6%, 67.0%, 20.2% and 40.4% from the earlier study (p < 0.001). Data from PNG isolates on pvdhps have not been generated; only one isolate from PNG was previously sequenced, showing a mutation at codon 647 (647P) [40]. As forpvmdr1, the 976F mutation was found at a prevalence of 39.4% [24] and remains at the same level here (35.1%) despite known high level of CQ-SP drug resistance in PNG (51.4% after PCR correction [41]). It has already been discussed that 4-aminoquino-line resistance may result from a multigenic process involving different SNPs and/or gene amplification,
Table 2Pvdhfr, pvdhps, pvmdr1genotypes identified in
305P. vivaxinfected patients
Number of infected patients (%)
dhfrgenotype 57-58-61
FST 223 (73.1)
FRT 28 (9.2)
LRT 116 (38.0)
LRM 200 (65.6)
117
S 260 (85.2)
N 12 (3.9)
T 206 (67.5)
173
I 304 (99.7)
L 1 (0.3)
dhpsgenotype 382-383
SC 305 (100)
SG 2 (0.7)
CC 2 (0.7)
CG 3 (1.0)
553
A 305 (100)
647
A 5 (1.6)
P 303 (99.3)
mdr1genotype 976
Y 287 (94.1)
variation in the level of expression [24,25]; it is therefore harder to correlate the 976F mutation frequency with an increase of thein vivolevel of drug resistance.
Conclusions
While Papua New Guinea and other malaria-endemic countries are changing their national malaria treatment policies, and implementing new treatment strategies, it will be important to assess the impact of such strategies on the evolution ofP. vivaxpopulations. The new high-throughput method described here represents a valuable tool that can be used for local or large-scale screening ofP. vivaxmolecular markers of drug resistance.
Additional material
Additional file 1: Table A1: Sequences of PCR primers.
Additional file 2: Table A2: Sequences of LDR primers forP. vivax dhfr, dhpsandmdr1genes.
Additional file 3: Table A3: Fluorescence signals obtained forP. vivaxsamples (clones or sequenced isolates) of knowndhfr, dhps
andmdr1genotypes.
Additional file 4: Figures_S1S2.Figure S1:Magnitude histogram for
dhps382-383(four alleles); magnitude threshold = 1500;Ninf=337.
Histogram bin width = 100 fluorescence units.Figure S2:Direction cosine histogram fordhps382-383(four alleles, 337 × 4 = 1348 direction cosines total); direction cosine threshold = 0.16. Histogram bin width = 0.02. Figures S1-S2 show the magnitude and direction cosine histograms, respectively, for the multi-allelic data setdhps382-383, which exhibited four positive alleles within the population. Inset panels show magnification of the region near the diagnostic threshold, including small vertical blue tick marks indicating the magnitudes of individual samples (S1) or values of direction cosines (S2). Compare Figures 1 and 2 of the main text.
Additional file 5: Figures_S3S4.Figure S3: Magnitude histogram for dhfr117 (three alleles); magnitude threshold = 1000;Ninf=339. Histogram
bin width = 100 fluorescence units.Figure S4: Direction cosine histogram fordhfr117 (three alleles, 339 × 3 = 1017 direction cosines total); direction cosine threshold = 0.24. Histogram bin width = 0.02. Figures S3-S4 show the magnitude and direction cosine histograms, respectively, for multi-allelic data setdhfr117, which exhibited three positive alleles within the population. Compare Figures 1 and 2 of the main text.
Acknowledgements and funding
We would like to thank Enmoore Lin, Benson Kiniboro, and all the field team members who helped collect the samples used in this analysis and Dr Richard Gray for his assistance in data analysis. We thank all the study participants. FINANCIAL SUPPORT: This study was supported by grants from the National Science Foundation (NSF-0720142, DUE-0634612, DMS-1010434 and EF-1038677), the Fogarty International Center (TW007872 and TW007377), the Bill & Melinda Gates Foundation, NHMRC (#1010203), and Fondation Merieux.
Author details
1Vector Borne Diseases Unit, Papua New Guinea Institute of Medical
Research (PNGIMR), Goroka, Papua New Guinea.2Infection and Immunity
Unit, Walter & Eliza Hall Institute of Medical Research, Parkville, Australia.
3Department of Mathematics, Case Western Reserve University, Cleveland,
USA.4Center for Global Health and Diseases, Case Western Reserve
University, Cleveland, USA.5Centre de Recerca en Salut Internacional de Barcelona (CRESIB), Barcelona, Spain.
Authors’contributions
CB designed the assay, was responsible of laboratory work, and contributed to data analysis, and contributed to writing the paper. PJT and DK conceived the multi-allelic data analysis method, DK implemented it, and PJT and DK wrote the methods section on computer-assisted data analysis, and contributed to editing the manuscript. The results of the analysis were independently verified by CB and DK. LT and JI participated in the laboratory work and in editing the manuscript. LG contributed to the design of the assay and editing the manuscript. IM and PS helped with data analysis and writing the paper. PAZ supervised laboratory work and the design of the assay, and contributed to data analysis and writing the paper. All authors read and approved the manuscript.
Competing interests
The authors declare that they have no competing interests.
Received: 20 April 2011 Accepted: 24 September 2011 Published: 24 September 2011
References
1. Guerra CA, Snow RW, Hay SI:Mapping the global extent of malaria in 2005.Trends Parasitol2006,22:353-358.
2. Hay SI, Guerra CA, Tatem AJ, Noor AM, Snow RW:The global distribution and population at risk of malaria: past, present, and future.Lancet Infect Dis2004,4:327-336.
3. Beg MA, Khan R, Baig SM, Gulzar Z, Hussain R, Smego RA Jr:Cerebral involvement in benign tertian malaria.Am J Trop Med Hyg2002,
67:230-232.
4. Genton B, D’Acremont V, Rare L, Baea K, Reeder JC, Alpers MP, Muller I:
Plasmodium vivaxand mixed infections are associated with severe malaria in children: a prospective cohort study from Papua New Guinea.
PLoS Med2008,5:e127.
5. Mueller I, Galinski MR, Baird JK, Carlton JM, Kochar DK, Alonso PL, del Portillo HA:Key gaps in the knowledge ofPlasmodium vivax, a neglected human malaria parasite.Lancet Infect Dis2009,9:555-566.
6. Barcus MJ, Basri H, Picarima H, Manyakori C, Elyazar I, Bangs MJ, Maguire JD, Baird JK:Demographic risk factors for severe and fatal vivax and falciparum malaria among hospital admissions in northeastern Indonesian Papua.Am J Trop Med Hyg2007,77:984-991.
7. Baird JK, Basri H, Bangs MJ, Subianto B, Patchen LC, Hoffman SL:Resistance to chloroquine byPlasmodium vivaxin Irian Jaya, Indonesia.Am J Trop Med Hyg1991,44:547-552.
8. Fryauff DJ, Tuti S, Mardi A, Masbar S, Patipelohi R, Leksana B, Kain KC, Bangs MJ, Richie TL, Baird JK:Chloroquine-resistantPlasmodium vivaxin transmigration settlements of West Kalimantan, Indonesia.Am J Trop Med Hyg1998,59:513-518.
9. Kshirsagar NA, Gogtay NJ, Rajgor D, Dalvi SS, Wakde M:An unusual case of multidrug-resistantPlasmodium vivaxmalaria in Mumbai (Bombay), India.Ann Trop Med Parasitol2000,94:189-190.
10. Myat Phone K, Myint O, Myint L, Thaw Z, Kyin Hla A, Nwe Nwe Y:
Emergence of chloroquine-resistant Plasmodium vivax in Myanmar (Burma).Trans R Soc Trop Med Hyg1993,87(6):687.
11. Phillips EJ, Keystone JS, Kain KC:Failure of combined chloroquine and high-dose primaquine therapy forPlasmodium vivaxmalaria acquired in Guyana, South America.Clin Infect Dis1996,23:1171-1173.
12. Rieckmann KH, Davis DR, Hutton DC:Plasmodium vivaxresistance to chloroquine?Lancet1989,2:1183-1184.
13. Ruebush TK, Zegarra J, Cairo J, Andersen EM, Green M, Pillai DR, Marquino W, Huilca M, Arevalo E, Garcia C, Solary L, Kain KC: Chloroquine-resistantPlasmodium vivaxmalaria in Peru.Am J Trop Med Hyg2003,
69:548-552.
14. Villalobos-Salcedo JM, Tada MS, Kimura E, Menezes MJ, Pereira da Silva LH:
In-vivo sensitivity ofPlasmodium vivaxisolates from Rondonia (western Amazon region, Brazil) to regimens including chloroquine and primaquine.Ann Trop Med Parasitol2000,94:749-758.
15. Alecrim MdG, Alecrim W, Macedo V:Plasmodium vivaxresistance to chloroquine (R2) and mefloquine (R3) in Brazilian Amazon region.Rev Soc Bras Med Trop1999,32:67-68.
16. Baird JK:Resistance to therapies for infection byPlasmodium vivax.
17. Koepfli C, Mueller I, Marfurt J, Goroti M, Sie A, Oa O, Genton B, Beck HP, Felger I:Evaluation ofPlasmodium vivaxgenotyping markers for molecular monitoring in clinical trials.J Infect Dis2009,199:1074-1080. 18. Chen N, Auliff A, Rieckmann K, Gatton M, Cheng Q:Relapses of
Plasmodium vivaxinfection result from clonal hypnozoites activated at predetermined intervals.J Infect Dis2007,195:934-941.
19. Imwong M, Snounou G, Pukrittayakamee S, Tanomsing N, Kim JR, Nandy A, Guthmann JP, Nosten F, Carlton J, Looareesuwan S, Nair S, Sudimack D, Day NP, Anderson TJ, White NJ:Relapses ofPlasmodium vivaxinfection usually result from activation of heterologous hypnozoites.J Infect Dis 2007,195:927-933.
20. Baird JK:Chloroquine resistance inPlasmodium vivax.Antimicrob Agents Chemother2004,48:4075-4083.
21. Suwanarusk R, Russell B, Chavchich M, Chalfein F, Kenangalem E, Kosaisavee V, Prasetyorini B, Piera KA, Barends M, Brockman A, Lek-Uthai U, Anstey NM, Tjitra E, Nosten F, Cheng Q, Price RN:Chloroquine resistant
Plasmodium vivax: in vitro characterisation and association with molecular polymorphisms.PLoS ONE2007,2:e1089.
22. de Pecoulas PE, Tahar R, Ouatas T, Mazabraud A, Basco LK:Sequence variations in thePlasmodium vivaxdihydrofolate reductase-thymidylate synthase gene and their relationship with pyrimethamine resistance.Mol Biochem Parasitol1998,92:265-273.
23. Imwong M, Pukrittayakamee S, Cheng Q, Moore C, Looareesuwan S, Snounou G, White NJ, Day NP:Limited polymorphism in the dihydropteroate synthetase gene (dhps) ofPlasmodium vivaxisolates from Thailand.Antimicrob Agents Chemother2005,49:4393-4395. 24. Marfurt J dMF, Brega S, Barbollat L, Müller I, Reeder JC, Beck HP, Picot S,
Genton B:Molecular markers of in vivoPlasmodium vivaxresistance to amodiaquine plus sulphadoxine-pyrimethamine: mutations in pvdhfr and pvmdr1.J Infect Dis2008,198:409-417.
25. Barnadas C, Ratsimbasoa A, Tichit M, Bouchier C, Jahevitra M, Picot S, Menard D:Plasmodium vivaxresistance to chloroquine in Madagascar: clinical efficacy and polymorphisms in pvmdr1 and pvcrt-o genes.
Antimicrob Agents Chemother2008,52:4233-4240.
26. Plowe CV, Roper C, Barnwell JW, Happi CT, Joshi HH, Mbacham W, Meshnick SR, Mugittu K, Naidoo I, Price RN, Shafer RW, Sibley CH, Sutherland CJ, Zimmerman PA, Rosenthal PJ:World Antimalarial Resistance Network (WARN) III: molecular markers for drug resistant malaria.Malar J2007,6:121.
27. Carnevale EP, Kouri D, DaRe JT, McNamara DT, Mueller I, Zimmerman PA:A multiplex ligase detection reaction-fluorescent microsphere assay for simultaneous detection of single nucleotide polymorphisms associated withPlasmodium falciparumdrug resistance.J Clin Microbiol2007,
45:752-761.
28. Hastings MD, Maguire JD, Bangs MJ, Zimmerman PA, Reeder JC, Baird JK, Sibley CH:NovelPlasmodium vivaxdhfr alleles from the Indonesian Archipelago and Papua New Guinea: association with pyrimethamine resistance determined by aSaccharomyces cerevisiaeexpression system.
Antimicrob Agents Chemother2005,49:733-740.
29. Karunajeewa HA, Mueller I, Senn M, Lin E, Law I, Gomorrai PS, Oa O, Griffin S, Kotab K, Suano P, Tarongka N, Ura A, Lautu D, Page-Sharp M, Wong R, Salman S, Siba P, Ilett KF, Davis TM:A trial of combination antimalarial therapies in children from Papua New Guinea.NEJM2008,
359:2545-2557.
30. Lin E, Kiniboro B, Gray L, Dobbie S, Robinson L, Laumaea A, Schopflin S, Stanisic D, Betuela I, Blood-Zikursh M, Siba P, Felger I, Schofield L, Zimmerman P, Mueller I:Differential patterns of infection and disease withP. falciparumandP. vivaxin young Papua New Guinean children.
PLoS One2010,5:e9047.
31. McNamara DT, Thomson JM, Kasehagen LJ, Zimmerman PA:Development of a multiplex PCR-ligase detection reaction assay for diagnosis of infection by the four parasite species causing malaria in humans.J Clin Microbiol2004,42:2403-2410.
32. DaRe JT, Kouri DP, Zimmerman PA, Thomas PJ:DifferentiatingPlasmodium falciparumalleles by transforming Cartesian X,Y data to polar coordinates.BMC Genetics2010,11:57.
33. Barnadas C, Tichit M, Bouchier C, Ratsimbasoa A, Randrianasolo L, Raherinjafy R, Jahevitra M, Picot S, Menard D:Plasmodium vivaxdhfr and dhps mutations in isolates from Madagascar and therapeutic response to sulphadoxine-pyrimethamine.Malar J2008,7:35.
34. Hawkins VN, Joshi H, Rungsihirunrat K, Na-Bangchang K, Sibley CH:
Antifolates can have a role in the treatment ofPlasmodium vivax.Trends Parasitol2007,23:213-222.
35. Imwong M, Pukrittayakamee S, Renia L, Letourneur F, Charlieu JP, Leartsakulpanich U, Looareesuwan S, White NJ, Snounou G:Novel point mutations in the dihydrofolate reductase gene ofPlasmodium vivax: evidence for sequential selection by drug pressure.Antimicrob Agents Chemother2003,47:1514-1521.
36. Korsinczky M, Fischer K, Chen N, Baker J, Rieckmann K, Cheng Q:
Sulfadoxine resistance inPlasmodium vivaxis associated with a specific amino acid in dihydropteroate synthase at the putative sulfadoxine-binding site.Antimicrob Agents Chemother2004,48:2214-2222. 37. Tjitra E, Baker J, Suprianto S, Cheng Q, Anstey NM:Therapeutic efficacies
of artesunate-sulfadoxine-pyrimethamine and chloroquine-sulfadoxine-pyrimethamine in vivax malaria pilot studies: relationship toPlasmodium vivaxdhfr mutations.Antimicrob Agents Chemother2002,46:3947-3953. 38. Hastings MD, Porter KM, Maguire JD, Susanti I, Kania W, Bangs MJ,
Sibley CH, Baird JK:Dihydrofolate reductase mutations inPlasmodium vivaxfrom Indonesia and therapeutic response to sulfadoxine plus pyrimethamine.J Infect Dis2004,189:744-750.
39. Marfurt J, Mueller I, Sie A, Maku P, Goroti M, Reeder JC, Beck HP, Genton B:
Low efficacy of amodiaquine or chloroquine plus sulfadoxine-pyrimethamine againstPlasmodium falciparumandP. vivaxmalaria in Papua New Guinea.Am J Trop Med Hyg2007,77:947-954.
40. Menegon M, Majori G, Severini C:Genetic variations of thePlasmodium vivaxdihydropteroate synthase gene.Acta Trop2006,98:196-199. 41. Barnadas C, Koepfli C, Karunajeewa HA, Siba PM, Davis TM, Mueller I:
Characterization of treatment failure inPlasmodium vivaxefficacy trials by genotyping neutral and drug resistance associated markers.
Antimicrob Agents Chemother2011.
doi:10.1186/1475-2875-10-282
Cite this article as:Barnadaset al.:A new high-throughput method for simultaneous detection of drug resistance associated mutations in
Plasmodium vivax dhfr,dhpsandmdr1genes.Malaria Journal2011 10:282.
Submit your next manuscript to BioMed Central and take full advantage of:
• Convenient online submission
• Thorough peer review
• No space constraints or color figure charges
• Immediate publication on acceptance
• Inclusion in PubMed, CAS, Scopus and Google Scholar
• Research which is freely available for redistribution