Open Access
Research
Sub-grouping of
Plasmodium falciparum
3D7
var
genes based on
sequence analysis of coding and non-coding regions
Thomas Lavstsen*
1, Ali Salanti
1, Anja TR Jensen
1, David E Arnot
2and
Thor G Theander
1Address: 1Centre for Medical Parasitology at Institute for Medical Microbiology and Immunology, University of Copenhagen, Denmark and 2Institute for Cell, Animal, and Population Biology, University of Edinburgh, Scotland, United Kingdom
Email: Thomas Lavstsen* - [email protected]; Ali Salanti - [email protected]; Anja TR Jensen - [email protected]; David E Arnot - [email protected]; Thor G Theander - [email protected]
* Corresponding author
Abstract
Background: The variant surface antigen family Plasmodium falciparum erythrocyte membrane protein-1 (PfEMP1) is an important target for protective immunity and is implicated in the pathology of malaria through its ability to adhere to host endothelial receptors. The sequence diversity and organization of the 3D7 PfEMP1 repertoire was investigated on the basis of the complete genome sequence.
Methods: Using two tree-building methods we analysed the coding and non-coding sequences of 3D7 var and rif genes as well as var genes of other parasite strains.
Results: var genes can be sub-grouped into three major groups (group A, B and C) and two intermediate groups B/A and B/C representing transitions between the three major groups. The best defined var group, group A, comprises telomeric genes transcribed towards the telomere encoding PfEMP1s with complex domain structures different from the 4-domain type dominant of groups B and C. Two sequences belonging to the var1 and var2 subfamilies formed independent groups. A rif subgroup transcribed towards the centromere was found neighbouring var genes of group A such that the rif and var 5' regions merged. This organization appeared to be unique for the group A var genes
Conclusion: The grouping of var genes implies that var gene recombination preferentially occurs within var gene groups and it is speculated that the groups reflect a functional diversification evolved to cope with the varying conditions of transmission and host immune response met by the parasite.
Background
Plasmodium falciparum is the most virulent of the four spe-cies causing malaria and responsible for most malarial deaths. The particular virulence of P. falciparum is partly due to the ability of infected erythrocytes to adhere to a variety of host receptors and avoid splenic clearance[1,2].
Unchecked growth and the accumulation of sequestered parasites in vital organs such as the brain[3] or placenta[4] are crucial elements in the pathogenesis of severe malaria[5]. CD36 is considered to be the major endothe-lial receptor for infected erythrocytes[6], but several other ligands have been identified, in particular ICAM-1[7], Published: 10 September 2003
Malaria Journal 2003, 2:27
Received: 18 July 2003 Accepted: 10 September 2003
This article is available from: http://www.malariajournal.com/content/2/1/27
which has been associated with cerebral malaria and chondroitin sulfate A (CSA) associated with binding in the placenta and pregnancy-associated malaria (PAM) [8].
Plasmodium falciparum erythrocyte membrane protein-1 (PfEMP1) is a polymorphic family of high molecular weight adhesion antigens expressed on the surface of infected erythrocytes[9]. The accumulation of antibodies against a broad repertoire of PfEMP1s is probably the functional basis for the natural acquisition of immunity to malaria [10–13].
PfEMP1 antigens are encoded by the var gene family in two exon units[9,14,15]. Exon I codes for the extracellular and variable part of the protein as well as a transmem-brane region and Exon II encodes the intracellular and rel-atively conserved acidic terminal segment (ATS). The most variable part of the protein contains a N-terminal segment followed by segments composed of three domain types; Duffy binding-like domains (DBL-domains): Cysteine-rich inter-domain regions (CIDRs) and C2 [16]. Besides the 59 full-length var genes found in the newly sequenced genome of P. falciparum clone 3D7 [17], the complete domain structures of PfEMP1s are only available in the databases for a handful of var genes from other P. falciparum isolates. The extent to which we can extrapolate from the organisation of 3D7 var genes, to the total diversity of PfEMP1 in the diverse global population of P. falciparum therefore remains somewhat uncertain.
P. falciparum genomes are estimated to contain 50 to 60
var genes. In the case of 3D7 these have been grouped into three major types based on sequence analysis of the intron and 5' and 3' un-translated regions (UTR) [17–19]. In a recent functional study, it was shown that the ability of CIDR domains to bind CD36 could be predicted on the basis of sequence analysis and that binding and non-binding domains fell into two separate CIDR clusters [20]. The rif genes constitute another multigene family which has 149 members in the 3D7 genome. They encode pro-teins (RIFINs) exposed on the surface of infected erythro-cytes [21,22]. The functions of these proteins are not known and they have not been shown to mediate binding.
With the completion of the 3D7 genome[17], it has become possible to study a complete PfEMP1 and RIFIN repertoire of a single genome. We have analysed both cod-ing and non-codcod-ing regions of 3D7 var and rif genes and assigned the var genes into different groups. These groups appear evolutionarily conserved, possibly because selec-tion favours gene segments 'shuffling' within particular groups, but not exchanges between different groups. We speculate that these PfEMP1 groups have arisen as a result of diversifying selection for antigenic divergence being
superimposed on strong selective constraints maintaining a particular ligand-receptor binding interaction.
Methods
Sequences
Nucleotide and deduced amino acid sequences as well as location and transcriptional directions of 3D7 var and rif
genes were obtained from the Plasmodium Genome Resource – http://www.plasmodb.org[23]. RT-PCR, clon-ing and sequencclon-ing of 5' flankclon-ing regions of var2 genes was performed as previously described[24].
Alignments – defining homologous sequence boundaries
Alignments were performed using the ClustalW multiple alignment method, European Molecular Biology Labora-tory, Heidelberg, Germany at default parameters (Gap Open: 10.00; Gap Extention: 0.20, Gap Separation Dis-tance: 4, Protein weight matrix: Gonnet, DNA weight matrix: identity (IUB)). Alignments were corrected by hand using Bioedit[25] to assure homologous sequences for sequence analysis and building. For distance tree-building, the var gene 5' flanking regions were defined as the 600 bp, 1.4 kb or 2.0 kb upstream of the translation initiation codon and the 3' flanking region as the 500 bp downstream of the translation stop codon. The available
var flanking sequences from other strains than 3D7 varied between 250 and 2100 bp in length. For the most part 3' sequences were those retrieved by Mercereau-Puijalon et al [19]. Var gene domain structures were defined using definitions described in Smith et al. [16]. DBLαCIDR1
domains were aligned from Pro-Cys (PC) of DBLα homology block A to the conserved Glu-Trp (EW) motif of CIDR M2 area, resulting in sequence lengths of 550 to 650 aa. The exon II encoded acidic terminal segments (ATS) were aligned over their entire sequences. For analy-sis of DBL relationships sequences covering Pro-X-Arg-Arg (PXRR) of DBL homology block B to Glu-Trp (EW) of homology block H were aligned. RIFINs were aligned over the full-length protein sequences.
Distance tree analysis
Distance trees were constructed the by p-distance/neigh-bour-joining (NJ) method as well as maximum parsi-mony (MP) using MEGA version 2.1[26]. Trees were bootstrapped 1000 times and compared between NJ and MP tree-building methods to assure confidence in topol-ogy. Observed clusters from each tree were confirmed vis-ually on alignments.
Results
Sequence analysis of var 5' regions
sequences of all 3D7 var genes and the pseudo var gene PFE1640w. In agreement with Gardner et al. [17] the alignments revealed three major sequence groups with high similarity between sequences of each group. How-ever, two sequences did not align well with any of the groups and within the groups, subgroups could be identi-fied. Thus, each of the groups were analysed separately.
UpsA
Ten var genes had 5' regions belonging to this group and all but one were positioned head-to-head with a rif gene, the exception PF08_0141 was head-to-head with another
var gene (figure 1). The distance from the start codons of the var to the rif gene was either 3 or 4 kb. From the var
gene translation initiation codon to about 1.2 kb upstream the ten sequences were almost identical up to a stretch of TA repeats, which we propose identifies the 5' end of the upsA. This conclusion is based on analysis of the sequences further upstream from the TA repeats, which probably identifies 5' regions of the neighbouring genes. Thus, six sequences were almost identical until the translation initiation codon of the flanking rif gene. Another group of three sequences also shared this similar-ity but had an insertion of around 1 kb at the proposed upsA end. Characteristic of this group is that the PfEMP1s consist of only two DBL domains. The last sequence flank-ing PF08_0141 constitutes the upstream region of another
var gene.
Sequences with high similarity to the 3D7 upsB and upsC regions have been found in other parasite isolates[18]. Regions with similarity to upsA have yet to be found in other parasites than 3D7. Using a primer set targeting upsA 3D7 sequences around -900 bp from the translation initiation codon, we could PCR amplify products of the expected sizes in 3D7 genomic DNA, as well as in five of five field-isolates tested (data not shown). Although sequence data are not available this data suggests that upsA regions not are unique to 3D7.
UpsB
35 var genes of which 22 genes are telomeric had 5' regions belonging to the upsB group. 33 upsB sequences were highly similar over approximately 650 bp from the
var gene translation initiation site until a polyT15–20 stretch. The upsB region of the telomeric genes was very similar over the entire region between the coding var
sequence and the repetitive elements of the telomere. Eleven sequences were highly similar over varying shorter stretches downstream to the 650 bp. In most of these cases similarity was abruptly lost at polyT15–20 stretches. These upsB regions were defined as upsBsh. In the case of PF08_140 and MAL6P1.316 the upstream region shifts from upsB to upsA and enabling the identification of a minimal observed upsB length of 650 bp. In the case of MAL6P1.316 the flanking upsA related gene is the var
pseudogene MAL6P1.317. The similarity of MAL6P1.316
Schematic representation of head-to-head genomic organisation of rif and upsA flanked var genes
Figure 1
Schematic representation of head-to-head genomic organisation of rif and upsA flanked var genes. Nine genes are flanked by a
rif gene, which has its initiation codon approximately 3 or 4 kb upstream from the var initiation codon, and one var gene by another var gene at -2 kb. Punctured lines represent upsA, dotted lines upsA-rif and full line upsBsh. The diamond marks the putative termination site of upsA characterised by a stretch of TA repeats. Sizes of genes are not in scale.
PFA0015c, MAL6P1.314, PFI1820w PF08_0141
upsA var genes
1 kb
TA repeats
PFD1235w ,MAL7P1.1 ,PF11_0521, PF13_0003, PF11_0008, PFD0020c
upsBsh upsA
var var
upsA upsA-rif
var rif
upsA-rif upsA
and PFL1950w upstream sequences to other upsB sequences were atypically low and fragmented.
UpsC
13 var genes had 5' regions belonging to this group. The 10 closest related sequences of upsC aligned until a stretch of TA repeats around -4 kb from the translation initiation codon. The remaining three upsC sequences showed high upsC sequence similarity through the first 400 bp, but rel-atively low similarity over short stretches upstream. These were marked upsC^ in figure 7.
Ups D
PFE1640w did not group with any of the other 5' sequences and was classified as upsD. PFE1640w is a pseudogene with high similarity to the var1 sub-family of
var genes present in many parasite genomes [27,28]. The 5' region of the var1 sub-family is also conserved across parasite isolates [29]. DBL3γ regions of the var1 family can bind CSA [30] and antibodies against these can prevent CSA mediated parasite binding to brain and lung endothelial cells[31], However other studies have failed to show any up-regulation of this gene after CSA selection[24,32].
Ups E
The 5' region of PFL0030c was unique among the 5' sequences analysed. It was therefore classified as upsE. It has recently been demonstrated that PFL0030c belongs to another family of conserved var genes, the var2 sub-fam-ily[24,32]. var2 is the dominant var gene transcribed in CSA binding parasites and is also transcribed at high levels in parasites isolated from placentas[24,32]. The PFL0030c 5' region was also found upstream of the pseudogene MAL13P1.354, which apart from single frameshift in exonI is almost identical to PFL0030c. Interestingly, unlike any other var gene PFL0030c appears to have an upstream open reading frame (uORF), which encodes a 119 amino acid sequence, which ends 274 bp before the start codon. To examine whether this gene segment was an exon of PFL0030c, a single transcript or a real uORF, RT-PCR was performed with primers targeting sequences on each side of the segment. A product of the expected size was amplified indicating that the uORF and PFL0030c were situated on the same mRNA molecules and that splicing had not occurred during the transcription proc-ess. This conclusion was supported by real time quantita-tive RT-PCR experiments showing that transcription of the segment with the uORF was up-regulated 77 times in NF54 parasites selected for CSA binding compared to the transcription in the parental non selected line. This up reg-ulation corresponded to that observed when using prim-ers targeting other parts of the PFL0030c gene (data not shown). To investigate whether upsE is present in other parasite genomes, the region spanning the uORF
sequence to the transcription initiation site of PFL0030c from five parasites was PCR amplified, cloned and sequenced. All five parasites had both the uORF and the
var2 gene, and a near 100% bp similarity was seen
throughout the sequenced region.
Voss et al.[18] identified a 30 bp degenerated motif com-mon to upsB and upsC sequences at -637 and -1227 from
var translation initiation site in upsB and upsC, respec-tively. A similar but not identical motif was also found in the upsA at 675 to 850. In upsE the motif was found at -1672 from var ATG and -1058 from the uORF ATG. The consensus motif common to upsA, most upsB, upsC and upsE was A(T/G)A (C/A/T)AT AT(T/G) (G/A)TA GAT A(A/ G)T A(A/G/C)(A/G) GAT AGA (A/G)A(A/G). This motif was not found in upsD or the upsBsh of PF08_140, MAL6P1.316 and PF08_103. In another paper, Voss et al.
identifies three conserved var promoter motifs interacting with distinct DNA-binding proteins[33]. Subtelomeric var
gene promoter element 1 and 2 (SPE1 and SPE2) are asso-ciated with upsB sequences and the chromosome-central
var gene promoter element (CPE) with upsC. We identi-fied the SPE1 and SPE2 elements in all upsB but not upsBsh or upsB^ sequences. The CPE was found in all upsC sequences except the three upsC^ sequences with relatively low upsC similarity. None of the elements were found in upsA, upsD or upsE.
Sequence analysis of var 3' regions
Alignments and tree-building (figure 2) of the 500 bp var
3' regions divided most sequences into four clusters (A-D). 13 sequences fell outside these clusters, and the rela-tionship between these sequences could not be confirmed by bootstrapping or comparison the two tree-building methods used.
var gene introns
Calderwood et al. [34]have recently shown that var gene introns can be divided into 3 regions on basis of nucle-otide composition. Selecting a representative subset of var
genes we analysed 30 intron sequences manually and identified the three-region structure in all introns except the three smallest var genes with a two-DBL-domain struc-ture. These have unusual short introns, which appears to mainly consist of region 2. Though alignments showed high similarity between four intron sequences belonging to var genes with a upsA 5' region, it was not possible to group all 3D7 var gene intron sequences on the basis of tree building methods.
Sequence analysis of coding var gene regions
sequences to these domains. In 3D7 all but one var gene encode a DBLlα as the first domain and in all but four genes DBL1 is followed by a CIDR1. Since alignment and tree constructions of DBL1 and CIDR1 domains individu-ally yielded almost identical clusters, we decided to ana-lyse the head structure sequences from the N terminal
region of DBL1 to a conserved motif in the C-terminal region of CIDR1 (figure 3). Fifty-two sequences, including that of pseudogene PFE1640w, could be grouped into five clusters, and four sequences could not be assigned any of these. When all CIDR sequences are aligned most CIDR1s fall into separate clusters of CIDRα or CIDRα1
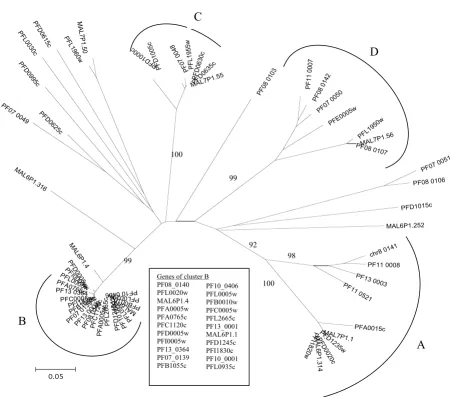
[image:5.612.81.532.91.489.2]Distance tree of 3D7 var gene 500 bp 3' region generated using the p-distance/NJ method
Figure 2
Distance tree of 3D7 var gene 500 bp 3' region generated using the p-distance/NJ method. The four dense clusters A through D were supported by both bootstrapping and maximum parsimony (MP) tree (not shown). The relationship of the remaining sequences could not be verified by the MP tree making method. Numbers at the nodes represent bootstrap proportions (BP) on 1000 replicates. The scale bar represents the proportion of different nucleotide compared. PlasmoDB accession numbers are shown. Genes with assigned cluster are collected in figure 7.
PF10 0406 PFL0020w PFB0010w MAL6P1.1 PFL0935c PF10 0001 PFD1245cPFL2665c PFA0005w PFC1120c
PF08 0140
PF13 0001 PF07 0139
PFB1055c PFI1830c PFC0005w
PF13 0364PFA0765c
PFL0005wPFI0005w
PFD0005w MAL6P1.4
MAL6P1.316 PF07 0049
PFD0625c PFD0995c
PFL0030c PFD0615c
PFL1960w
MAL7P1.50
PFD1000c PFD1005c
PF07 0048 PFL1955w PFD0630c PFD0635c MAL7P1.55
PF08 0103 PF11 0007 PF08 0142
PF07 0050 PFE0005w
PFL1950w
MAL7P1.56 PF08 0107
PF07 0051
PF08 0106
PFD1015c
MAL6P1.252
chr8 0141 PF11 0008 PF13 0003 PF11 0521
PFA0015c MAL7P1.1 PFD1235w
PFD0020c
MAL6P1.314 PFI1820w
0.05
A
B
100 99
99
D
98 92
C
100
domains[20]. The exceptions are three sequences (PF08_0141, PF11_0008, PF13_0003), which fall into a CIDRγ cluster. In figure 3, the head structures of these genes fall into group A. Robinson et al. [20] found that most CIDR domains bind CD36 but identified nine, which did not. These constitute cluster A. In the analysis of DBLα domains three small almost identical PfEMP1s (PFA0015c, MAL6P1.314, PFI1820w) clustered with the DBL1α of group A (data not shown). Thus, we named their DBL1 "A*" (Figure 7). Alignments and tree construc-tion of all var ATS sequences (figure 4) identified four clusters. Though less well defined by bootstrap propor-tions the clusters were supported by both NJ and MP tree
making methods. Four sequences could not be assigned to any of these clusters.
Sequence analysis of DBL domains
Among the var genes of 3D7 PFL0030c (var2) differs markedly with respect to domain structure and 5' region. The gene does not encode a CIDR domain and of the six encoded DBL domains, three have previously been classified as DBLx [17], indicating that they along with ten other DBL domains did not fit into the existing classification by Smith et al. [16]. In attempt to classify these domains we randomly choose 50 DBL domains to represent DBLα-ε and figure 5 shows a tree of these
Distance tree of DBLαCIDR1 domains of 3D7 PfEMP1 and pseudogene PFE1640w generated using the p-distance/NJ method
Figure 3
Distance tree of DBLαCIDR1 domains of 3D7 PfEMP1 and pseudogene PFE1640w generated using the p-distance/NJ method. The clusters A through E were supported by both bootstrapping and maximum parsimony tree (not shown). Numbers at the nodes represent bootstrap proportions (BP) on 1000 replicates. The scale bar represents the proportion of different amino acids compared. PlasmoDB accession numbers are shown. Genes with assigned cluster are collected in figure 7.
PF07 0049 PFD0615c
PF08 0106 PFL1970w
PF10 0001 PFL1960w MAL7P1.50
PFD1000c PFD0995c PF07 0048 PF07 0051 PFI1830c PFD0625c PFD0630c PFD0635c MAL6P1.4 MAL7P1.56 PF11 0007 PF08 0107
PFD1245c PFL0935c
PFB1055c PFL1955w PFD1015c
PF07 0139 PFI0005w
PF13 0364 PFL1950w MAL6P1.1
PFD1005c
PFB0010w PF08 0103
MAL6P1.2 5
PF07 0050 PFA0765c
PFD0005w PFA0005w PFL2665c PFE0005w
PF13 0001 PF10 0406 PFC0005w
PFC1120c
MAL7P1.55 PF08 0142
PFL0005w PFL0020w
MAL6P1.316
PF08 0140 PF08 0141
PF13 0003
PF11 0008
PFE1640w
PFD0020c PFD1235w PF11 0521
0.1
96 99
87
78 50
A
B
C
99
D
together with the DBLx domains. Although the analysis was based on 3D7 sequences only and cannot be consid-ered definitive some patterns emerged. The DBL1x domain was seen as a side branch to DBLα cluster. The
var2 DBL2x and DBL3x domains did not fall into any of the clusters, but was most closely related to the DBLε sequences. Of the ten other DBLx domains, three formed a separate cluster, which in this study were named DBLζ. These DBLζ domains were part of PfEMP1s with identical domain structure. Six DBLx domains fell within or clus-tered closely to DBLδs. Like other DBLδ they were flanked by a CIDR domain, and were classified as DBLδ in figure
7. One DBLx domain clustered with DBLγ sequences and was classified as such in figure 7.
3D7 var and rif gene groups
As described, all but one of the upsA sequences were flanked by a rif gene transcribed in the opposite direction and all of these rif genes appeared to share a 5' region, here named upsA-rif. rif genes exhibit a chromosomal organisation similar to var genes, i.e. a small subset genes including the upsA-rif flanked genes were found to be transcribed in direction opposite to the majority. Thus, the rif genes located near the telomere and transcribed
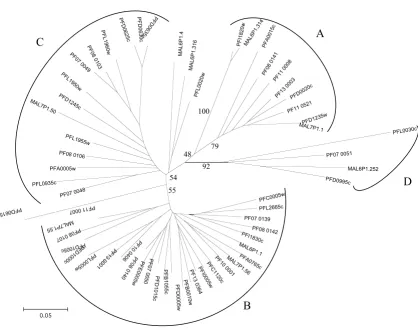
[image:7.612.95.514.105.435.2]Distance tree of ATS domains of 3D7 PfEMP1 generated using the p-distance/NJ method
Figure 4
Distance tree of ATS domains of 3D7 PfEMP1 generated using the p-distance/NJ method. Though A, B and C clusters were vaguely supported by the bootstrapping, they were supported by maximum parsimony tree making. Numbers at the nodes rep-resent bootstrap proportions (BP) on 1000 replicates. The scale bar reprep-resents the proportion of different amino acids com-pared. PlasmoDB accession numbers are shown. Genes with assigned cluster are collected in figure 7.
PFC0005w PFL2665c PF07 0139
PF08 0142 PFI1830c MAL6P1.1
PFA0765c MAL7P1.56 PF10 0001 PFC1120c PFI0005w PF13 0364 PFB0010w PFD0005w PFB1055c PFD1015c PF07 0050 PFE0005w PF08 0140
PF10 0406 PF13 0001 PFL0005w
PFD1000c PFD1005c
PF08 0107 MAL7P1.55
PF11 0007
PFD0615c
PF07 0048 PFL0935c
PFA0005w PF08 0106
PFL1955w MAL7P1.50PFD1245c
PFL1950w PF07 0049
PF08 0103 PFL1960w
PFD0625c PFD0630c PFD0635c
MAL6P1.4
MAL6P1.316
PFL0020w
PFI1820w MAL6P1.314 PFA0015c
PF08 0141 PF11 0008
PF13 0003 PFD0020c
PF11 0521
PFD1235w MAL7P1.1
PFL0030c
PF07 0051
MAL6P1.252 PFD0995c
0.05
55 54
48
A
B
D
C
towards the centromere were organised as one to three successive genes with the most 5' gene flanked by a sequence with high similarity to upsA-rif. Sequence anal-ysis of 3D7 RIFINs revealed that 12 of 16 RIFINs with a upsA-rif grouped into two separate clusters (figure 6). BLAST search of randomly chosen 1.7 kb RIFIN 5' regions showed that other RIFIN clusters shared distinct upstream sequences (not shown).
Grouping of var genes
Figure 7 schematically sums up the findings of all the var
gene sequence analyses. The combination of clusters and chromosomal organization of the var genes indicate that
var genes can be grouped into three major subgroups, var
group A, B and C and two intermediate groups group B/A and group B/C, which appear to represent transitions between these three groups. The two genes previously shown to belong to conserved var families, var1 and var2, fell outside these groups. Group A var genes were most
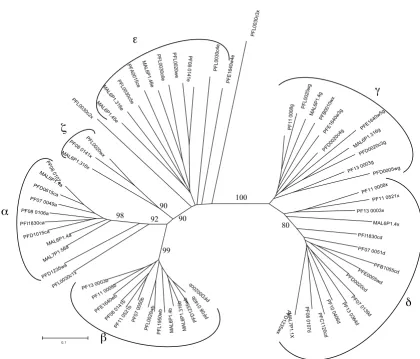
[image:8.612.87.508.96.455.2]Distance tree of all 3D7 DBLx and randomly chosen 50 DBL domains representing all DBL subtypes generated using the p-dis-tance/NJ method
Figure 5
Distance tree of all 3D7 DBLx and randomly chosen 50 DBL domains representing all DBL subtypes generated using the p-dis-tance/NJ method. All clusters were supported by their bootstrap proportions and by maximum parsimony tree making method (data not shown) Numbers at the nodes represent bootstrap proportions (BP) on 1000 replicates. The scale bar represents the proportion of different amino acids compared. PlasmoDB accession numbers are shown.
PFD0020cb
PF08 0140b PFD1235wb
MAL6P1.316b MAL6P1.4b PFL1950wb PFL0020wb PF07 0050b PF11 0521b PF08 0141b PFE1640wb PF11 0008b PF13 0003b PFL0030c1x PFD1235wa
MAL7P1.56a MAL6P1.4a PFD1015ca PFI1830ca
PF08 0106a PF07 0049a
PFD0615ca MAL6P1.1a
PF08 0107a MAL6P1.316x
PF08 0141x PFL0020wx PFL0030c2x
MAL6P1.45e MAL6P1.316e
PFL0030c5e PFA0015ce
MAL6P1.46e
PFL0030c6e PFL0020we PF08 0141e
PFL0030c4e
PFE1640w4e PFL0030c3x
PF11 0008g PFL0020wg
MAL6P1.4g PFB0010wx
PFE1640w3g
PFD0020c4g
PFE1640w5g
MAL6P1.316g
PFD0020c3g
PF13 0003g PFD0005wg
PF11 0008x
PF11 0521x
PF13 0003x
MAL6P1.4x
PFI1830cd
PF07 0051d
PFB1055cd PFE0005wd PFD0020cd
PF07 0139d PF13 0364d PF10 0406d
PFC1120cd PF08 0107d MAL7P1.1X PFD1235wx
0.1
99 92
90 100
80 90
g
d
e
98
a
easily defined, whereas the borders of the proposed group B and C were less clear (figure 7A). The grouping was sup-ported by analyses of both coding and non-coding sequences. However, the best predictors for the groups were the upstream region and chromosomal
organiza-tion. Thus, genes placed near the telomere and with a tran-scriptional direction towards the telomere all had upsA sequences and formed group A. Group B were dominated by telomeric located but centromeric transcribed genes
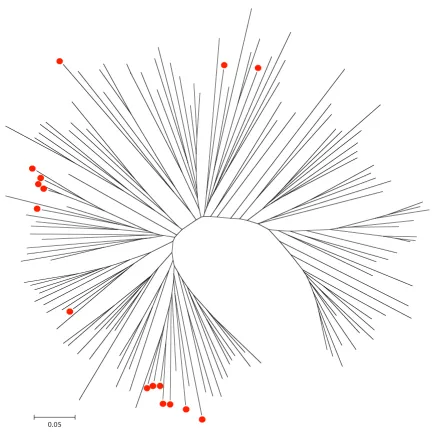
[image:9.612.91.524.85.520.2]Distance tree of 3D7 RIFINs generated using the p-distance/NJ method
Figure 6
Distance tree of 3D7 RIFINs generated using the p-distance/NJ method. MAL6P1.251 was left out as it aligned closer to STE-VORs in preliminary alignments (data not shown). Red dots mark RIFINs flanked by upsA-rif. Though, the tree topology could not be confirmed by bootstrapping, the clusters containing the marked RIFINs were verified by the maximum parsimony tree (not shown). The scale bar represents the proportion of different amino acids compared. No accession numbers are given to simplify the graphics.
A) Schematic presentation of all 3D7 var gene sequence analyses
Figure 7
A) Schematic presentation of all 3D7 var gene sequence analyses. Gene names, chromosomal location, transcriptional direction and domain structure are shown along with the cluster to which each gene was assigned by the sequences analyses. Sequences that could not be assigned to any cluster were named X. Three major var gene groups (group A-C), two intermediate groups group B/A and group B/C and two unique genes representing var1 and var2 var gene families were defined (framed). B) Sequence analyses of var genes from other P. falciparum strains than 3D7. Protein accession numbers, originating strain, domain structure and the closest related 3D7 var 5' sequence are shown along with sequence group allocations as defined in 3D7. *) The genes were assigned to group A, as their DBL1α sequences clustered together with other group A sequences in analysis of DBLα sequences. **) Pseudogene, belongs to the var1 family ^) Upstream sequences with atypically low similarity to upsB or upsC sequences.
Gene Location Orientation (transcribed
towards) 5´ region
DBL1-CIDR1 ATS 3´ region
PFE1640w** Telomeric Telomere upsD A None None DBL1-aCIDR1-aDBL2-b C2 DBL3-gDBL4-e DBL5-gDBL6-bDBL7-e…
PFL0030c Near telomere Telomere upsE None D X DBL1-xDBL2-x DBL3-xDBL4-eDBL5-eDBL6-e
ATS
PFD1235w Near telomere Telomere upsA A A A DBL1-aCIDR1-aDBL2-b C2 DBL3-b C2 DBL4-gDBL4-dCIDR-b ATS
MAL7P1.1 Telomeric Telomere upsA A A A DBL1-aCIDR1-aDBL2-b C2 DBL3-b C2 DBL4-gDBL4-dCIDR-b ATS
PF11_0521 Telomeric Telomere upsA A A A DBL1-aCIDR1-aDBL2-b C2 DBL3-b C2 DBL4-d CIDR-g ATS
PF13_0003 Near telomere Telomere upsA A A A DBL1-a CIDR-g DBL2-b C2 DBL3-gDBL4-dCIDR-bDBL5-b C2 ATS
PF08_0141 Near telomere Telomere upsA A A A DBL1-a CIDR-g DBL2-b C2 DBL3-gDBL4-zDBL5-e ATS
PF11_0008 Near telomere Telomere upsA A A A DBL1-a CIDR-g DBL2-gDBL4-dCIDR-bDBL4-b C2 ATS
PFD0020c Near telomere Telomere upsA A A A DBL1-aCIDR1-aDBL2-b
C2 DBL3-gDBL4-gDBL4-d CIDR-g
ATS
PFA0015c Near telomere Telomere upsA A* A A DBL1-aDBL2-e ATS
MAL6P1.314 Near telomere Telomere upsA A* A A DBL1-aDBL2-e ATS
PFI1820w Near telomere Telomere upsA A* A A DBL1-aDBL2-e ATS
PF08_0140 Near telomere Centromere upsBsh A B B DBL1-aCIDR1aDBL2-b C2 DBL3-gDBL4-dCIDR-b ATS
MAL6P1.316 Near telomere Centromere upsBsh^ A X X DBL1-aCIDR-bDBL2-b C2 DBL3-gDBL4-zDBL5-e ATS
PFL0020w Near telomere Centromere upsBsh X X B DBL1-aCIDR-bDBL2-b C2 DBL3-gDBL4-zDBL5-e ATS
MAL6P1.4 Telomeric Centromere upsB C X B DBL1-aCIDR1-aDBL2-b
C2 DBL3-gDBL4-d CIDR-gDBL5-e DBL6-e DBL7-e
ATS
PF11_0007 Telomeric Centromere upsB X B D DBL1-aCIDR1-aDBL2-dCIDR-b ATS
PF08_0142 Telomeric Centromere upsB B B D DBL1-aCIDR1-aDBL2-dCIDR-b ATS
PFE0005w Telomeric Centromere upsB B B D DBL1-aCIDR1-aDBL2-dCIDR-b ATS
PFA0005w Telomeric Centromere upsB B C B DBL1-aCIDR1-aDBL2-dCIDR-b ATS
PFA0765c Telomeric Centromere upsB B B B DBL1-aCIDR1-aDBL2-dCIDR-b ATS
PFC1120c Telomeric Centromere upsB B B B DBL1-aCIDR1-aDBL2-dCIDR-b ATS
PFD0005w Telomeric Centromere upsB B B B DBL1-aCIDR1aDBL2-gDBL4-xd
CIDR-b
ATS
PFI0005w Telomeric Centromere upsB D B B DBL1-aCIDR1-aDBL2-dCIDR-g ATS
PF13_0364 Telomeric Centromere upsB D B B DBL1-aCIDR1-aDBL2-dCIDR-b ATS
PF07_0139 Telomeric Centromere upsB D B B DBL1-aCIDR1aDBL2-dCIDR-bDBL3-e ATS
PFB1055c Telomeric Centromere upsB D B B DBL1-aCIDR1-aDBL2-dCIDR-b ATS
PF10_0406 Telomeric Centromere upsB B B B DBL1-aCIDR1-aDBL2-dCIDR-b ATS
PFL0005w Telomeric Centromere upsB B B B DBL1-aCIDR1-aDBL2-dCIDR-b ATS
PFB0010w Telomeric Centromere upsB B B B DBL1-aCIDR1aDBL2-g
ATS
PFC0005w Telomeric Centromere upsB B B B DBL1-aCIDR1-aDBL2-dCIDR-b ATS
PFL2665c Telomeric Centromere upsB B B B DBL1-aCIDR1-aDBL2-dCIDR-b ATS
PF13_0001 Telomeric Centromere upsB B B B DBL1-aCIDR1-aDBL2-dCIDR-b ATS
MAL6P1.1 Telomeric Centromere upsB E B B DBL1-aCIDR1-aDBL2-dCIDR-b ATS
PFD1245c Telomeric Centromere upsB X C B DBL1-aCIDR1-aDBL2-dCIDR-b ATS
PFI1830c Telomeric Centromere upsB C B B DBL1-aCIDR1-aDBL2-dCIDR-g ATS
PF10_0001 Telomeric Centromere upsB C B B DBL1-aCIDR1-aDBL2-dCIDR-g
ATS
PFL0935c Centromeric Telomere upsB D C B DBL1-aCIDR1-aDBL2-dCIDR-g ATS
PFD0635c Centromeric Telomere upsBsh C C C DBL1-aCIDR1-aDBL2-dCIDR-g ATS
PFL1955w Centromeric Telomere upsBsh C C C DBL1-aCIDR1-aDBL2-dCIDR-b ATS
PF08_0106 Centromeric Telomere upsBsh C C X DBL1-aCIDR1-aDBL2-dCIDR-b ATS
MAL7P1.50 Centromeric Telomere upsBsh C C X DBL1-aCIDR1-aDBL2-dCIDR-g ATS
PF08_0103 Centromeric Telomere upsBsh B C X DBL1-aCIDR1-aDBL2-dCIDR-b ATS
MAL7P1.55 Centromeric Telomere upsBsh B C C DBL1-aCIDR1-aDBL2-dCIDR-g
ATS
PF07_0050 Centromeric Telomere upsBsh B B D DBL1-aCIDR1-aDBL2-b C2 DBL3-g ATS
PFD1005c Centromeric Telomere upsBsh E B C DBL1-aCIDR1-aDBL2-dCIDR-g ATS
PFL1950w Centromeric Telomere upsB^ E B D DBL1-aCIDR1-aDBL2-b C2 DBL3-dCIDR-b ATS
MAL6P1.252 Centromeric Telomere upsC^ B D X DBL1-aCIDR1-aDBL2-b C2 DBL3-dCIDR-b ATS
MAL7P1.56 Centromeric Telomere upsC^ C B D DBL1-aCIDR1-aDBL2-dCIDR-b ATS
PF08_0107 Centromeric Telomere upsC^ X B D DBL1-aCIDR1-aDBL2-dCIDR-g ATS
PFD0995c Centromeric Telomere upsC C D X DBL1-aCIDR1-aDBL2-dCIDR-g
ATS
PF07_0049 Centromeric Telomere upsC C C X DBL1-aCIDR1-aDBL2-dCIDR-g ATS
PFD0630c Centromeric Telomere upsC C C C DBL1-aCIDR1-aDBL2-dCIDR-g ATS
PFD1000c Centromeric Telomere upsC C B C DBL1-aCIDR1-aDBL2-dCIDR-g ATS
PFD1015c Centromeric Telomere upsC D B X DBL1-aCIDR1-aDBL2-dCIDR-b ATS
PFD0615c Centromeric Telomere upsC C X X DBL1-aCIDR1-aDBL2-dCIDR-b ATS
PF07_0051 Centromeric Telomere upsC C D X DBL1-aCIDR1-aDBL2-dCIDR-b ATS
PF07_0048 Centromeric Telomere upsC C C C DBL1-aCIDR1-aDBL2-dCIDR-b
ATS
PFL1960w Centromeric Telomere upsC C C X DBL1-aCIDR1-aDBL2-dCIDR-b ATS
PFD0625c Centromeric Telomere upsC C C X DBL1-aCIDR1-aDBL2-dCIDR-b ATS
PfEMP1 Strain
3D7 gene with closest related 5´ sequence 5´ region
DBL1-CIDR1 ATS 3´ region var1 family 3D7 homologue: PFE1640w
var2 family 3D7 homologue: PFL0030c
AAA75397 FCR3 MAL6P1.316upsBsh^ A C D DBL1-aCIDR1-aDBL2-b C2 DBL3-gDBL4-dCIDR-b ATS
AAA75396 Dd2 PF07_0050 upsB C B X DBL1-aCIDR1-aDBL2-b C2 DBL3-gDBL4-dCIDR-b ATS
AAA75398 FCR3 PF07_0139 upsB E B X DBL1-aCIDR1aDBL2-b C2 DBL3-dCIDR-b ATS
AAD03351 It PFL2665c upsB X nd. nd. DBL1-aCIDR1-aDBL2-b C2 DBL3-dCIDR-b DBL4-gDBL5-b AF193424 It PF08_0142 upsB X nd. nd. DBL1-aCIDR1-aDBL2-b C2 DBL3-g
AAB60251 MC - nd. B B D DBL1-aCIDR1-aDBL2-dCIDR-gDBL3-bDBL4-e ATS
AAC05220 - PFD0005w upsB B nd. nd. DBL1-aCIDR1aDBL2-b
C2 DBL3-d AAC47438 FCR3 PFB1055c upsB X B nd. DBL1-aCIDR1aDBL2-b C2 DBL3-dCIDR-b ATS
AAB06961 It PFL0020w upsBsh X nd. nd. DBL1-aCIDR1-aDBL2-b C2 DBL3-dCIDR-b AAA75399 Dd2 PFD1015c upsC B C X DBL1-aCIDR1-aDBL2-dCIDR-b ATS
AAC05730 FCR3 - nd. C C nd. DBL1-aCIDR1-aDBL2-dCIDR-b ATS
Domain structure
Known domain structure Both 5´region and coding sequences are conserved [42]
Both 5´region and coding sequences are conserved [35]
var1
vargroup A
var group B var2
vargroup C var group B/A
var group B/C A
meric located genes with a upsC 5'region.
Group A comprise most large PfEMP1s with a domain structure different from the most common 4-domain type, which is the predominant domain structure of Group B and C. Two genes PF08_0140 and MAL6P1.316 were classified as B/A because they had upsBsh 5' regions and chromosomal characteristics in common with group B genes, but had DBLα-CIDR1 sequences and domain structure characteristic for group A genes. Interestingly, these two genes are adjacent to a group A var or a pseudo
var gene with an upsA region both transcribed in the opposite direction, thereby merging their 5'regions. Add-ing the DBL1α-CIDR1 of the flankAdd-ing pseudogene MAL6P1.317 to the alignments placed this pseudogene within DBLα-CIDR1 cluster A.
Sequence analysis DBLαCIDR1 domains of other parasite
strains than 3D7
To investigate whether the suggested grouping of var genes also could be used to group var genes from other parasites than 3D7, eleven var genes available in Genbank were analysed. Figure 7B shows that eight of the nine 5' sequences were classified as upsB or upsBsh, and the remaining sequence was classified as upsC. Most 3D7 genes with an upsB 5'region encode two DBL and two CIDR domains. This was only the case for two of the eleven genes. Thus, the non 3D7 var genes in the database do not seem to represent the 3D7 var gene repertoire and genes with upsA 5' region were absent. Although the pic-ture was not entirely clear, more detailed analysis of the individual non 3D7 var genes revealed interesting similar-ities to individual 3D7 var genes. AAA75397 from FCR3 has a upsBsh 5' region followed by a group A DBLα-CIDR1 sequence. The 5' region of this gene was 96% identical to the upsBsh of MAL6P1.316, which in itself showed rather low similarity to the other upsBsh regions in 3D7. As AAA75397, MAL6P1.316 carry a group A DBL1-CIDR1. AAC47438, AAB06961, and AF193424 car-ried DBLα-CIDR1 classified as X and had complex domain structures. When the DBLα sequences of these genes were analysed in with 3D7 DBLαs they clustered with PFL0020w, and PF07_0050 (data not shown), which also have complex domain structures. Attempts were made to group the large number of DBLα sequences[35] generated using the degenerate primer set designed by Taylor et al.[36]. However, grouping could not be main-tained by these short sequences.
Discussion
The publication of the P. falciparum genome divided the
var genes in different types according to the domain struc-ture of the encoded proteins [17]. Other groups have described semi-conserved regions upstream from the
basis [18,19,29]. We have synthesised the available information and suggest a somewhat different division of the var genes into three major groups (A-C) and two inter-mediate groups (B/A and B/C), which represent transi-tions between A, B, and C. The genes were grouped according to chromosomal location and transcription direction, domain structure of the encoded proteins, and sequence similarities in coding and non-coding regions.
Group A consists of ten genes consistently identified as a distinct group by sequence analysis. Interestingly, recom-binant CIDR domains based on the group A sequences do not bind CD36, by contrast to CIDR domains produced on the basis of groups B and C [20]. Group A var genes mainly encode large PfEMP1s with complex multi-domain structure. Nine of the Group A var genes are flanked by a rif gene, which is transcribed in the opposite direction. Thus, the 5' regions of the rif and var genes merge. The fact that this organisation has been main-tained in the 3D7 genome indicates that the DNA between the coding regions constitutes a functional unit, possibly regulating either recombination or transcription. If the latter is the case the genes could be co-regulated and there might be a functional relationship between the encoded PfEMP1s and RIFINs.
The largest var group in 3D7, group B, comprise 22 genes sharing 5' upsB region. All genes but one are located in the telomeric region. The encoded proteins typically have the characteristic four-domain structure, DBLα-CIDRα-DBLδ-CIDR2. The 13 genes of group C are centromeric. The genes all share 5' upsC region and 12 of them encode pro-teins with the common four-domain structure. Genes of the B/A and B/C groups have characteristics indicating that they constitute intermediate forms between groups A and B, and groups B and C, respectively. Two genes, which have previously been shown to be present in most P.
falci-parum genomes, did not fit into any of the groups.
Compared to other var genes they appear to be unusually conserved [28,24,37]and it has been suggested that they belong to var gene subfamilies named var1 and var2, respectively [24,28].
To investigate whether the proposed groupings of 3D7 var
shared characteristics with at least one group B 3D7 var
gene, and none of them shared characteristics with the 3D7 var genes belonging to group A. The upstream region identified one gene as belonging to group C. This encoded a protein with a domain structure typical of 3D7 group C PfEMP1s. Thus, although the data are limited, analysis of non 3D7 var genes suggested that the proposed nomenclature could be used in a general classification of
var genes.
The suggested grouping of var genes is operational and based on best judgement. It is likely that future work will change the classification and move genes between groups, nevertheless we believe that this grouping is helpful as starting point for understanding the evolution of the var
gene repertoire and developing hypotheses about their function.
The fact that 5' regions predict var gene chromosomal organisation and domain structure, and sequence similar-ities in coding and non-coding regions several thousand bases downstream from the translation initiation site implies that recombination, or other mechanisms of homogenizing exchange is much more likely to occur between var genes within a group than between var genes of different groupings. It can be proposed that an original ancestral var gene has been duplicated and diverged in the three main types, and each of these have then diverged into the genes of each group. In this process information may also have been exchanged between genes of different groupings. The data suggests that some exchange have taken place between groups B and C and some character-istics of group A have leaked into these groups, but that characteristics from groups B and C have not gained access to group A. It is tempting to speculate that distinct chro-mosomal organisation patterns restrict recombination and that the conserved flanking regions serve to align genes of similar group for recombination. The fact that a putative boundary of the upstream sequence could be determined for most var genes may suggest that these sites also serve as splicing sites for insertion of larger gene frag-ments or whole genes.
Why then are var genes structured into different groups? By mediating parasite binding to endothelium, PfEMP1 enables the parasite to sequester and avoid filtering through the spleen. Thus, parasites expressing PfEMP1, which are most effective in sequestering infected erythro-cytes, will obtain the highest growth rates. How effective a given PfEMP1 is in binding in a particular host will depend on the binding characteristics of the PfEMP1, on the ligands that are available in the host [38], and the anti-PfEMP1 antibody repertoire in the infected individual [11,39,40]. Parasites causing severe malaria express phe-notypes that are more often recognised by antibodies in
children's plasma than the phenotypes expressed by para-sites causing uncomplicated disease [41];[40]. The pheno-types associated with severe disease also tend to be serologically cross-reactive (Nielsen et al., in preparation). Given that immunity to severe malaria is developed rela-tively early in life, it is possible to speculate that the most severe forms of malaria are caused by fast growing parasites expressing PfEMP1s optimized to mediate a very effective binding in non immune hosts. To maintain effec-tive binding these PfEMP1 types are probably functionally constrained, and consequently have tight limits to the degree to which they can vary. The fact that recombination within var genes of group A appear to be the most con-strained, suggests that the PfEMP1s associated with severe malaria will be encoded by group A var genes. This hypothesis is in agreement with findings from China indi-cating that parasites from individuals suffering from cere-bral malaria compared with cases of non-severe malaria expressed high molecular weight PfEMP1s [42] and a study from Brazil where expression of DBLα domains lacking 1–2 cysteine residues in DBLα homology block G were mainly found among severe malaria cases [43]. In 3D7 this is a feature of all genes of group DBLα-CIDR1 group A (var gene group A).
In most endemic settings transmission does not occur continuously, but is highly seasonal and in some areas restricted to a few months of every year [44]. In such a sit-uation the ability to establish chronic infections is impor-tant for parasite survival and transmission. Chronic human malaria infections are associated with 'shift' in PfEMP1 expression [45] and it has been proposed that such shifts are driven by antibody forcing parasites to express PfEMP-1 molecules which are less optimal for adhesion, but not recognised by cross reactive antibodies. It is possible to speculate that PfEMP1s of groups B and C could serve this function.
In areas of high malaria endemicity, women who have acquired malaria immunity during childhood become susceptible to malaria during their first pregnancies [46] and are infected by parasites expressing antigens that mediate binding to CSA in placenta [8]. Parasites of this phenotype can apparently only expand and establish infection in individuals carrying a placenta and these par-asites do not cross-react serologically with non-placental parasites [38]. It has been recently reported that PFL0030c is the dominant var gene transcribed in parasites selected for CSA binding and that most parasite genomes carry very similar genes, the var2 family [28], Interestingly, the
control, such as oncogenes and genes involved in cellular differentiation (reviewed by Kozak, 2002). The function of the uORF 5' of var2 remains unclear.
Conclusion
The analysis of the var gene repertoire in 3D7 indicates that the var genes can be assigned to different groups and that exchange of genetic information is more likely to take place between the genes in a group than between genes of different grouping. The groups are probably maintained by inhibition of recombination due to differences in chro-mosomal locations and direction of transcription. It is likely that the proteins encoded within the groups have evolved to serve different functions enabling the parasite to survive under a range of transmission patterns in non-pregnant and non-pregnant hosts with varying degree of acquired immunity.
Authors' contributions
TL collected the sequences and performed the cluster anal-ysis. AS did the laboratory experiments on the var2 uORF. All authors participated in the analysis and interpretation of data. TL produced the first draft. All authors contrib-uted to writing the manuscript.
Acknowledgements
The PlasmoDB database http://www.plasmodb.org was the essential resource for this work. We are thus indebted to all those who generated the data available at PlasmoDB. Odile Mercereau-Puijalon is thanked for supplying sequence material. This work was supported by grants from the Danish Medical Research Council (ref. No. 22-02-0220) and the Commis-sion of the European Communities (grants no. QLK2-CT-1999-01293 (EUROMALVAC)). AS is funded by a Ph.D. grant from the Gates Malaria Partnership.
References
1. David PH, Hommel M, Miller LH, Udeinya IJ and Oligino LD: Parasite sequestration in Plasmodium falciparum malaria: spleen and antibody modulation of cytoadherence of infected erythrocytes.Proc Natl Acad Sci U S A 1983, 80:5075-5079. 2. Howard RJ and Barnwell JW: Roles of surface antigens on
malaria-infected red blood cells in evasion of immunity. Con-temp Top Immunobiol 1984, 12:127-191.
3. Turner GDH, Morrison H, Jones M, Davis TME, Looareesuwan S, Buley ID, Gatter KC, Newbold CI, Pukritayakamee S, Nagachinta B, White NJ and Berendt AR: An immunohistochemical study of the pathology of fatal malaria: evidence for widespread endothelial activation and a potential role for intercellular adhesion molecule-1 in cerebral sequestration. Am J Pathol
1994, 145:1057-1069.
4. Fried M and Duffy PE: Maternal malaria and parasite adhesion.
J Mol Med 1998, 76:162-171.
5. Newbold CI, Craig AG, Kyes S, Berendt AR, Snow RW, Peshu N and Marsh K: PfEMP1, polymorphism and pathogenesis.Ann Trop Med Parasitol 1997, 91:551-557.
6. Barnwell JW, Asch AS, Nachman RL, Yamaya M, Aikawa M and Ingrav-allo P: A human 88-kD membrane glycoprotein (CD36) func-tions in vitro as a receptor for a cytoadherence ligand on
Plasmodium falciparum-infected erythrocytes.J Clin Invest 1989,
84:765-772.
7. Berendt AR, Simmons DL, Tansey J, Newbold CI and Marsh K: Inter-cellular adhesion molecule-1 is an endothelial cell adhesion receptor for Plasmodium falciparum.Nature 1989, 341:57-59.
chondroitin sulphate A in the human placenta.Science 1996,
272:1502-1504.
9. Smith JD, Chitnis CE, Craig AG, Roberts DJ, Hudson-Taylor DE, Peterson DS, Pinches R, Newbold CI and Miller LH: Switches in expression of Plasmodium falciparum var genes correlate with changes in antigenic and cytoadherent phenotypes of infected erythrocytes.Cell 1995, 82:101-110.
10. Marsh K, Otoo L, Hayes RJ, Carson DC and Greenwood BM: Anti-bodies to blood stage antigens of Plasmodium falciparum in rural Gambians and their relation to protection against infection.Trans R Soc Trop Med Hyg 1989, 83:293-303.
11. Bull PC, Lowe BS, Kortok M, Molyneux CS, Newbold CI and Marsh K: Parasite antigens on the infected red cell are targets for naturally acquired immunity to malaria. Nature Med 1998,
4:358-360.
12. Dodoo D, Staalsoe T, Giha H, Kurtzhals JAL, Akanmori BD, Koram K, Dunyo S, Nkrumah FK, Hviid L and Theander TG: Antibodies to variant antigens on the surfaces of infected erythrocytes are associated with protection from malaria in Ghanaian children.Infect Immun 2001, 69:3713-3718.
13. Giha HA, Staalsoe T, Dodoo D, Roper C, Satti GM, Arnot DE, Hviid L and Theander TG: Antibodies to variable Plasmodium falci-parum-infected erythrocyte surface antigens are associated with protection from novel malaria infections.Immunol Lett
2000, 71:117-126.
14. Su X, Heatwole VM, Wertheimer SP, Guinet F, Herrfeldt JA, Peterson DS, Ravetch JA and Wellems TE: The large diverse gene family
var encodes proteins involved in cytoadherence and anti-genic variation of Plasmodium falciparum-infected erythrocytes.Cell 1995, 82:89-100.
15. Baruch DI, Pasloske BL, Singh HB, Bi X, Ma XC, Feldman M, Tarachi TF and Howard RJ: Cloning the Plasmodium falciparum gene encoding PfEMP1, a malarial variant antigen and adherence receptor on the surface of parasitized human erythrocytes.
Cell 1995, 82:77-87.
16. Smith JD, Subramanian G, Gamain B, Baruch DI and Miller LH: Clas-sification of adhesive domains in the Plasmodium falciparum
erythrocyte membrane protein 1 family.Mol Biochem Parasitol
2000, 110:293-310.
17. Gardner MJ, Hall N, Fung E, White O, Berriman M, Hyman RW, Carl-ton JM, Pain A, Nelson KE, Bowman S, Paulsen IT, James K, Eisen JA, Rutherford K, Salzberg SL, Craig A, Kyes S, Chan MS, Nene V, Shal-lom SJ, Suh B, Peterson J, Angiuoli S, Pertea M, Allen J, Selengut J, Haft D, Mather MW, Vaidya AB, Martin DMA, Fairlamb AH, Fraunholz MJ, Roos DS, Ralph SA, Mcfadden GI, Cummings LM, Subramanian GM, Mungall C, Venter JC, Carucci DJ, Hoffman SL, Newbold C, Davis RW, Fraser CM and Barrell B: Genome sequence of the human malaria parasite Plasmodium falciparum. Nature 2002,
419:498-511.
18. Voss TS, Thompson JK, Waterkeyn J, Felger I, Weiss N, Cowman AF and Beck HP: Genomic distribution and functional characteri-sation of two distinct and conserved Plasmodium falciparum var gene 5' flanking sequences. Mol Biochem Parasitol 2000,
107:103-115.
19. Mercereau-Puijalon O, Barale JC and Bischoff E: Three multigene families in Plasmodium parasites: facts and questions.Int J Parasitol 2002, 32:1323-1344.
20. Robinson BA, Welch TL and Smith JD: Widespread functional specialization of Plasmodium falciparum erythrocyte mem-brane protein 1 family members to bind CD36 analysed across a parasite genome.Mol Microbiol 2003, 47:1265-1278. 21. Fernandez V, Hommel M, Chen QJ, Hagblom P and Wahlgren M:
Small, clonally variant antigens expressed on the surface of the Plasmodium falciparum-infected erythrocyte are encoded by the rif gene family and are the target of human immune responses.J Exp Med 1999, 190:1393-1403.
22. Kyes SA, Rowe JA, Kriek N and Newbold CI: Rifins: a second fam-ily of clonally variant proteins expressed on the surface of red cells infected with Plasmodium falciparum.Proc Natl Acad Sci U S A 1999, 96:9333-9338.
Publish with BioMed Central and every scientist can read your work free of charge "BioMed Central will be the most significant development for disseminating the results of biomedical researc h in our lifetime."
Sir Paul Nurse, Cancer Research UK
Your research papers will be:
available free of charge to the entire biomedical community
peer reviewed and published immediately upon acceptance
cited in PubMed and archived on PubMed Central
yours — you keep the copyright
Submit your manuscript here:
http://www.biomedcentral.com/info/publishing_adv.asp
BioMedcentral
and sequence data (both finished and unfinished).Nucleic Acids Res 2002, 30:87-90.
24. Salanti A, Staalsoe T, Lavstsen T, Jensen A, Sowa M, Arnot D, Hviid L and Theander TG: Selective up-regulation of a single distinctly structured var gene in CSA-adhering Plasmodium falciparum
involved in pregnancy-associated malaria.Mol Microbiol 2003,
49:179-191.
25. Hall TA: BioEdit:a user-friendly biological sequence align-ment editor and analysis program for Windows 95/98/NT.
Nucl Acids Symp Ser 1999, 41:95-98.
26. Kumar S, Tamura K, Jakobsen I and Nei M: MEGA2 : Molecular Evolutionary Genetics Analysis. Ver. 2.1.Bioinformatics 2001,
17:1244-1245.
27. Rowe JA, Kyes SA, Rogerson SJ, Babiker HA and Raza A: Identifica-tion of a conserved Plasmodium falciparum var gene impli-cated in malaria in pregnancy.J Infect Dis 2002, 185:1207-1211. 28. Salanti A, Jensen AT, Zornig HD, Staalsoe T, Joergensen L, Nielsen
MA, Khattab A, Arnot DE, Klinkert MQ, Hviid L and Theander TG: A sub-family of common and highly conserved Plasmodium fal-ciparum var genes.Mol Biochem Parasitol 2002, 122:111-115. 29. Vazquez-Macias A, Martinez-Cruz P, Castaneda-Patlan MC, Scheidig
C, Gysin J, Scherf A and Hernandez-Rivas R: A distinct 5' flanking var gene region regulates Plasmodium falciparum variant erythrocyte surface antigen expression in placental malaria.
Mol Microbiol 2002, 45:155-167.
30. Buffet PA, Gamain B, Scheidig C, Baruch D, Smith JD, Hernandez-Rivas R, Pouvelle B, Oishi S, Fujii N, Fusai T, Parzy D, Miller LH, Gysin J and Scherf A: Plasmodium falciparum domain mediating adhe-sion to chondroitin sulfate A: a receptor for human placental infection.Proc Natl Acad Sci U S A 1999, 96:12743-12748.
31. Costa FT, Fusai T, Parzy D, Sterkers Y, Torrentino M, Douki JB, Traore B, Petres S, Scherf A and Gysin J: Immunization with recombinant duffy binding like gamma3 induce pan reactive and adhesion blocking antibodies against placental chondroi-tin sulfate A binding Plasmodium falciparum parasites.J Infect Dis 2003, 188:153-164.
32. Kyes S, Christodoulou Z, Raza A, Horrocks P, Pinches R, Rowe A and Newbold CI: A well-conserved Plasmodium falciparum var gene shos an unusual stage-specific transcript pattern.Mol Microbiol
2003, 48:1339-1348.
33. Voss TS, Kaestli M, Vogel D, Bopp S and Beck HP: Identification of nuclear proteins that interact differentially with Plasmodium
falciparum var gene promoters. Mol Microbiol 2003,
48:1593-1607.
34. Calderwood MS, Gannoun-Zaki L, Wellems TE and Deitsc : Plasmo-dium falciparum var genes are regulated by two regions with separate promoters, on upstream of the coding region and a second within the intron.J Biol Chem 2003.
35. Ward CP, Clottey GT, Dorris M, Ji D-D and Arnot DE: Analysis of
Plasmodium falciparum PfEMP-1/ var genes indicates that recombination rearranges constrained sequences. Mol Bio-chem Parasitol 1999, 102:167-177.
36. Taylor HM, Kyes SA, Harris D, Kriek N and Newbold CI: A study of
var gene transcription in vitro using universal var gene primers.Mol Biochem Parasitol 2000, 105:13-23.
37. Rowe JA, Kyes SA, Rogerson SJ, Babiker HA and Raza A: Identifica-tion of a conserved Plasmodium falciparum var gene impli-cated in malaria in pregnancy. .
38. Ricke CH, Staalsoe T, Koram K, Akanmori BD, Riley EM and Thean-der TG: Plasma antibodies from malaria-exposed pregnant women recognize variant surface antigens on Plasmodium falciparum-infected erythrocytes in a parity-dependent man-ner and block parasite adhesion to chondroitin sulphate A.J Immunol 2000, 165:3309-3316.
39. Bull PC, Lowe BS, Kortok M and Marsh K: Antibody recognition of Plasmodium falciparum erythrocyte surface antigens in Kenya: evidence for rare and prevalent variants.Infect Immun
1999, 67:733-739.
40. Nielsen MA, Staalsoe T, Kurtzhals JA, Goka BQ, Dodoo D, Alifrangis M, Theander TG, Akanmori BD and Hviid L: Plasmodium falci-parum variant surface antigen expression varies between iso-lates causing severe and nonsevere malaria and is modified by acquired immunity.J Immunol 2002, 168:3444-3450. 41. Bull PC, Kortok M, Kai O, Ndungu F, Ross A and Lowe BS:
Plasmo-dium falciparum-infected erythrocytes: agglutination by
diverse Kenyan plasma is associated with severe disease and young host age.J Infect Dis 2000, 182:252-259.
42. Bian Z, Wang G, Tian X and Fan J: Expression of Plasmodium fal-ciparum-infected erythrocyte membrane protein from cere-bral malaria patients.Zhongguo Ji Sheng Chong Xue Yu Ji Sheng Chong 1999, 17:359-362.
43. Kirchgatter K and Portillo HA: Association of severe noncere-bral Plasmodium falciparum malaria in Brazil with expressed PfEMP1 DBL1 alpha sequences lacking cysteine residues.Mol Med 2002, 8:16-23.
44. Giha HA, Rosthoj S, Dodoo D, Hviid L, Satti GMH, Scheike T, Arnot DE and Theander TG: The epidemiology of febrile malaria epi-sodes in an area of unstable and seasonal transmission.Trans R 2000, 94:645-651.
45. Staalsoe T, Hamad AA, Hviid L, Elhassan IM, Arnot DE and Theander TG: In vivo switching between variant surface antigens in human Plasmodium falciparum infection. J Infect Dis 2002,
186:719-722.