This is a repository copy of The validity of using surface meshes for evaluation of three-dimensional maxillary and mandibular surgical changes.
White Rose Research Online URL for this paper: http://eprints.whiterose.ac.uk/97511/
Version: Accepted Version
Article:
Jabar, N, Robinson, W, Goto, TK et al. (1 more author) (2015) The validity of using surface meshes for evaluation of three-dimensional maxillary and mandibular surgical changes. International Journal of Oral and Maxillofacial Surgery, 44 (7). pp. 914-920. ISSN
0901-5027
https://doi.org/10.1016/j.ijom.2015.02.005
© 2016, Elsevier. Licensed under the Creative Commons Attribution-NonCommercial-NoDerivatives 4.0 International http://creativecommons.org/licenses/by-nc-nd/4.0/
[email protected] https://eprints.whiterose.ac.uk/ Reuse
Unless indicated otherwise, fulltext items are protected by copyright with all rights reserved. The copyright exception in section 29 of the Copyright, Designs and Patents Act 1988 allows the making of a single copy solely for the purpose of non-commercial research or private study within the limits of fair dealing. The publisher or other rights-holder may allow further reproduction and re-use of this version - refer to the White Rose Research Online record for this item. Where records identify the publisher as the copyright holder, users can verify any specific terms of use on the publisher’s website.
Takedown
If you consider content in White Rose Research Online to be in breach of UK law, please notify us by
The validity of using surface meshes for evaluation of three-dimensional maxillary and mandibular surgical changes.
Norhayati Jabara, Wayne Robinsona, Tazuko Gotob, Balvinder Khambaya
a
Paediatric Dentistry and Orthodontics, Faculty of Dentistry, The University of Hong Kong, Hong Kong
bOral Diagnosis & Polyclinics, Faculty of Dentistry, The University of Hong
Kong, Hong Kong
Address for correspondence
Balvinder S Khambay,
Paediatric Dentistry and Orthodontics, Faculty of Dentistry,
The University of Hong Kong, Hong Kong.
Email: [email protected]
Short running title:
Surface meshes for evaluation of 3D hard tissue surgical changes
Summary
Introduction
Orthognathic surgery involves correction of a dentofacial dysmorphology by repositioning the maxillary and mandibular bones into the pre-planned position with six degrees of freedom. This refers to the freedom of movement of a rigid body in three-dimensional space. The body is free to move anteriorly or posteriorly, superiorly or inferiorly, laterally or medially (translation in three perpendicular axes) combined with rotation about the three perpendicular axes, termed pitch, yaw, and roll respectively. The potentially complex positional changes of the maxilla and mandible required during surgery are presently determined by a combination of pre-operative model surgery planning,1 two-dimensional (2D) photocephalometeric planning2 or three-dimensional (3D) planning.3
Therefore the aim of this study was to determine the validity of using surface models as a method of assessing positional changes of the maxilla and the mandible as a result of simulated surgery.
Materials and methods
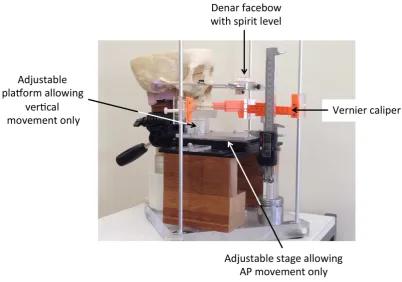
A Le Fort I osteotomy was performed on a plastic skull. Prior to the osteotomy a locating plate was constructed from acrylic that allowed the maxilla to be returned to its original position. The skull was mounted onto an adjustable universal joint which was secured to a 2cm thick Perspex base. An adjustable stage from a defunct microscope was placed below the maxilla; between the stage and maxillary occlusal plane there was a height adjustable platform. Once the maxilla was secured to the platform this arrangement allowed only 2 degrees of freedom of movement of the maxilla i.e. anteriorly or posteriorly and superiorly or inferiorly; any pitch, yaw, roll and lateral or medial movements were restricted. Using a Denar slidematic facebow (Whipmix, Louisville, KY) with a spirit level the skull was oriented and secured so the Frankfort plane and inter-auricular plane were horizontal; the skull assembly was conebeam CT (CBCT) scanned using 0.4mm resolution and 22cm Extended Field of View (iCAT, Imaging Science, Hatfield).
skull was CBCT scanned using the protocol previously described, Figure 1. In total 4 separate downgraft, 11 separate advancement and 12 combined downgraft and advancement procedures were simulated for the maxilla.
Figure 1 Experimental set-up for simulated surgical movements.
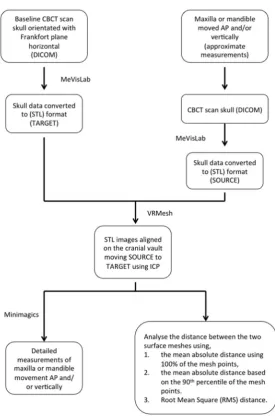
Figure 2 Data processing pipeline
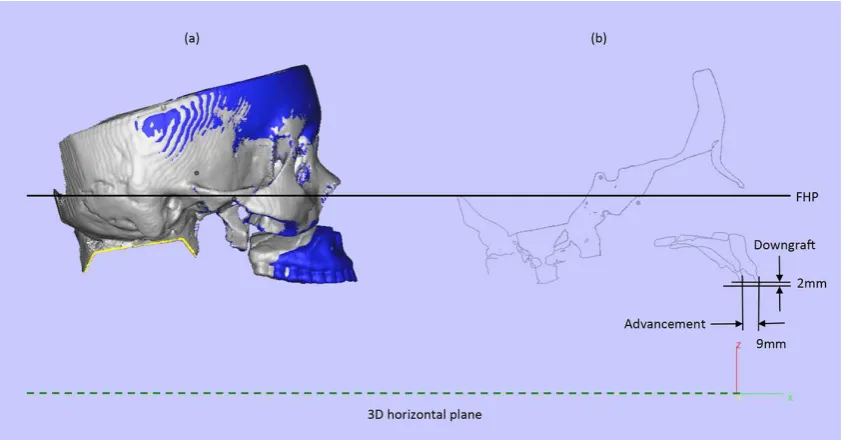
plane, of the two superimposed images. Horizontal and vertical changes in the maxillary position were measured, Figure 3.
wax and CBCT scanned using the same scanning protocol. The same software pipeline was used to determine the horizontal changes of the mandible at each of the 4 advancement increments.
Figure 3 Measuring actual horizontal and vertical changes in maxillary position, (a). 3D surfaces models superimposed on cranial base, baseline model (silver) and 9mm advancement and 2mm downgraft model (blue), (b). Horizontal and vertical changes in maxillary position based on a profile, passing through the sagittal plane of the two superimposed images.
Error Study
To assess the reproducibility of the method, the superimposition and maxillary and mandibular movements were re-measured for 5 random surgical movements after 4 weeks later. Using a Students t-test and coefficient of
Analysis
The results of the error study showed there was no systematic error (p=0.56) or random error (r=0.99) and the maximum error between readings was 0.2mm.
Each pair of aligned baseline and simulated surgical 3D models were imported into VRMesh and both the skull images were deleted leaving only the maxilla or mandible, Figure 4. For each simulated surgical movement three methods were used to analyse the distance between the two surface meshes, the mean absolute distance using 100% of the mesh points, the mean absolute distance based on the 90th percentile of the mesh points and the Root Mean Square (RMS) distance. The mean 90th percentile was determined by arranging the absolute distances between the two surface meshes for 100% of the mesh points in descending order and then calculating the mean of the lower 90th percentile. The RMS distance was calculated by squaring the absolute distances of 100% of the mesh points between the two surface meshes, averaging the squares, and then taking the square root.
Results
Maxillary advancement
distance based on the 90th percentile of the mesh points and the Root Mean Square (RMS) distances respectively, Table 1.
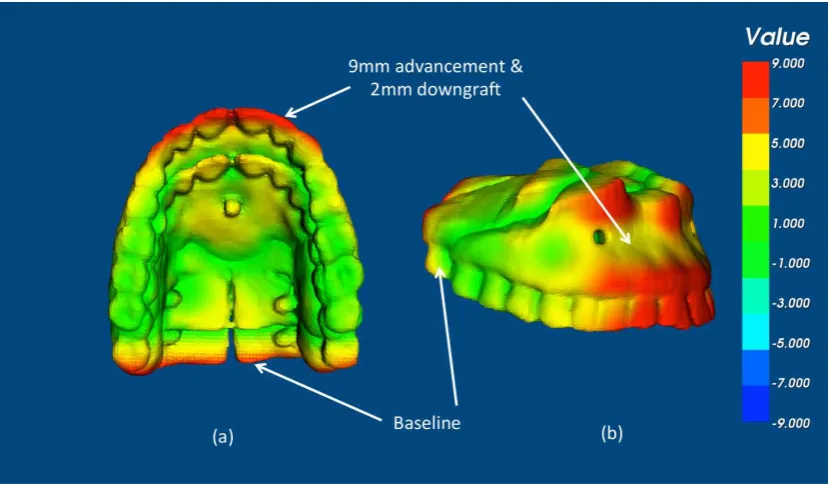
Figure 4 Using VRMesh the skull images were deleted leaving only the maxilla and the difference between the two surfaces determined based on an colour distance map, (a). occlusal view and (b). bucco-labial view.
Maxillary downgraft
Maxillary downgraft and advancement
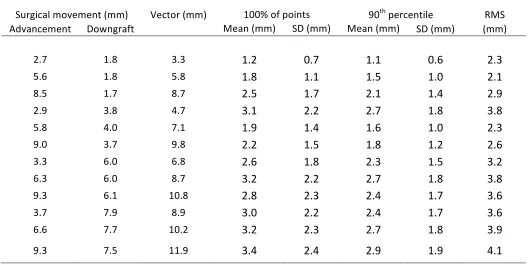
Since this was a bi-directional movement, the ÒnetÓ change in the actual maxillary position was described as a vector of displacement. For example if the maxilla moved down 3mm and advanced 4mm the vector of displacement was calculated at 5mm.
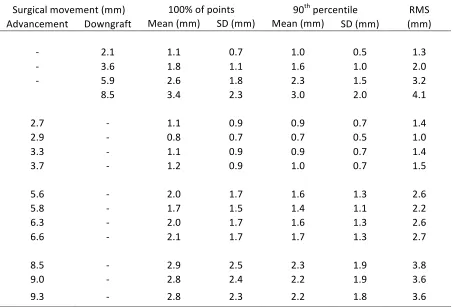
The actual amount of maxillary movement was underestimated by approximately 30%, 30% and 40%, of the actual advancement using the mean absolute distance of 100% of the mesh points, the mean absolute distance based on the 90th percentile of the mesh points and the Root Mean Square (RMS) distances respectively, Table 2. In all cases the largest differences were observed with the largest simulated movements.
Mandibular advancement
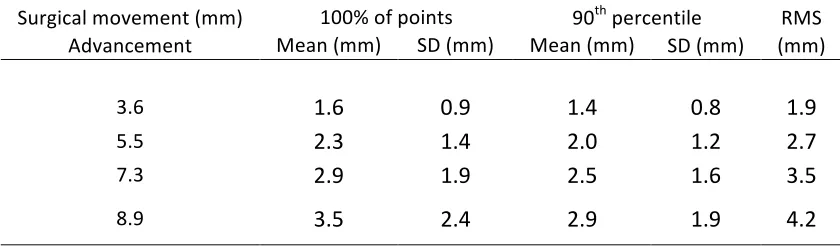
The absolute mean distance was approximately 41% and 36% of the actual advancement using the mean absolute distance of 100% of the mesh points and the mean absolute distance based on the 90th percentile of the mesh points respectively. The RMS measurement was approximately half of the actual amount, Table 3.
Discussion
quantifiable due to peri-operative surgical error, relapse, dental movement and bone surface remodelling.10 Therefore a plastic skull was used to simulate the various surgical movements. Unfortunately it is not possible to compare the results of the present study with previous studies. Since previous studies have utilised surface meshes to quantify pre-operative and post-operative differences to determine the surgical change in patients when it is unknown i.e. the method was assumed to be valid. The aim of this study was to determine the validity of that assumption.
Complex dentofacial deformities are three dimensional in nature and so 3D planning and movement of the underlying skeletal hard tissue is necessary. Currently CBCT is the favoured method to image the hard tissue. The image obtained can be visualised in many ways; viewing the slice data, direct volume rendered 3D model and 3D surface model rendering. The easiest, most clinically useful and least computational intensive is 3D surface model rendering, resulting in production of a polygonal mesh. The mesh is comprised of points or ÒverticesÓ with known 3D co-orientates.
nearest points. The operator then sets a threshold value and a Òcolour mapÓ is generated with each distance being assigned a specific colour. This method of analysis grossly illustrates the direction and magnitude of movement but cannot describe complex 3D movements. Also any erroneous data due to deflects in the surface mesh will become immediately apparent. To overcome these problems methods of creating anatomical correspondence between the two images have been reported.15 However the software pipeline is complicated and time consuming and so far has only been reported on the mandible. The end result however is still a single linear measurement to describe a 3D change together with a colour map and vector arrows showing the direction of change of the corresponding landmark.15,16
are no outlying data points the measured distances were greater than the 90th percentile distances but less than the actual distance measurement. It should also be appreciated that any physiological bone surface remodelling will directly affect the surface model topography.
For the analysis of pure downgraft movement the mean absolute error grossly underestimated the actual movement and approximately only 40-50% of the true displacement was measured. This is because the points parallel to the direction of movement will ÒslideÓ past one another and a new point will replace the previous point i.e. the distance between the two surfaces will not have changed according to the nearest point analysis i.e. buccal and lingual surface of teeth during maxillary downgraft. True separation of the two surfaces however will only occur in the palate and occlusal surfaces of the teeth, this is where the true displacement is correct. However the areas of little or no change will bias the larger readings reducing them in size. Clinically this maybe further exaggerated since the teeth are often in occlusion during the scan and so cannot be used. Any metallic appliances will cause streak artefact and erroneous data and the palatal vault hard tissue is often poorly converted and imaged during scanning. This makes the use of surface models to measure downgrafts difficult.
the largest movement, Figure 4. However it is these surfaces that are more like to be distorted due to appliances, streak artefacts or the effects of beam hardening. The same problem of basing the analysis on the mean reduces the measurements.
The complexity of measuring bi-directional movements can only really be addressed by considering the vector of the anticipated movement of the points. Using the mean absolute values now becomes even more difficult since the analysis will use the nearest point that is hard to determine. This is reflected in the gross underestimation of the mean absolute distance and the RMS value.
No roll, pitch or yaw movements were incorporated in any of the surgical simulations since the points of one mesh would slide past one another and the net measurement effect would be zero. Introduction of yaw into the surgical simulation is also difficult and would confound the problem hence it was not included. This study used only two of the six degrees of freedom, AP and vertical change, to simplify the analysis, but even then the three chosen methods of analysis were unable to accurately reflect the actual movement. By introducing all six degrees of freedom of movement none of the three common methods of analysis would not be able to measure the actual change.
transformationÓ; this implies that all the points with in the structure maintain a constant relationship. The maxilla can translate whilst maintaining its orientation but it can also change its orientation but maintain its location. No single linear measurement can quantify these complex movements. The single numerical values obtained in this study and previous studies are the Euclidean distances between points. These give no indication of direction but taken into account with the colour map some additional information can be obtained. The use of vectors, which describe magnitude and direction maybe a potential solution16 but again fully describing differential hard tissue in three dimensional space may always prove difficult. Translation into a clinical arena may prove even more difficult.
current surface mesh analysis techniques. Hopefully with time new types of analysis will become available to solve this problem, until then the disadvantages of the current methods should be taken into account when trying to assess 3D hard tissue change.
Conclusions
References
1. Lockwood, H. A planning technique for segmental osteotomies, B J Oral Surg 1974: 12: 102Ð105.
2. Henderson D. The assessment and management of bony deformities of the middle and lower face. Br J Plast Surg 1974: 27:287-296.
3. Popat H, Richmond S, Drage NA. New developments in: three-dimensional planning for orthognathic surgery. J Orthod 2010: 37: 62-71. 4. Bicakci AA, Cankaya OS, Mertoglu S, Yilmaz N, Altan BK. Does
proclination of maxillary incisors really affect the sagittal position of point A? Angle Orthod 2013; 83: 943-947.
5. Damstra J, Fourie Z, Huddleston Slater JJR, Ren Y. Reliability and the smallest detectable difference of measurements on 3-dimensional cone-beam computed tomography images. Am J Orthod Dentofacial Orthop 2011: e107Ð114.
6. Maal TJJ, de Koning MJJ, Plooij JM, Verhamme LM, Rangel F, BergŽ SJ. One year postoperative hard and soft tissue volumetric changes after a BSSO mandibular advancement. Int J Oral Maxillofac Surg 2012; 41: 1137Ð1145.
7. Cevidanes LH, Franco AA, Gerig G, Proffit WR, Slice DE, Enlow DH, Yamashita HK, Kim YJ, Scanavini MA, Vigorito JW. Assessment of mandibular growth and response to orthopedic treatment with 3-dimensional magnetic resonance images. Am J Orthod Dentofacial Orthop 2005; 128: 16-26.
surgery: one year of follow-up. J Oral Maxillofac Surg 2011; 69: 1447-1457.
9. Khambay B, Ullah R. Current methods of assessing the accuracy of three-dimensional soft tissue facial predictions: technical and clinical. Int J Oral Maxillofac Surg (2014), http://dx.doi.org/10.1016/j.ijom.2014.04.007. 10. Sharifi A, Jones R, Ayoub A, Moos K, Walker F, Khambay B, McHugh S.
How accurate is model planning for orthognathic surgery? Int J Oral Maxillofac Surg 2008: 37: 1089-1093.
11. LeCornu M, Cevidanes LH, Zhu H, Wu CD, Larson B, Nguyen T. Three-dimensional treatment outcomes in Class II patients treated with the Herbst appliance: a pilot study. Am J Orthod Dentofacial Orthop 2013; 144: 818-830.
12. Hino CT, Cevidanes LH, Nguyen TT, De Clerck HJ, Franchi L, McNamara JA Jr. Three-dimensional analysis of maxillary changes associated with facemask and rapid maxillary expansion compared with bone anchored maxillary protraction. Am J Orthod Dentofacial Orthop 2013; 144: 705-714.
13. Almeida RC, Cevidanes LHS, Carvalho FAR, Motta AT, Almeida MAO, Styner M. Soft tissue response to mandibular advancement using 3D CBCT scanning. Int J Oral Maxillofac Surg 2011; 40: 353Ð359.
15. Nguyen T, Cevidanes L, Paniagua B, Zhu H, Koerich L, De Clerck H. Use of shape correspondence analysis to quantify skeletal changes associated with bone-anchored Class III correction. Angle Orthod 2014; 84: 329-336.
16. Paniagua B, Cevidanes L, Zhu H, Styner M. Outcome quantification using SPHARM-PDM toolbox in orthognathic surgery. Int J Comput Assist Radiol Surg 2011; 6: 617-626.
17. Franco AA, Cevidanes LH, Phillips C, Rossouw PE, Turvey TA, Carvalho Fde A, Paula LK, Quint‹o CC, Almeida MA. Long-term 3-dimensional stability of mandibular advancement surgery. J Oral Maxillofac Surg 2013; 71: 1588-1597.
18. Heymann GC, Cevidanes L, Cornelis M, De Clerck HJ, Tulloch JF. Three-dimensional analysis of maxillary protraction with intermaxillary elastics to miniplates Am J Orthod Dentofacial Orthop 2010: 137: 274-284.
19. Shafi MI, Ayoub A, Ju X, Khambay B. The accuracy of three-dimensional prediction planning for the surgical correction of facial deformities using Maxilim. Int J Oral Maxillofac Surg 2013: 42: 801-806.
Table 1 Absolute mean difference (100% and 90th percentiles), standard deviation and RMS distances between the actual
simulated uni-directional surgical movement of the maxilla and the 3D surface.!
Surgical movement (mm) 100% of points 90th percentile RMS
Advancement Downgraft Mean (mm) SD (mm) Mean (mm) SD (mm) (mm)
- 2.1 1.1 0.7 1.0 0.5 1.3
- 3.6 1.8 1.1 1.6 1.0 2.0
- 5.9 2.6 1.8 2.3 1.5 3.2
8.5 3.4 2.3 3.0 2.0 4.1
2.7 - 1.1 0.9 0.9 0.7 1.4
2.9 - 0.8 0.7 0.7 0.5 1.0
3.3 - 1.1 0.9 0.9 0.7 1.4
3.7 - 1.2 0.9 1.0 0.7 1.5
5.6 - 2.0 1.7 1.6 1.3 2.6
5.8 - 1.7 1.5 1.4 1.1 2.2
6.3 - 2.0 1.7 1.6 1.3 2.6
6.6 - 2.1 1.7 1.7 1.3 2.7
8.5 - 2.9 2.5 2.3 1.9 3.8
9.0 - 2.8 2.4 2.2 1.9 3.6
Table 2 Absolute mean difference (100% and 90th percentiles), standard deviation and RMS distances between the actual
simulated bi-directional surgical movement of the maxilla and the 3D surface.
Surgical movement (mm) Vector (mm) 100% of points 90th percentile RMS
Advancement Downgraft Mean (mm) SD (mm) Mean (mm) SD (mm) (mm)
2.7 1.8 3.3 1.2 0.7 1.1 0.6 2.3
5.6 1.8 5.8 1.8 1.1 1.5 1.0 2.1
8.5 1.7 8.7 2.5 1.7 2.1 1.4 2.9
2.9 3.8 4.7 3.1 2.2 2.7 1.8 3.8
5.8 4.0 7.1 1.9 1.4 1.6 1.0 2.3
9.0 3.7 9.8 2.2 1.5 1.8 1.2 2.6
3.3 6.0 6.8 2.6 1.8 2.3 1.5 3.2
6.3 6.0 8.7 3.2 2.2 2.7 1.8 3.8
9.3 6.1 10.8 2.8 2.3 2.4 1.7 3.6
3.7 7.9 8.9 3.0 2.2 2.4 1.7 3.6
6.6 7.7 10.2 3.2 2.3 2.7 1.8 3.9
Table 3 Absolute mean difference (100% and 90th percentiles), standard deviation and RMS distances between the actual
simulated surgical advancement of the mandible and the 3D surface mesh.
!
Surgical movement (mm) 100% of points 90th percentile RMS
Advancement Mean (mm) SD (mm) Mean (mm) SD (mm) (mm)
3.6 1.6 0.9 1.4 0.8 1.9
5.5 2.3 1.4 2.0 1.2 2.7
7.3 2.9 1.9 2.5 1.6 3.5