Theme 2
ISSN 1011·0844
Economy and finance
Series B
Short-term trends
eurostat
ECU-EMS INFORMATION
7
D
1987
Monthly
LIBRARY
Summa.ry
The Statistical Office of the European Communities is providing in ECU-EMS INFORMATION
important data on the European Monetary System (EMS) and private uses of the ECU.
It includes:
I. A graph of the bilateral fluctuations of the EMS currencies.
II. Yearly and monthly ECU-denominated bond issues amounts
.
Ill. ECU-denominated bond issues and their yields, together with interest rates for
ECU deposits.
[3?Lj
eurostat
OFICINA ESTADiSTICA DE LAS COMUNIDADES EUROPEAS
DE EUROPA:ISKE FA:LLESSKABERS STATISTISKE KONTOR
STATISTISCHES AMT DER EUROPAISCHEN GEMEINSCHAFTEN
HATIHIKH YnHPEl:IA TON EYPOnAiKON KOINOTHTON
STATISTICAL OFFICE OF THE EUROPEAN COMMUNITIES
OFFICE STATISTIQUE DES COMMUNAUTES EUROPEENNES
ISTITUTO STATISTICO DELLE COMUNITA EUROPEE
BUREAU VOOR DE STATISTIEK DER EUROPESE GEMEENSCHAPPEN
srnv1c;o DE ESTATiSTICA DAS COMUNIDADES EUROPEIAS
L-2920 Luxembourg - Tel. 43011 - Telex
:
Comeur Lu 3423
B-1049 Bruxelles, batiment Berlaymont, rue de la Loi 200 (bureau de liaison) - Tel. 2351111
Note
For any information on the statistics in this bulletin contact Luxembourg:
Te I • 4 3 0
1 -
2 0 2 2 D. GLATZEL
4 3 0 1 - 3 4 1 7
L. CORNELOUP
4301-3519 T. PAPASPYROU
4301-3375 M.THIERRY
c
ECSC-EEC-EAEC,
Brussels - Luxembourg, 1987
Reproduction is authorized, except for commercial purposes, provided the source is acknowledged.
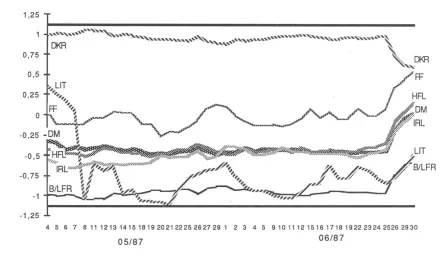
TABLE
I
BILATERAL FLUCTUATIONS OF THE EMS CURRENCIES
1,25
0,75
0,5
0,25
0
-0,25
-OM
-0,5
-0,75
-1
-1,25
4 5 6 7 811121314151819202122252627291 2 3 4 5 9101112151617181922232425262930
05/87
06/87
How to read the graph
1.The various curves should be compared in pairs. To find the differential between two currencies, subtract
the (positive or negative} values along the y-axis corresponding to each currency.
2. The graph is drawn with the curve of the strongest currency above that of the weakest. It shows therefore
the relative position of each currency vis-a-vis the other currencies.
3.
When two curves intersect or merge over a period of time there is no differential between the two
currencies and their market exchange rate equals their bilateral central rate.
Construction of the graph
•
1. The graph is drawn within a horizontal band corresponding to the maximum 2,25% margin of fluctuation
applying at any given moment to market exchange rates and the bilateral central rates of the EMS currencies,
with the exception of the LIT, which has a maximum authorized fluctuation of 6%.
This band is divided symetrically by a horizontal axis along which the points would be plotted if all currencies
were at their bilateral central rate and there were therefore no fluctuations.
2. The daily market exchange rates of all currencies are compared with the relevant bilateral central rates
and the differentials between the two calculated.
3. The maximum fluctuation between two currencies (with the exeption of the LIT) is shown within the band
,
symmetrical with the horizontal axis. The fluctuations of the other currencies in relation to either of the two
currencies in question are shown within the maximum permissible fluctuation.
[image:3.612.72.520.115.371.2]1 981 1982 1983 1984 1985 1986 1986 June July August September October November December 1987 January February March April May June 1982 1983 1984 1985 1986 1986 June July August September October November December 1987 January February March April May June TOTAL 232 1892 2515 4997 "12295 8543 610 550 504 50 216 275 400 995 1423 1015 1545 385 690
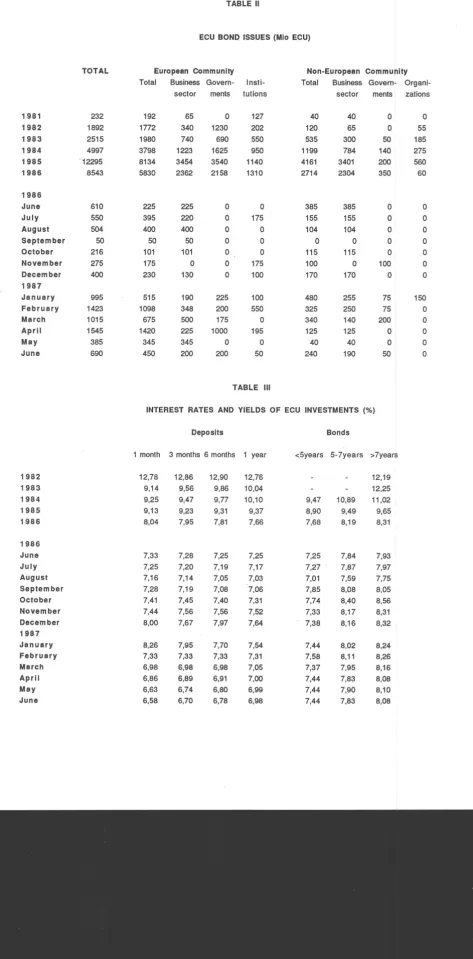
TABLE II
ECU BOND ISSUES (Mio ECU)
European Community Total Business Govern-
lnsti-192 1772 1980 3798 8134 5830 225 395 400 50 101 175 230 515 1098 675 1420 345 450
sector ments tutions
65 340 740 1223 3454 2362 225 220 400 50 101 0 130 190 348 500 225 345 200 0 1230 690 1625 3540 2158 225 200 175 1000 0 200 127 202 550 950 1140 1310 0 175 0
0
0 175 100 100 550 0 195 0 50TABLE Ill
Non-European Community Total Business Govern-
Organi-40 120 535 1199 4161 2714 385 155 104
0
115 100 170 480 325 340 125 40 240sector ments zations
40 65 300 784 3401 2304 385 155 104
0
115 0 170 255 250 140 125 40 190 0 0 50 140 200 3500
0
00
0
100 0 75 75 200 0 0 500
55 185 275 560 60 150 0 0 0 0 0INTEREST RATES AND YIELDS OF ECU INVESTMENTS {%)
Deposits
1 month 3 months 6 months 1 year
12,78 9,14 9,25 9,13 8,04 7,33 7,25 7,16 7,28 7,41 7,44 8,00 8,26 7,33 6,98 6,86 6,63 6,58 12,86 9,56 9,47 9,23 7,95 7,28 7,20 7,14 7,19 7,45 7,56 7,67 7,95 7,33 6,98 6,89 6,74 6,70 12,90 9,86 9,77 9,31 7,81 7,25 7,19 7,05 7,08 7,40 7,56 7,97 7,70 7,33 6,98 6,91 6,80 6,78 12,76 10,04 10,10 9,37 7,66 7,25 7,17 7,03 ·7,06 7,31 7,52 7,64 7,54 7,31 7,05 7,00 6,99 6,98 Bonds
<5years 5- 7years >7years
9,47 8,90 7,68 10,89 9,49 8,19
7,25 7,84 7,27 . 7,87 7,01 7,59 7,85 8,08 7,74 8,40 7,33 8,17 7,38 8,16
[image:4.614.77.550.50.1008.2]TABLE IV
ECU BONDS ISSUES
Issue Borrower Issued Issue Coupon Term Maturity Yields Lead Listing Notice
Payment (country) (Mio ECU) price (years) % (1) (2)
Date
01/06/87 Japan Highway 120 100,125 7,375 7 06107 /94 7,17 Bank of Tokyo L.X Swap Yen 06107187 Japan
03/06/87 Kemira Oy 100 101 8 5 30/06/92 7,75 Kansallis Bk L.X
30/06/87 Japan
04106187 SEK 40 101,75 7,375 5 29/07/92 6,78 Nikko Securities L.X Swap
29/07/87 Suecte
09/06/87 SEK 50 101,625 7,50 7 15/06/94 7,19 Daiwa Europe L.X Swap
30/06/87 Suecte
12/06/87 Kansallis Intl. Bk 100 6 23/07/93 Kansallis Bk L.X
23/07/87 Luxembourg
12/06/87 Wacoal Corp. 80 100 1,5 5 07/07/92 Yamaichi Intl. L.X
07107187 Japan
18/06/87 World Bank 150 100,5 7,5 7 21/07/94 7,22 Morgan Guaranty L.X Swap OM
21/07/87 Org. lnt.
24/06/87 Solvay Fi. 50 100 7,375 8 10/07/98 7,375 K8l L.X Swap FB
10/07/87 Belgique
1) LX = Luxerrbourg, Ml = Milan, LY= Lyon
[image:5.614.45.544.89.1008.2]B
DK D ELL E F IRL I L NL p UKEUR 12
EMS
B
DK D ELLE
F IRL I L NL p UKEUR 12 EMS
EUR 12
EMS
EUR 12 EMS
1960 1970
36,5 4~.1
22,0 39,2
46,7 61,0
21,4 26,3 13,4 24,1
26,6 39,9
17,5 27,8
18,4 27,1
40,8 52,6
32,3 48,9
11,7 18,2
18,6 27,7
27,0 39,0
32,4 44, 7
61-70 71-80
3,0 6,0 2,7 2,1 6,1 4,1 4,8 4,0 2,6 4,2 4,5 4,1 3,7 3,3 0,8 1,0 1,7 1,2 7,4 9,8 5,1 14,5 15,4 9,7 13,7 14,1 6,7 7,4 18,7 13,8 9,9 8,4 3,5 4,0 4,8 3,3
TABLE V
CONSUMER PRICE INDICES IN NATIONAL CURRENCY
1980:100
1981 1982 1983 1984 1985 1986
107,6 117,0 126,0 134,0 140,5 142,3 111,7 123,0 131,5 139,8 146,4 151,7
106,3 111,9 115,6 118,4 121,0 120,7
124,5 150,5 181,4 214,6 256,3 315,5 114,6 131,1 147,0 163,5 178,0 193,6
113,4 126,8 139,0 149,2 158,0 162,2
120,4 141,1 155,8 169,2 178,4 185,2
117,8 137,2 157,3 174,3 190,3 201,4
108,1 118,2 128,4 136,7 142,3 142,7
106,7 112,8 115,9 119,6 122,3 122,7 120,0 147,3 184,3 237,5 284,1 317,6
111,9 121,5 127,1 133,4 141,5 146,3
112,1 124,2 134,8 144,8 153,7 159,2
111,4 123,0 133,3 142,2 149,9 153,9
1986 1987
11 12 01 02 03 04 05
142,6 142,7 143,3 143,6 143,7 144,4 144,4
154,4 154,3 154,6 154,5 155,9 156,5 156,5 119,9 120,1 120,6 120,7 120,7 121,0 121,1
334,9 337,8 341,5 342,7 353,6 361,6 363,8
197,6 198,5 199,9 200, 7 201,9 202,4 202,2
163,5 163,7 165,2 165,5 165,7 166,6 166,9
186,1 186,2 187,3 188,5 189,6 190,0 190,7
204,4 205,8 206,3 207,4 208,0 208,6 209,4
142,5 142,4 142,6 142,8 142,8 142,4 142,3
123,3 123,0 121,3 121,6 121,9 122,1 122,4
325,5 331,1 335,1 338,5 343,2 345,0 345,3
148,5 149,0 149,6 150,2 150,5 152,3 152,4
160,7 161,1 161,9 162,4 162,8 163,7 164,0
154,9 155,1 156,0 156,3 156,7 157,2 157,5
Annual rate of increase (%)
1981 1982 1983 1984 1985 1986 1986
12
7,6 8,7 11,7 10,1
6,3 5,3
24,5 20,9
14,6 14,4 13,4 11,8
20,4 17,2
17,8 16,5
8,1 9,3 6,7 5,7
20,0 22,7
11,9 8,6
12, 1 10,8 11,4 10,4
3,7 3,9
4,4 4,0
5,8 5,5 5,1 5,2
7,7 6,3 6,9 6,3
3,3 2,4
20,5 18,3
12, 1 11,2 9,6 7,3
10,4 8,6
14,7 10,8
8,6 6,5 2,7 3,2
25,1 28,9 4,6 5,0
8,5 7,4 8,4 6,7
4,9 4,7 2,2 19,4 8,9 5,9 5,4 9,2 4,1 2,3 19,6 6,1 6,1 5,4 1,3 3,6 -0,2 23,1 8,8 2,7 3,8 5,8 0,3 0,3 11,8 3,4 3,6 2,7 11
0,6 0,6
4,3 4,3
-1,2 -1, 1
19,8 17,0 8,3 8,4
2,1 2, 1
3,1 3,2
4,4 4,2
-1,2 -1,5 0,0 0,1
10,6 10,6 3,5 3,7
2,9 2,9 1,8 1,8
Average mean deviation around the mean
4,2 3,9 5,8 5,7 3,3 2,8 2,4 2,3 2,7 2,0 2,6 1,9 2,6 1,8
Average deviation vis-a-vis the minimum
B DK D ELL E F IRL I L NL
p
UKEUR 12
EMS ECU B DK D ELL E F IRL I L NL p UK
EUR 12
EMS ECU
1960 1970
26,9 23,6 26,5 44,6 23,5 29,9 17,4 33,2 31,4 22,2 29,9 29,5 28,9 28,4 29,1 39,2 40,0 41, 1 50,9 33,7 41,0 27,5 50,4 41,8 36,5 43,0 38,9 41,5 42,5 42, 1
61-70 71-80
3,8 5,4 4,5 1,3 3,7 3,3 4,7 4,3 2,9 5,1 3,7 2,8 3,7 4,1 3,8 9,8 9,6 9,3 7,0 11,5 9,3 13,8 7,1 9,1 10,6 8,8 9,9 9,2 8,9 9,0
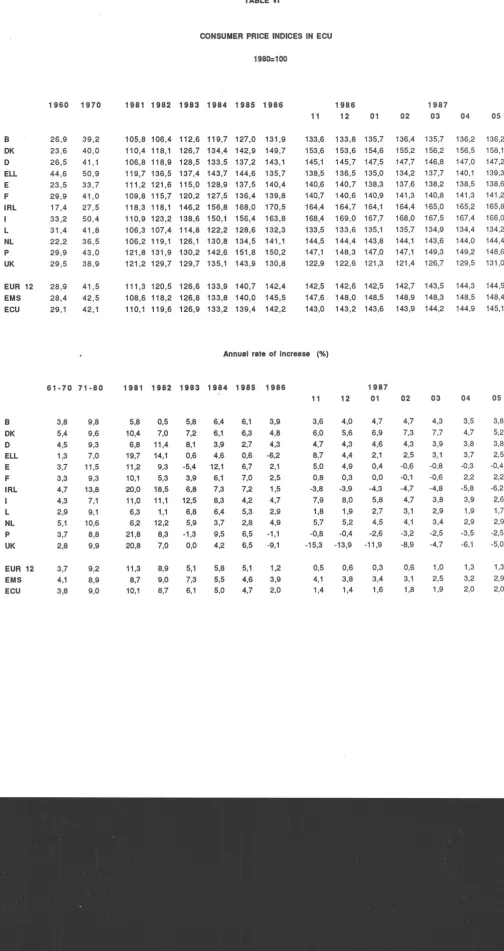
TABLE VI
CONSUMER PRICE INDICES IN ECU
1980:100
1981 1982 1983 1984 1985 1986
105,8 106,4 112,6 119,7 127,0 131,9 110,4 118,1 126,7 134,4 142,9 149,7 106,8 118,9 128,5 133,5 137,2 143,1 119,7 136,5 137,4 143,7 144,6 135,7 111,2 121,6 115,0 128,9 137,5 140,4 109,8 115,7 120,2 127,5 136,4 139,8 118,3 118,1 146,2 156,8 168,0 170,5 110,9 123,2 138,6 150,1 156,4 163,8 106,3 107,4 114,8 122,2 128,6 132,3 106,2 119,1 126,1 130,8 134,5 141,1 121,8 131,9 130,2 142,6 151,8 150,2 121,2 129,7 129,7 135,1 143,9 130,8
111,3 120,5 126,6 133,9 140,7 142,4 108,6 118,2 126,8 133,8 140,0 145,5 110,1 119,6 126,9 133,2 139,4 142,2
11 133,6 153,6 145,1 138,5 140,6 140,7 164,4 168,4 133,5 144,5 147,1 122,9 142,5 147,6 143,0 1986 12 01
133,8 135,7 153,6 154,6 145,7 147,5 136,5 135,0 140,7 138,3 140,6 140,9 164,7 164,1 169,0 167,7 133,6 135,1 144,4 143,8 148,3 147,0 122,6 121,3
142,6 142,5 148,0 148,5 143,2 143,6
Annual rate of Increase (%)
1981 1982 1983 1984 1985 1986
5,8 0,5 5,8 6,4 6,1 3,9 10,4 7,0 7,2 6,1 6,3 4,8 6,8 11,4 ~.1 3,9 2,7 4,3 19,7 14,1 0,6 4,6 0,6 -6,2 11,2 9,3 -5,4 12, 1 6,7 2,1 10,1 5,3 3,9 6,1 7,0 2,5 20,0 18,5 6,8 7,3 7,2 1,5 11,0 11,1 12,5 8,3 4,2 4,7 6,3 1,1 6,8 6,4 5,3 2,9 6,2 12,2 5,9 3,7 2,8 4,9 21,8 8,3 -1,3 9,5 6,5 -1,1 20,8 7,0 0,0 4,2 6,5 -9,1
11,3 8,9 5, 1 5,8 5,1 1,2 8,7 9,0 7,3 5,5 4,6 3,9 10,1 8,7 6,1 5,0 4,7 2,0
11 12
1987 01
3,6 4,0 4,7 6,0 5,6 6,9 4,7 4,3 4,6 8,7 4,4 2,1 5,0 4,9 0,4 0,8 0,3 0,0 -3,8 -3,9 -4,3 7,9 8,0 5,8 1,8 1,9 2,7 5,7 5,2 4,5 -0,8 -0,4 -2,6 -15,3 -13,9 -11,9
0,5 0,6 0,3 4,1 3,8 3,4 1,4 1,4 1,6
02
1987 03
136,4 135,7 155,2 156,2 147,7 146,8 134,2 137,7 137,6 138,2
141,3 140,8
164,4 165,0 168,0 167,5 135,7 134,9 144, 1 143,6 147,1 149,3 121,4 126,7
142,7 143,5 148,9 148,3 143,9 144,2
02 03
4,7 4,3 7,3 7,7 4,3 3,9 2,5 3,1 -0,6 -0,8 -0, 1 -0,6
-4,7 -4,8
4,7 3,8 3,1 2,9 4,1 3,4 -3,2 -2,5 -8,9 -4,7
0,6 1,0 3,1 2,5 1,8 1,9
04 136,2 156,5 147,0 140,1 138,5 141,3 165,2 167,4 134,4 144,0 149,2 129,5 144,3 148,5 144,9 04 05 136,2 158,1 147,2 139,3 138,6 141,2 165,8 166,0 134,2 144,4 148,6 131,0 144,5 148,4 145,1 05
3,5 3,8 4,7 5,2 3,8 3,8 3,7 2,5 -0,3 -0,4 2,2 2,2 -5,8 -6,2 3,9 2,6 1,9 1,7
2,9 2,9
-3,5 -2,5
-6, 1 -5,0
[image:7.614.53.557.57.1008.2]TABLE VII
ECU EXCHANGE RATES
B/LFR DM HFL DKR FF LIT IRL UKL ORA PTA ESC USO YEN
Yearly averages
1979 40,1651 2,51087 2,74864 7,209115,829451138,50 0,669482 0,646392 50,774 91,967 67,042 1,370650 300,470
1980 40,5979 2,52421 2,76027 7,82736 5,86895 1189,21 0,675997 0,598488 59,323 99,702 69,552 1,392330 315,044
1981 41,2946 2,51390 2,77510 7,92255 6,03992 1263,18 0,691021 0,553110 61,624 102,676 68,495 1,116450 245,379
1982 44,7115 2,37599 2,61390 8,15687 6,43117 1323,78 0,689605 0,560454 65,342 107,558 78,007 0,979710 243,545
1983 45,4380 2,27052 2,53720 8,13188 6,77078 1349,92 0,714956 0,587014 78,088 127,503 98,689 0,890220 211,354
1984 45,4420 2,23811 2,52334 8, 14647 6,87165 1381,38 0,725942 0,590626 88,340 126,569 115,680 0,789030 187,089
1985 44,9136 2,22632 2,51101 8,01876 6,79502 1447,99 0,715167 0,588977 105,739 129, 165 130,252 0,763090 180,559
1986 43,7978 2,12819 2,40089 7,93565 6,79976 1461,87 0,733526 0,671542 137,425 137,456 147,088 0,984170 164,997
Monthly averages
86/06 43,9112 2,14931 2,41988 7,96342 6,85191 1475,09 0,709147 0,637969 135,326 137,410 145,208 0,961605 161,255
86/07 43,8846 2,13200 2,40224 7,97443 6,86300 1463,76 0,712087 0,656263 137,054 136,177 146,961 0,990211 157,062
86/08 43,6119 2,10636 2,37466 7,92728 6,86613 1450,48 0,758357 0,687097 137,706 136,982 149,209 1,021360 157,382
86/09 43,4491 2,09737 2,36785 7,93172 6,86813 1447,98 0,763423 0,698414 138,947 137,713 150,779 1,028050 158,997
86I1 0 43,2507 2,08328 2,35439 7,84956 6,81955 1441,57 0,764589 0,728993 140,735 138,594 152,837 1 ,040260 162,464
86/11 43,3336 2,08543 2,35617 7,86692 6,81993 1443,34 0,765296 0,723324 143,294 140,126 153,845 1,029360 167,701
86/12 43,2848 2,08046 2,35137 7,86392 6,83173 1443,16 0,764489 0,727245 146,629 140,625 155,210 1,044540 169,534
87/01 42,8703 2,06451 2,32873 7,82974 6,88127 1462,93 0,772101 0,737941149,845143,981158,4731,111970 171,862
87/02 42,7250 2,06346 2,32935 7,79110 6,87287 1467,89 0,775082 0,740242 151,337 145,359 159,973 1,129880 173,416
87/03 42,9877 2,07549 2,34399 7,81191 6,90747 1476,28 0,776933 0,710924 152,166 145,667 159,862 1,131730 171,332
87/04 43,0457 2,07747 2,34389 7,83099 6,91869 1482,08 0,777423 0,703822 152,918 145,614 160,708 1,147090 163,882
87/05 43,0613 2,07652 2,34023 7,81162 6,93947 1499,70 0,776215 0,696103 154,762 145,378 161,544 1,162410 163,140
87/06 43,0146 2,07477 2,33711 7,81273 6,92874 1501,44 0,774584 0,700039 155,393 144,062 161,936 1,140930 164,875
Daily rates: June
01/06 43,0283 2,07731 2,34138 7,81989 6,92889 1499,15 0,774953 0,697124 154,882 144,597 161,964 1,131430 164,793
02/06 43,0247 2,07607 2,33969 7,81099 6,93186 1500,75 0,774533 0,697931 154,974 144,616 161,821 1,143210 165,080
03/06 42,9979 2,07429 2,33737 7,80907 6,93347 1501,96 0,774296 0,699835 155,181144,534161,724 1,149830 164,023
04/06 42,9724 2,07350 2,33606 7,80019 6,93109 1501,51 0,774270 0,701935 155,113 144,526 161,657 1,142050 164,512
0 5106 42,9857 2,07339 2,33686 7 ,80329 6,93326 1502,06 0,774524 0,701053 15 '161 144,565 161,805 1'145520 164,096
09/06 43,0159 2,07427 2,33708 7,80450 6,93541 1503,60 0,774611 0,698862 15 ,432 144,444 162,161 1,154170 164,527
10/06 43,0197 2,07447 2,33732 7 ,80308 6,93717 1503,88 0,774087 0,698237 15 ,597 144,783 162,090 1, 161520 164,761
11/06 43,0328 2,07491 2,33874 7,80566 6,93759 1504,50 0,774713 0,696869 15 ,847 144,774 162,495 1,158200 164,985
12/06 43,0707 2,07677 2,33916 7,81009 6,93795 1504,47 0,775286 0,694585 15 ,290 144,358 162,078 1,154400 165,195
15/06 43,0589 2,07680 2,33970 7,80963 6,92836 1502,66 0,775346 0,696602 15 ,327 144,488 161,851 1,138600 164,584
16/06 43,0535 2,07685 2,33955 7,81143 6,93634 1502,48 0,775375 0,695449 15 ,430 144,348 161,907 1,140190 164,244
17/06 43,0629 2,07751 2,34032 7,81621 6,93412 1499,95 0,775710 0,695620 15 ,416 144,063 161,773 1,135250 164,384
18/06 43,0352 2,07617 2,33959 7,81096 6,93574 1501,32 0,7752710,69677215 ,490 144,011 161,834 1,138870 164,510
19/06 43,0117 2,07509 2,33766 7,80431 6,93023 1500,13 0,774861 0,700075 15 ,019 143,713 161,762 1,135170 164,430
22/06 42,9993 2,07452 2,33707 7,80306 6,92092 1497,83 0,774921 0,703093 15 ,259 143,369 161,791 1,130220 164,560
23/06 42,9635 2,07268 2,33409 7,79608 6,92058 1497,19 0,773876 0,706435 15 ,707 143,324 161,803 1,126760 164,958
24/06 43,0072 2,07443 2,33581 7,80158 6,92614 1499,87 0,774434 0,701861 15 ,713 143,384 161,940 1,138420 164,843
25/06 43,0003 2,07382 2,33449 7,80092 6,92067 1500,74 0,774036 0,703472 155,587 143,155 161,815 1,134350 165,615
2 6/ 0 6 42,9946 2,07330 2,33337 7,83562 6,91612 1502,87 0,774078 0,703555 155,653 143,374 161,594 1, 135190 165,907
29/06 42,9605 2,07110 2,33165 7,84809 6,91199 1501,62 0,773318 0,707427 155,557 143,249 162,288 1,133300 165,858
EXPLANATORY NOTES
ECU exchange rates.
The exchange rates for the ECU against the national currencies of the Member States of the Community, the
United States (USO) and Japan (YEN) are shown as monthly averages and daily rates for the latest available
month.
The ECU basket, dating from 17 September 1984, is currently made up as follows:
DM FF lfL
BFR
LFR LIT Dl<R IRL UKL.a) DRAa)1ECU= 0,719 + 1,31 + 0,256 + 3,71 + 0,14 + 140 + 0,219 + 0,00871+ 0,0878 + 1, 15
Ecu central rates since 12 January 1987
DM FF lfL BILFR LIT DKR IRL UKL.a) DRAa) 2,05853 6,90403 2,31943 42,4582 1483,58 7,85212 0,768411 0,739615 150,792
Weights of currencies in the ECU basket (based on new central rates from 12 January 1987), in
% .
DM FF lfL BFR + LFR LIT Dl<R IRL UKL.a) DRAa) 100= 34,93 18,97 11,04 9,07 9,44 2,79 1,13 11,87 0,76
a) Does not participate in the exchange mechanism
Consumer price indices in national currency
The consumer price indices in the national currency of each country measure changes in the purchasing power of
one unit of national currency spent in the country concerned.
Two composite indices are calculated, covering all the Member States of the Community (EUR 12) and the eight
Member States with currencies participating in the European Monetary System exchange rate mechanism (EMS).
These indices are calculated as weighted arithmetic means (chain indices) of the national indices, the weighting
for each Member State being its relative share in the final consumption of households of the group of countries in
question (EUR 12, EMS), expressed in purchasing power standards, at current prices and purchasing power
parities.
At the foot of the table, the average weighted fluctuations around the mean and the minimum are given for the
same groups of countries, with the same weightings. (These are calculated as weighted averages of the absolute
fluctuations in relation to the mean and the minimum respectively). They show the dept to which price movements
in the Member States in this Community converge.
Consumer price indices in ECU
For each country the index of consumer prices in ECU is calculated by dividing the national consumer price index
by the average movement of the national currency in relation to the ECU during the month. It measures the change
in the purchasing power of one ECU in the country concerned.
Three composite indices are calculated, covering all the Member States of the Community (EUR 12), the eight
Member States participating in the European Monetary System exchange rate mechanism (EMS)
·
and the ten
Member States whose currencies go to make up the ECU (ECU). These indices are calculated as weighted
arithmetic means (chain indices) of the consumer price indices expressed in ECU as mentioned above.
ECU bond issues
All ECU-denominated bond issues, both national and international, are covered, together with ECU issues
offering the option of conversion into other currencies.
Main source: International Financing Review
Table II shows, under the headings:
-Business sector and Governments: national issuers, both private and public.
-Institutions: the European Investment Bank and the Commission of the European Communities (EEC, ECSC,
Euratom).
-Organizations: the specialist institutions of the United Nations, the World Bank, the Council of Europe, etc ...
The issues are recorded as at the payment date.
Interest rates and yields on ECU investments
The interest rates for 1 , 3 and 6 month and 1 year deposits are calculated on the basis of the Friday London
market rates (source: Financial Times).
The bonds are classified according to three types of term: under 5 years, from 5 to 7 years and more than 7
years.
The redemption yields of ECU bonds are calculated each Wednesday from a sample of fixed interest bonds,
denominated in ECU and listed on the Luxemburg Stock Exchange (source: Luxemburg Stock Exchange).
Venta
y
suscripciones • Salg og abonnement • Verkauf und Abonnement •
nwMat1c;
Kai
auvl>poµtc;
Sales and subscriptions • Vente et abonnements • Vendita e abbonamenti
Verkoop en abonnementen • Venda e assinaturas
BELGIQUE
I
BELGIEMoniteur beige
I
Belgisch StaatsbladRue de Louvain 4042/leuvensestraat 4M2 1000Bruxelles/1000 Brussel
Tel. 512 00 26
CCP / Postrekening 000-2005502-27
Sous-depots/ Agentschappen:
Librairie europeenne
I
Europese Boekhandel
Rue de la Loi 244/Wetstraat 244 1040Bruxelles/1040 Brussel
CREDOC
Rue de la Montagne 34/Bergstraat 34
Bte 11
I
Bus 111000Bruxelles/1000 Brussel
DAN MARK
Schultz EF-publikationer M0ntergade 19
1116 K0benhavn K Tlf: (01) 14 11 95 T elecopier: (01) 32 75 11
BR DEUTSCHLAND
Bundesanzeiger Verlag Breite StraBe
Postf ach 10 80 06 5000 Koln 1 Tel. (02 21) 20 29-0
Fernschreiber: ANZEIGER BONN 8 882 595
T elecopierer: 20 29 278
GREECE
G.C. Eleftheroudakis SA International Bookstore 4 Nikis Street
105 63 Athens Tel. 322 22 55 Telex 219410 ELEF
Sub-agent for Northern Greece:
Molho's Bookstore The Business Bookshop 10 Tsimiski Street Thessaloniki Tel. 275 271 Telex 412885 LIMO
ESPANA
FRANCE
Journal official
Service des publications des Communautes europltennes 26. rue Desaix
75727 Paris Cedex 15 Tel. (1) 45 78 61 39
IRELAND
Government Publications Sales Office Sun Alliance House
Molesworth Street Dublin 2
Tel. 710309
or by post
Government Stationery Office Publications Section
6th floor Bishop Street Dublin 8 Tel. 78 16 66
ITALIA
Licosa Spa Via Lamarmora. 45 Casella postale 552 50 121 Firenze Tel. 57 97 51
Telex 570466 LICOSA I CCP 343 509
Subagenti:
Libreria scientifica Lucio de Biasio - AEIOU Via Meravigli, 16
20 123 Milano Tel. 80 76 79
Libreria Tassi
Via
A.
Farnese, 2800 192 Roma Tel. 310590
Libreria giuridica Via 12 Ottobre, 172/R 16 121 Genova Tel. 59 56 93
GRAND-DUCHE DE LUXEMBOURG et autres pays/ and other countries
Office des publications omcielles des Communautes europeennes 2, rue Mercier
L-2985 Luxembourg
NEDERLAND
Staatsdrukkerij- en uitgeverijbedrijf Christoffel Plantijnstraat
Postbus 20014 2500 EA · s-Gravenhage
Tel. (070) 78 98 80 (bestellingen)
PORTUGAL
lmprensa Nacional Casa da Moeda, E. P.
Rua D. Francisco Manuel de Melo. 5 1092 Lisboa Codex
Tel. 69 34 14 Telex 15328 INCM
Distribuidora Livros Bertrand Lda. Grupo Bertrand, SARL
Rua das Terras dos Vales. 4-A
Apart. 37
2700 Amadora CODEX
T~.4939050-4948788
Telex 15798 BERDIS
UNITED KINGDOM
HM Stationery Office HMSO Publications Centre 51 Nine Elms Lane London SW8 5DR Tel. (01) 2115656
Sub-agent:
Alan Armstrong & Associates Ltd
72 Park Road London NW 1 4SH Tel. (01) 723 39 02 Telex 297635 AAAL TD G
UNITED STATES OF AMERICA
European Community Information Service
2100 M Street, NW Suite 707
Washington, DC 20037
Tel. (202) 862 9500
CANADA
Renouf Publishing Co., Ltd 61 Sparks Street
Ottawa
Ontario K 1 P 5R 1
Price (excluding VAT) in Luxembourg
ECU
BFR
IRL
~ .. : •) ~
:;
.
...
Single copy
4
.
;
".)17-5
:
:
·-
;
1\
-~
3.20
Subscription
25
.
70
OFICINA DE PUBLICACIONES OFICIALES DE LAS COMUNIDADES EUROPEAS KONTORET FOR DE EUROPA:ISKE FA:LLESSKABERS OFFICIELLE PUBLIKATIONER
20
AMT FUR AMTLICHE VEROFFENTLICHUNGEN DER EUROPAISCHEN GEMEINSCHAFTEN YnHPEI:IA EnlI:HMON EKllOI:EON TON EYPOnA'iKON KOINOTHTON
OFFICE FOR OFFICIAL PUBLICATIONS OF THE EUROPEAN COMMUNITIES OFFICE DES PUBLICATIONS OFFICIELLES DES COMMUNAUTES EUROPEENNES UFFICIO DELLE PUBBLICAZIONI UFFICIALI DELLE COMUNITA EUROPEE BUREAU VOOR OFFICIELE PUBLIKATIES DER EUROPESE GEMEENSCHAPPEN SERvu;:o DAS PUBLICAc;:OES OFICIAIS DAS COMUNIDADES EUROPEIAS
L - 2985 Luxembourg
UKL
3
19
USO
4.60
29
ISSN 1011-0844