Statistical Analysis of Player Behavior in Minecraft
Stephan Müller
∗ ETH ZürichMubbasir Kapadia
Disney Research Zürich andRutgers University
Seth Frey
Disney Research ZürichSeverin Klingler
ETH Zürich
Richard P. Mann
ETH ZürichBarbara Solenthaler
ETH ZürichRobert W. Sumner
Disney Research Zürich andETH Zürich
Markus Gross
Disney Research Zürich andETH Zürich
ABSTRACT
Interactive Virtual Worlds offer new individual and social experiences in a huge variety of artificial realities. They also have enormous potential for the study of how people inter-act, and how societies function and evolve. Systematic col-lection and analysis of in-play behavioral data will be invalu-able for enhancing player experiences, facilitating effective administration, and unlocking the scientific potential of on-line societies. This paper details the development of a frame-work to collect player data in Minecraft. We present a com-plete solution which can be deployed on Minecraft servers to send collected data to a centralized server for visualization and analysis by researchers, players, and server administra-tors. Using the framework, we collected and analyzed over 14 person-days of active gameplay. We built a classification tool to identify high-level player behaviors from observations of their moment-by-moment game actions. Heat map visual-izations highlighting spatial behavior can be used by players and server administrators to evaluate game experiences. Our data collection and analysis framework offers the opportu-nity to understand how individual behavior, environmental factors, and social systems interact through large-scale ob-servational studies of virtual worlds.
Categories and Subject Descriptors
I.3.7 [Computer Graphics]: Virtual Reality; I.2.1 [Artificial Intelligence]: Applications and Expert Systems—Games
Keywords
Virtual world, game, Minecraft, player data, game analytics, telemetry, online societies
1.
INTRODUCTION
Interactive Virtual Worlds (IVW’s) have a huge potential for scientific research. The new challenges and datasets they offer have earned virtual worlds a large and growing place in game analytics. Their lack of constraints relative to other game types allows for the study of game features that pro-mote creativity, which in turn makes them a natural setting for developing the educational potential of games. Their collaborative nature makes them an excellent domain for extensions of game analytics in social directions. Such so-cial analytics include simple tools for monitoring summary statistics about social networks, player teams, or game chat, up to more ambitious metrics that may ultimately be able to quantify the cohesiveness of a collaborative community. Complementary to monitoring of social activity is the de-velopment of game features or mechanics that can actually promote teamwork and collaboration. Finally, interactive virtual worlds have unique potential to advance the social sciences. Not only do they make experiments cheap and practical, in many cases virtual worlds make society-scale experiments, for the first time in history, possible. Even without experimental control, there is vast potential in the datasets that can be created by passively recording game behavior. Being digital, virtual worlds can provide unprece-dented access to the complete state of a social system — down to the most minute data — at arbitrarily fine-grained resolutions of time. Such data is particularly valuable in the relatively constrained environment of a game, in which we know that players have goals and are motivated to solve them. These features remove much of the stigma of artifi-ciality that afflicts laboratory experiments. While one may argue that digital-game behavior is, by definition, not real-world behavior, scholars like Castronova [5, 7] cast doubt on the existence of a fine line, and emphasize that the value of games can be cast in more orthodox terms, even those of “true” economic value.
Whether from the viewpoint of user experience or computa-tional efficiency, statistical analysis of player behavior is im-portant to the development of large virtual worlds. Within Minecraft user forums, players and administrators often ex-press a desire to create particular types of experiences. Ana-lyzing the types of experiences players actually have in play is the first step in achieving their goals. Furthermore, pre-dicting where players will move within the environment, and
Permission to make digital or hard copies of all or part of this work for personal or classroom use is granted without fee provided that copies are not made or distributed for profit or commercial advantage and that copies bear this notice and the full citation on the first page.
Building Mining Fighting Exploring
Figure 1: Typical player behaviors found in Minecraft
what actions they will perform, may allow for a more effi-cient use of computational resources [13], and enable larger, more interesting worlds.
Minecraft is very well-suited for the collection of social game analytics, and well-position to benefit from them. With well over 50 million sold copies, it has a large user base and a very active community. In its basic form, the game is an open world “sandbox” with no obvious goals. The nature of the game motivates players to explore, mine for resources, and build infrastructure. As soon as multiple people start play-ing on the same server, communities and even economies start to emerge. The game can be modified with custom code that enables players to introduce new game mecha-nisms or craft immersive experiences for others. It is possible to build any kind of virtual world, in-game or programati-cally.
This paper presents a framework for analyzing player be-havior in interactive virtual worlds. We explore different ways of acquiring data, and introduce a suite of Minecraft server plugins that facilitate the collection of high-resolution, high-quality player behavior data. These include: (1) data collection of arbitrary in-game events from any participating server, (2) unobtrusive system to query users for their sub-jective or qualitative impressions, and (3) systems for man-aging virtual worlds to run social experiments. We demon-strate the application of our framework on several use cases, including the classification of player behavior, the extraction of descriptive statistics, and the real-time production of vi-sualizations. Our classifier provides a particularly thorough showcase of the power and flexibility of our framework: it was built on fine-granularity data collected by one plugin, and trained on subjective ground-truth data collected by an-other. This paper makes the following main contributions.
1. An open-source data collection and analysis framework for capturing player behavior in Minecraft
2. Information visualization tools to help serve meaningful information to researchers, players, and server adminis-trators.
3. A validated classifier of player activities into categories based on Bartle’s character theory [3].
As well as providing data for academics in social science, computer science, and education, our tools also have great potential to help players, server administrators, and the communities they constitute. Information about the rela-tive contributions of different players can help in the iden-tification of key community members. Visualizations and
other information about a world can also help administra-tors identify troublesome activity and diagnose problems in their worlds.
1.1
HeapCraft
The framework introduced in this paper is part of the HeapCraft project which aims to explore the scientific potential of Minecraft. More information, tools and source code can be found on
http://heapcraft.net/.
2.
RELATED WORK
As in every facet of digital game research, the major imped-iment to progress in our understanding of interactive virtual worlds is that most datasets are proprietary and held closely by their owners. Consequently, most analyses of game be-havior are probably being conducted in the private sector in service of corporate missions. Unfortunately, their results are usually kept secret. While data is traditionally collected from playtesters in special user experience labs, the recent Destiny Public Beta1has dramatically increased the amount of collected data by allowing anyone to become a playtester. Player data in online games may continue to be analyzed long after a game’s official release [6].
Researchers have shown that virtual worlds give us an un-precedented ability to implement controlled experiments at the scale of whole societies [6, 2]. Virtual labs make it easy to reach large numbers of people across sociocultural boundaries and perform large-scale, long-term experiments. While, most game research is cast in terms of its relevance to games, and less in terms of its relevance to social sci-ence, the fundamental similarities between interactive vir-tual worlds and online social networking sites suggest that the former should be considered at least as valuable as the latter for advancing our understanding of social-scale pro-cesses generally [1, 18, 19, 4, 12, 9]. Economists have used transaction data from online multiplayer games to study trading behavior [8] and have shown the potential appli-cation of virtual worlds to study macro-scale phenomena empirically, even within studies that lack experimental con-trol [7]. Ducheneaut and Yee [11] present player data that they collected with a framework for analyzing World of War-craft. They used client plugins to log data about players, the game publisher (Blizzard Community API), as well as sur-veys. Since online games often attract young players, game research in virtual worlds may be particularly valuable for research about the development of sociality, creativity, and even morality in children. At present, the child-oriented re-search on games that is not focused on education tends to
1
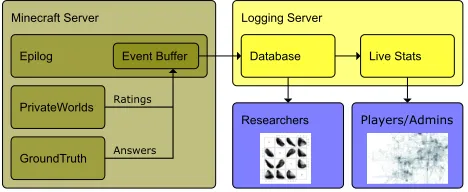
Minecraft Server Logging Server
Epilog Event Buffer
PrivateWorlds
GroundTruth
Database Live Stats
Researchers Players/Admins
Ratings
[image:3.612.57.291.58.154.2]Answers
Figure 2: The framework we used to collect player data. Plugins installed on a Minecraft server collect player events and send them to a logging server. Researchers can ac-cess the raw event data. Players and administrators are able to access prepro-cessed and aggregated live statistics.
focus on the direct effects of a given game or type of game on children [24, 25, 20].
Player modeling [26] is a critical element to providing per-sonalized game experiences, and is a prerequisite towards achieving adaptive gameplay [14]. For example, direct sen-sor measurements may be used to modify the behavior of virtual agents in interactive virtual environments [21]. PaS-SAGE [23] establishes the importance of player modeling in interactive storytelling by introducing player-specific stories using automatically generated events.
3.
FRAMEWORK
Our framework consists of the interacting components illus-trated in Fig. 2. The Epilog plugin records player actions and sends them to a central logging server. The other plu-gins use Epilog to send additional data to our database. Our logging server can collect data from multiple Minecraft servers simultaneously. This is valuable because, unlike other multiplayer online games, Minecraft is predominantly served by players, rather than by its developers. Minecraft admin-istrators opt-in to sending us their data by installing the Epilog plugin on their servers.
While others have pursued client-side data collection op-tions, we chose to pursue a server-side solution. This allows us to collect data from many different players by only hav-ing to collaborate with the server administrator. Logghav-ing all players at once allows us to record all changes made to a virtual world, to compare players’ behaviors within the same environment, and to capture all player interactions. On the other hand, logging by modified clients would make it easier to study individual players across multiple servers. But the available data would be limited to the immediate surroundings of players using the modified clients.
The plugins are written using Bukkit2, an unofficial Minecraft server API whose server, CraftBukkit is popular for its heavy modifiability. As it stands, our software is not compati-ble with the official server binaries, or with other unoffi-cial projects that are not Bukkit-compatible. The Bukkit
2
http://bukkit.org/
project received a DMCA takedown request on September 3rd, 2014. It remains to be seen how this development will influence adoption of the very popular CraftBukkit server relative to other variants.
3.1
The Epilog Plugin
Epilog collects user-generated events and sends them to our logging server every 10 seconds. By default, it records all player-related events provided by the Bukkit API, but addi-tional events can easily be added. In addition to the event name, time, player, server address, and world ID, event-specific attributes like item names and block positions can be added as desired.
We logged an average of about 12 events per second for an active player. Move events were the most frequent; walk-ing generates 20 position updates per second (though some activities generate over 50 events per second).
Plugins are able to detect if the Epilog plugin is installed and can use it to send their own data to our logging server. The PrivateWorlds plugin uses this feature to log when a player rates a map or creates a new instance of a map.
3.2
Ground Truth Plugin
We also created a plugin that sends player messages over the in-game chat system at random intervals. We used the plu-gin to collect subjective “ground truth” data for our player classifier by asking the players what they are doing. i.e., if they are building, exploring, fighting, or mining.
3.3
The PrivateWorlds Plugin
We developed the PrivateWorlds plugin to allow us to run virtual laboratory experiments, or analyze maps played in single-player mode. PrivateWorlds allows players to instan-tiate their own copy of a prepared map. The plugin creates a new player state for each map. Items or abilities can not be transferred between worlds. The result is like having many private servers, or like playing Minecraft maps offline.
The user interface is a combination of console command and virtual in-game buttons. A player can teleport to an auto-matically generated PrivateWorlds “hub” world at any time by typing/pw. Inside the hub the player can choose one of the provided maps by pressing a virtual button. To leave the map,/pwcan be typed again.
In order to collect user feedback, additional rooms can be built inside the hub. On our server, we teleport the player into a room with buttons with which they can rate their experience upon leaving a map. The plugin can easily be extended to allow random assignment to worlds that differ in accordance with experimentally-controlled parameters.
3.4
Public Access to Descriptive Statistics
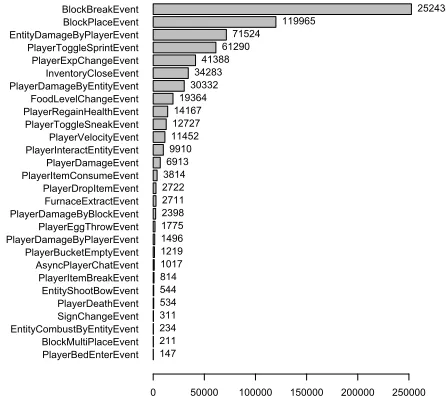
PlayerBedEnterEvent BlockMultiPlaceEvent EntityCombustByEntityEvent SignChangeEvent PlayerDeathEvent EntityShootBowEvent PlayerItemBreakEvent AsyncPlayerChatEvent PlayerBucketEmptyEvent PlayerDamageByPlayerEvent PlayerEggThrowEvent PlayerDamageByBlockEvent FurnaceExtractEvent PlayerDropItemEvent PlayerItemConsumeEvent PlayerDamageEvent PlayerInteractEntityEvent PlayerVelocityEvent PlayerToggleSneakEvent PlayerRegainHealthEvent FoodLevelChangeEvent PlayerDamageByEntityEvent InventoryCloseEvent PlayerExpChangeEvent PlayerToggleSprintEvent EntityDamageByPlayerEvent BlockPlaceEvent BlockBreakEvent
0 50000 100000 150000 200000 250000
147 211 234 311 534 544 814
1017
1219 1496 1775 2398 2711 2722 3814 6913 9910 11452 12727 14167 19364
30332 34283
41388 61290
71524 119965
[image:4.612.57.280.59.259.2]252438
Figure 3: Number of recorded events during 62 days of player collection, with over 14 person-days of active gameplay.
is focused on only a subset of the world to permit players to build without scrutiny. On the other hand, server admin-istrators have access to a complete heatmap for observing overall player activity and discovering emerging hotspots.
4.
DATASET
In order to get a first dataset for statistical evaluation, we set up our own Minecraft server. Having the logging plugin installed from the beginning allowed us to get a complete log of all changes to the initial, randomly generated world. The server difficulty was set to easy and we disabled the ability of mobs to modify the world (e.g. exploding “Creepers” would not create craters in the terrain). Other than that, the server used the default configuration.
We collected player data over a duration of two months, constituting 14 person-days worth of active gameplay. A to-tal of 45 players were active on our server during this time with 30 players active for more than an hour. We did not collect any demographical information, but due to our ad-vertisement, we assume that many of those players were uni-versity students. Players who produced less than one hour of activity were not included in the analysis. Fig. 3 shows the number of events included in our dataset. Not shown are 12,644,303 instances of PlayerMoveEvent. We also ex-cluded events occurring less than 100 times, events with a very strong correlation to another event (e.g. Inventory-OpenEventandInventoryCloseEvent), events that did not contribute to our analysis (e.g. PlayerAnimationEventfor animating the swinging of a player’s arms), and those that were redundant (e.g. PlayerLoginEvent).
During this time, we also advertised the plugin to server administrators, and collected about 5 hours of data from servers besides our own. The challenges of attracting server administrators include building awareness, building
adop-tion, and all of the labor — in code development, adminis-tration, and community relations — that come with manag-ing free software projects.
5.
ANALYSIS AND VISUALIZATION
5.1
Heat Maps
Heat maps are an excellent tool for visualizing spatial in-formation. In Minecraft, knowing the spatial distribution of player activities can lead to deep insights about the behavior of players, and to more specific insights about the qualities of a particular map. They can help one recognize patterns and locate interesting points.
Fig. 4a shows where players spent their time on the server. Every pixel represents the area of one block. Darker colors mean more time. Houses reveal themselves as dark clouds of movement activity. Underground bases feature more dis-tinct edges. Mine shafts are usually represented by straight, dark lines. The light, random paths usually indicate explor-ing on the surface. Only a limited area around the spawn point is shown because including the whole active area would obscure details. We ignored players idle for more than 1 sec-ond to avoid the hot spots that arise when players leave their keyboards, as when they are waiting for daytime in-game or for their virtual plants to grow.
The data used for heat map visualization was scaled using a factor: sgn(M)·log(abs(M)·a+ 1) to make the resulting im-ages more readable. M represents the two dimensional data matrix,ais a scaling factor used to enhance image contrast, similar to gamma correction. The function maps real num-bers to a scale between -1 and 1. The result is similar to using a logarithmic scale, but works for both negative and positive values.
5.2
Quantifying Effort
To move beyond the established use of heatmaps for visu-alizing player traces, we graphed the spatial distribution of economic value as a result of player activity (Fig. 4b). In these plots the effects of Minecraft’s eponymous activity are immediately apparent: the game ultimately consists of re-moving value from some locations (brightness) and concen-trating it elsewhere (darkness). Buildings can be recognized as dark rectangles. They get darker by being either tall or made of expensive materials. Mines and farms leave bright traces that result from the removal of blocks and the harvest-ing of plants. Paths with intermittent dark spots indicate caves lighted with torches.
To calculate the economic values of removed and placed blocks, we consulted blocksandgold.3 They use a trading system based on a virtual currency to determine the value of items. The price list gets updated daily. We took the val-ues from October 6th 2014. Players on our server are likely to value blocks differently, but data from a different world’s economy is expected to give a satisfactory approximation to that in our own. Measures and visualizations of economic value have potential applications in the maintenance and measure of collaborative (or any) activity, and may form the
3http://www.blocksandgold.com/en/
(a)
[image:5.612.71.275.48.336.2](b)
Figure 4: Heat maps of player position (a) and block value (b) on our server. Block values are summed over the vertical axis.
foundation for micro- or macroeconomic analyses of activity in this interactive virtual world.
5.3
Game Level Analysis
Our framework can be used to diagnose problems in level or game design. We created heat maps with behavioral data from custom game level maps. The two maps in Fig. 5 show player positions accumulated over time, overlaid with ac-cumulated player deaths (red). The maps are created by recording player data from the map Periculum.4 and A
Light in the Dark5 respectively. Both maps were played by eight different people.
Difficult parts on the map can be identified by dark colors (players spending a lot of time at the same spot) and by red pixels (players have died). This data can be used to identify areas where the map is too confusing or difficult. Heat maps of this kind can be utilized to distribute the difficulty of a custom map more evenly, so players stay challenged without being frustrated.
6.
PLAYER CLASSIFICATION
To obtain a higher-level representation of player behaviors and experiences, it is necessary to translate between the moment-by-moment game events such asPlayerMoveEvent
4http://www.minecraftmaps.com/adventure-maps/
periculum
5http://www.minecraftmaps.com/parkour-maps/
a-light-in-the-dark
Figure 5: Heat maps (extract) of player positions and deaths for the maps “Periculum” (left) and “A Light in the Dark” (right)
to states with more abstracted behavioral meanings. In-spired by the scheme of the popular Bartle test [3] we sought to identify behaviors based on Bartle’s proposed player types. We used terms that are unambiguous and easy for players to understand: explore, mine, build, and fight (an op-tion forotherwas also provided). Training on ground-truth data from player queries, we built a classifier to assign play-ers to these high-level types from patterns in the elementary behavior events they generated.
6.1
Ground Truth Collection
We used our Ground Truth plugin to ask people, at ran-dom intervals, what they were doing via in-game chat. The sampling method was inspired by the work of Csikszent-mihalyi [10]. The reminder message “$PLAYERNAME, what are you doing? type /do help” was sent to players ev-ery 3–13 minutes. The “/do help” command provides more information about how to use the command. With the/do
command, players can also make unsolicited reports on their current activities, or, alternatively, turn the (potentially dis-tracting) queries off and back on.
Players selected the behavior they were engaged in by using the first letter, e.g. “/do b” for building. We issued 2193 reminders and received 708 self-classifications: 286, 117, 35, 182 and 88 for build, explore, fight, mine, and other
events, respectively.
6.2
Features
We pre-processed low-level events into usable features for classification. We ended up using 29 features, listed in Fig. 7a.
PlayerMoveEvent was transformed intomoveDistance and
the toggle events for sneak and sprint were transformed to time spent sneaking and moving. The other events were represented by simply counting their occurrences.
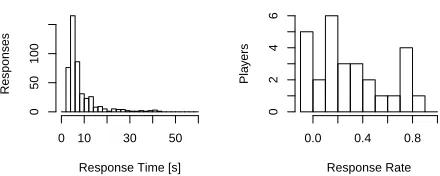
[image:5.612.320.550.53.246.2]Response Time [s]
Responses
0 10 30 50
0
50
100
Response Rate
Pla
y
ers
0.0 0.4 0.8
0
2
4
[image:6.612.56.276.78.166.2]6
Figure 6: Response times and response rate of our ground truth collection
would have had the advantage of capturing a more average view of the behavior. On the other hand, shorter periods would have reduced the risk of capturing several different overlapping behaviors. Specific game tasks usually take well over two minutes, but the time-scale we selected was of the same order as players’ responses to our ground truth queries (see Fig. 6). We were unable to significantly improve the ac-curacy of the classifier by increasing or decreasing the length of the time window. We created the training set by center-ing each window around the time that a player entered their report for their current activity. Neither moving the center nor weighting the significance of events by distance to the center improved the classification.
After looking at how long it took players to report their ac-tivity after receiving the reminder (see Fig. 6), we decided to consider a response as valid if it occurred within 60 sec-onds of the query. This led to an average response rate of 0.289. The histogram in Fig. 6 on the right shows that five players ignored all the requests, but most players re-sponded to at least some of them. One player deactivated the reminders temporarily and two players permanently. 75 reports couldn’t be associated with a request, and seem to have been entered unsolicited. Their temporal distribution was random enough to merit inclusion in our ground truth dataset.
6.3
Classification
Using the ground truth data, we built a classifier to summa-rize from logged data a player’s behavior at a given moment. Only data from our own server was used, excluding game-play inside custom maps. The main dataset contains 11,040 data points generated by slicing the recorded data into two minute windows.6 The training set contains 620 data points,
ignoring the activityother.
Vi(x) maps a data point to its aggregated feature value de-scribed in section 6.2 wherex∈ X is a data point andiis one of the 29 features. vi(x) = ai·(Vi(x)−bi) produces a normalized value where ai and bi are chosen to satisfy E[vi] = 0 and Var[vi] = 1 for every feature in the main data set. The normalized values describe the deviation from aver-age gameplay and allow us to compare the different features.
6
Even though we ignored windows without activity, the dataset contains more idle time than our previous play time measurement, resulting in 15.3 days of data.
Classification associates patterns of features in the training data with the behaviors reported by the players. A weight matrixWijis calculated by first summing up all data points for a certain behavior in the training set. Each row of this matrixwijis subsequently normalized to unit length:
Wij= X
x∈X(j)
vi(x)
wij=qWij
P
jW
2 ij ,
(1)
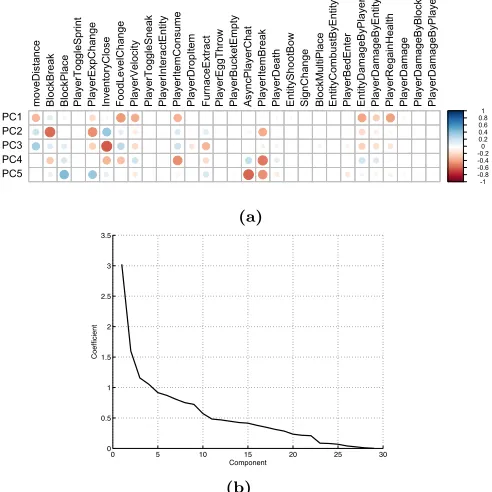
where X(j) produces all data points with the reported be-havior j. The resulting row vectors describe the average distribution of features for each behavior, shown in Fig. 7a. Inspection shows that the results make sense intuitively: features one would associate with a certain behavior stand out reasonably well. Principal components analysis (PCA) shows that five components can explain ˜50% of the variation in our dataset (Fig. 8b), implying that identifying five high-level behaviors is a reasonable goal, but one that may leave some variation unexplained. The principal components show similarities to our theory-led behavioral groups, for example PC1 is almost identical to “”fighting”, and PC2 has strong similarities to “mining” (noting that components can be sign reversed without loss of generality).
PCA identifies orthogonal components in the data. We did not impose this restriction on our classifier, since we expect there to be overlaps in behavior. Fighting, for example, seems to occur disproportionally often during exploring, re-sulting in a clearly noticeable fighting component inside the exploring vector. Simultaneously, the number of reported “fight” behaviors was much lower than other behavior types. This needn’t imply that our server was particularly peaceful. Fights often don’t last as long as behaviors from the other categories, and players might have been too busy to use the console during a fight. They also may already have returned to their previous task when answering or even noticing a re-minder. We did not try to separate the variables any fur-ther because we wanted to minimize manual tweaking of our data, and any losses of generalizability and reproducibility.
Our linear classifier uses the weight matrix defined above to assign four scoresSto any new input vectorxvia the scalar product
Si=X
j
wijxj. (2)
-1 -0.8 -0.6 -0.4 -0.20 0.2 0.4 0.6 0.81 mo ve D ist an ce Bl ockBre ak Bl ockPl ace Pl aye rT og gl eSp rin t Pl aye rExp C ha ng e In ve nt oryC lo se F oo dL eve lC ha ng e Pl aye rVe lo ci ty Pl aye rT og gl eSn ea k Pl aye rI nt era ct En tit y Pl aye rI te mC on su me Pl aye rD ro pI te m F urn ace Ext ra ct Pl aye rEg gT hro w Pl aye rBu cke tEmp ty Asyn cPl aye rC ha t Pl aye rI te mBre ak Pl aye rD ea th En tit ySh oo tBo w Si gn C ha ng e Bl ockMu lti Pl ace En tit yC omb ust ByEn tit y Pl aye rBe dEn te r En tit yD ama ge ByPl aye r Pl aye rD ama ge ByEn tit y Pl aye rR eg ai nH ea lth Pl aye rD ama ge Pl aye rD ama ge ByBl ock Pl aye rD ama ge ByPl aye r b e f m o (a) (b)
Figure 7: Classifier training and validation, showing the trained weight matrix (a) and confu-sion matrix from the cross-validation (b)
-1 -0.8 -0.6 -0.4 -0.20 0.2 0.4 0.6 0.81 mo ve D ist an ce Bl ockBre ak Bl ockPl ace Pl aye rT og gl eSp rin t Pl aye rExp C ha ng e In ve nt oryC lo se F oo dL eve lC ha ng e Pl aye rVe lo ci ty Pl aye rT og gl eSn ea k Pl aye rI nt era ct En tit y Pl aye rI te mC on su me Pl aye rD ro pI te m F urn ace Ext ra ct Pl aye rEg gT hro w Pl aye rBu cke tEmp ty Asyn cPl aye rC ha t Pl aye rI te mBre ak Pl aye rD ea th En tit ySh oo tBo w Si gn C ha ng e Bl ockMu lti Pl ace En tit yC omb ust ByEn tit y Pl aye rBe dEn te r En tit yD ama ge ByPl aye r Pl aye rD ama ge ByEn tit y Pl aye rR eg ai nH ea lth Pl aye rD ama ge Pl aye rD ama ge ByBl ock Pl aye rD ama ge ByPl aye r PC1 PC2 PC3 PC4 PC5 (a)
0 5 10 15 20 25 30
0 0.5 1 1.5 2 2.5 3 3.5 Component Coefficient (b)
Figure 8: PCA analysis, showing the weight matrix for the first five components (a) and the coefficient value of each component (b)
We verified our classifier by using leave-one-out cross-validation. Each sample in our training set was classified using all other samples. The results of the cross-validation are shown in Ta-ble 7b in the form of a confusion matrix. The classifier had an overall success quotient of 401/620 = 0.65. This is 2.6 times greater than a random classification success of 0.25, but several issues could still be limiting the performance of the classifier. A player declaring explore could have been mining during most of the measured two minutes. Build-ing a house inside a mountain could (and possibly should) be measured as mining. Before trying to improve the clas-sifier based on the available data, we recommend further analyzing gameplay that leads to misclassifications, e.g. by observing players in play.
Observations. Our classification of player behavior uses a combination of linear filters over players’ actions within a recorded window of time. Future studies, with potentially larger sets of training data, could investigate whether non-linear classification (e.g. support vector machines, neural networks etc.) can achieve a more accurate detection of different behaviors.
Most of our classifier’s errors were made while attempting to distinguish between exploring and fighting behavior. This could have resulted from the nature of the game or the data collection method: players fight for relatively shorter peri-ods of time, amidst other types of behavior, and are un-likely to be able to report their behavior at the time. Adap-tive time-windowing and post-hoc questioning could ame-liorate this issue. For example, players could be shown re-plays of notable action phases (sets of actions differing from the surrounding period) and asked what behavior was being displayed. Distinguishing between different fighting styles might also improve the classifiers accuracy. Fighting with bow and arrow triggers different events compared to sword fights. Fighting on the surface, which includes more move-ment over greater distances than fighting in caves, is often classified as exploring.
7.
DISCUSSION AND FUTURE WORK
We successfully built a framework for recording gameplay on Minecraft servers. From one server, our own, we recorded two weeks of fine-granularity player behavior data. The col-lected data provided interesting insights into players’ be-havior that can be used to help players, server administra-tors, and academics. By creating heat maps we were able to recognize different kinds of player activity, and map the extraction and creation of valuable resources in the game. Our classifier allowed us to distinguish between building, fighting, mining and exploring with about 65% accuracy.
The Epilog plugin is likely to be of value to other researchers. Some modifications would certainly improve that value, like the ability to track items that players are keeping in their inventories, putting in chests, or, in the case of arrows, firing at each other.
[image:7.612.54.300.406.652.2]likely. Our investigation of the online community of server administrators and players suggests that many of them de-sire to host or participate in worlds where players preferen-tially exhibit certain behaviors. Automated detection and presentation of player behavior can be used to advertise worlds based on these characteristics, and to allow server ad-ministrators to determine whether their hosted worlds meet the specifications they desire. Feedback systems could uti-lize this analysis to advise server administrators or make in-play suggestions that guide users toward the types of ex-periences they prefer. Moreover, automated filtering of basic actions into defined behaviors will help identify how world characteristics influence the types of behavior exhibited, cre-ating the opportunity for large-scale observational studies of the efficacy of different rules or mechanisms for producing pro-social collaborative behavior. The PrivateWorlds plugin lets players rate maps after playing them. This information, combined with all the recorded gameplay, can be used to an-alyze different maps. With such insights, it may be possible to develop algorithms for rating maps automatically.
Our study of player behavior and cooperation in Minecraft is complementary to research in computer graphics and digital storytelling that explores the automated synthesis of player and NPC interactions [16, 22] for interactive storytelling [15, 17]. An interesting avenue of future exploration is to anal-yse and guide unstructured player experiences in Minecraft towards telling compelling interactive narratives.
Finally, with Minecraft as a laboratory, researchers can ex-pose virtual economies, property systems, and governance institutions to experimental analysis. Many investigations into the development of societies are limited by the rela-tively small number of different real societies we can study. Systematic analysis of virtual worlds has the potential to overcome this barrier, expanding the number of alternative societies by orders of magnitude. We will continue our ef-forts to expand our dataset by adding more servers. The plugins, a list of participating servers to play on and more can be found athttp://heapcraft.net/. The data will be used to analyze player collaboration and will be made avail-able to researchers upon request.7
Acknowledgements
Richard P. Mann was supported by ERC Advanced Investi-gator grant ’Momentum’ no. 324247 to Dirk Helbing. Credit for all screenshots from Minecraft go to Minecraft® TM &© 2009-2015 Mojang / Notch. This work was partially supported by ETH Research Grant ETH-23 13-2.
8.
REFERENCES
[1] S. Aral, L. Muchnik, and A. Sundararajan. Distinguishing influence-based contagion from homophily-driven diffusion in dynamic networks. Proceedings of the National Academy of Sciences of the United States of America, 106(51):21544–21549, Dec. 2009.
[2] W. S. Bainbridge. The scientific research potential of virtual worlds.science, 317(5837):472–476, 2007. [3] R. Bartle. Hearts, clubs, diamonds, spades: Players
who suit muds.MUD Research, 1(1):19, 1996.
7
Contact us onhttp://heapcraft.net/
[4] R. M. Bond, C. J. Fariss, J. J. Jones, A. D. I. Kramer, C. Marlow, J. E. Settle, and J. H. Fowler. A
61-million-person experiment in social influence and political mobilization.Nature, 489(7415):295–298, Sept. 2012.
[5] E. Castronova. Virtual Worlds: A First-Hand Account of Market and Society on the Cyberian Frontier. papers.ssrn.com.
[6] E. Castronova, T. L. Ross, and I. Knowles. Designer, analyst, tinker: How game analytics will contribute to science. InGame Analytics, pages 665–687. Springer, 2013.
[7] E. Castronova, D. Williams, C. Shen, R. Ratan, L. Xiong, Y. Huang, and B. Keegan. As real as real? Macroeconomic behavior in a large-scale virtual world. New Media & Society, 11(5):685–707, July 2009. [8] I. Constantiou, M. F. Legarth, and K. B. Olsen. What
are users’ intentions towards real money trading in massively multiplayer online games? .Electron Markets, 22:105–115, June 2012.
[9] L. Coviello, Y. Sohn, A. D. I. Kramer, C. Marlow, M. Franceschetti, N. A. Christakis, and J. H. Fowler. Detecting Emotional Contagion in Massive Social Networks.PloS one, 9(3):e90315, Mar. 2014. [10] M. Csikszentmihalyi and R. Larson. Validity and
reliability of the experience-sampling method.The Journal of nervous and mental disease,
175(9):526–536, 1987.
[11] N. Ducheneaut and N. Yee. Data collection in
massively multiplayer online games: Methods, analytic obstacles, and case studies. InGame Analytics, pages 641–664. Springer, 2013.
[12] J. H. Fowler, N. A. Christakis, Steptoe, and D. Roux. Dynamic spread of happiness in a large social network: Longitudinal analysis of the Framingham Heart Study social network.BMJ: British Medical Journal, pages 23–27, 2009.
[13] R. Garnett, T. Gartner, T. Ellersiek,
E. Gudmondsson, and P. Oskarsson. Predicting unexpected influxes of players in eve online. In Computational Intelligence and Games (CIG), 2014 IEEE Conference on, pages 1–8. IEEE, 2014. [14] R. Houlette. Player modeling for adaptive games.AI
Game Programming Wisdom II, pages 557–566, 2004. [15] M. Kapadia, J. Falk, F. Z¨und, M. Marti, R. W.
Sumner, and M. Gross. Computer-assisted authoring of interactive narratives. InProceedings of the 19th Symposium on Interactive 3D Graphics and Games, i3D ’15, pages 85–92, New York, NY, USA, 2015. ACM.
[16] M. Kapadia, S. Singh, G. Reinman, and P. Faloutsos. A behavior-authoring framework for multiactor simulations.Computer Graphics and Applications, IEEE, 31(6):45 –55, nov.-dec. 2011.
[17] M. Kapadia, F. Z¨und, J. Falk, M. Marti, R. W. Sumner, and M. Gross. Evaluating the authoring complexity of interactive narratives for augmented reality applications. InProceedings of the Foundations of Digital Games Conference, FDG ’15, 2015.
National Academy of Sciences of the United States of America, 111(24):8788–8790, June 2014.
[19] L. Muchnik, S. Aral, and S. J. Taylor. Social Influence Bias: A Randomized Experiment.Science,
341(6146):647–651, Aug. 2013.
[20] C. K. Olson. Children’s motivations for video game play in the context of normal development.Review of General Psychology, 14(2):180–187, 2010.
[21] H. Prendinger, J. Mori, and M. Ishizuka. Recognizing, modeling, and responding to users’ affective states. In L. Ardissono, P. Brna, and A. Mitrovic, editors,User Modeling 2005, volume 3538 ofLecture Notes in Computer Science, pages 60–69. Springer Berlin Heidelberg, 2005.
[22] A. Shoulson, M. L. Gilbert, M. Kapadia, and N. I. Badler. An event-centric planning approach for dynamic real-time narrative. InProceedings of Motion on Games, MIG ’13, pages 99:121–99:130, New York, NY, USA, 2013. ACM.
[23] D. Thue, V. Bulitko, M. Spetch, and E. Wasylishen. Interactive storytelling: a player modelling approach. InProceedings of the 3rd AAAI International Conference on Artificial Intelligence and Interactive Digital Entertainment, pages 43–48, 2007.
[24] S. Villani. Impact of media on children and
adolescents: A 10-year review of the research.Journal of the American Academy of Child & Adolescent Psychiatry, 40(4):392–401, 2001.
[25] M. E. Wollslager. Children’s awareness of online advertising on Neopets: The effect of media literacy training on recall.SIMILE: Studies In Media & Information Literacy Education, 9(2):31–53, 2009. [26] G. Yannakakis and M. Maragoudakis. Player modeling