This is a repository copy of Moisture content behaviour in extensive green roofs during dry periods: the influence of vegetation and substrate characteristics.
White Rose Research Online URL for this paper: http://eprints.whiterose.ac.uk/79782/
Article:
Berretta, C., Poe, S. and Stovin, V. (2014) Moisture content behaviour in extensive green roofs during dry periods: the influence of vegetation and substrate characteristics. Journal of Hydrology, 511. 374 - 386. ISSN 0022-1694
https://doi.org/10.1016/j.jhydrol.2014.01.036
[email protected] https://eprints.whiterose.ac.uk/
Reuse
Unless indicated otherwise, fulltext items are protected by copyright with all rights reserved. The copyright exception in section 29 of the Copyright, Designs and Patents Act 1988 allows the making of a single copy solely for the purpose of non-commercial research or private study within the limits of fair dealing. The publisher or other rights-holder may allow further reproduction and re-use of this version - refer to the White Rose Research Online record for this item. Where records identify the publisher as the copyright holder, users can verify any specific terms of use on the publisher’s website.
Takedown
If you consider content in White Rose Research Online to be in breach of UK law, please notify us by
Moisture content behaviour in extensive green roofs during dry periods: The influence
1
of vegetation and substrate characteristics
2
Christian Berretta*1, Simon Poë2 and Virginia Stovin3
3
*1Corresponding author, Research Fellow, Department of Civil and Structural Engineering,
4
The University of Sheffield, Mappin Street, SHEFFIELD S1 3JD. [email protected]
5
2Research Student, Department of Civil and Structural Engineering, The University of
6
Sheffield, Mappin Street, SHEFFIELD S1 3JD. [email protected]
7
3 Senior Lecturer, Department of Civil and Structural Engineering, The University of
8
Sheffield, Mappin Street, SHEFFIELD S1 3JD. [email protected]
9
Corresponding author Tel: +44 (0) 114 222 5051.
10
ABSTRACT
11
Evapotranspiration (ET) is a key parameter that influences the stormwater retention capacity,
12
and thus the hydrological performance, of green roofs. This paper investigates how the
13
moisture content in extensive green roofs varies during dry periods due to evapotranspiration.
14
The study is supported by 29 months continuous field monitoring of the moisture content
15
within four green roof test beds. The beds incorporated three different substrates, with three
16
being vegetated with sedum and one left unvegetated. Water content reflectometers were
17
located at three different soil depths to measure the soil moisture profile and to record
18
temporal changes in moisture content at a five-minute resolution. The moisture content
19
vertical profiles varied consistently, with slightly elevated moisture content levels being
20
recorded at the deepest substrate layer in the vegetated systems. Daily moisture loss rates
21
were influenced by both temperature and moisture content, with reduced moisture
22
loss/evapotranspiration when the soil moisture was restricted. The presence of vegetation
resulted in higher daily moisture loss. Finally, it is demonstrated that the observed moisture
24
content data can be accurately simulated using a hydrologic model based on water balance
25
and two conventional Potential ET models (Hargreaves and FAO56 Penman-Monteith)
26
combined with a soil moisture extraction function. Configuration-specific correction factors
27
have been proposed to account for differences between green roof systems and standard
28
reference crops.
29
KEYWORDS
30
Moisture content; Evapotranspiration; Green roof; Stormwater management; Retention;
31
Substrate
32
1 INTRODUCTION
33
Recent trends of urbanization and climate change pose important challenges in urban areas,
34
including the increased risk of flooding (due to drainage system surcharge) and pollution (due
35
to Combined Sewer Overflows and diffuse pollution). It is recognised that more resilient
36
stormwater management infrastructure is required, with Sustainable Drainage Systems
37
(SuDS) (and similar concepts worldwide) aiming to restore pre-development hydrological
38
conditions. Emerging concepts like Water Sensitive Urban Design are driving researchers and
39
practitioners to investigate ‘green infrastructure’ that, by including vegetation, can also
40
provide benefits to the ecosystem (e.g. mitigating heat islands, promoting biodiversity,
41
enhancing water quality). SuDS include green roofs, swales, rain gardens, wet ponds, and
42
infiltration basins. Green roofs have the potential to deliver significant stormwater
43
management benefits, especially in dense urban cores where space is limited. Roof spaces
44
account for approximately 40-50% of the impervious urban surface area (Dunnett and
45
Kingsbury, 2004), and in view of the relative simplicity of installation, green roofs have the
potential to be part of a treatment train, working in conjunction with multiple SuDS devices
47
to provide more beneficial stormwater management than any single element on its own.
48
Green roofs consist of a vegetative layer, supported by a growing medium (substrate)
49
installed above a filtration geosynthetic layer and a drainage layer. This study focuses on
50
extensive green roofs, which are characterized by thinner substrate depths (generally <
51
150 mm). Extensive green roofs have greater potential of wide-scale adoption than intensive
52
green roofs, where significant structural loading considerations restrict application. The
53
limitation of extensive type systems is that a shallower substrate has a lower, and finite,
54
stormwater retention capacity (e.g. 20 mm as observed by Stovin et al. (2012) in an 80 mm
55
substrate roof) and is more likely to experience restricted moisture conditions and plant stress
56
during prolonged dry periods. Several studies have aimed at evaluating the hydrological
57
performance of green roofs through field monitoring programmes (see Palla et al. (2010), and
58
Stovin et al. (2012) for an overview). It is evident that the roof’s ability to retain stormwater
59
is highly sensitive to the initial moisture condition of the green roof system prior to a rainfall
60
event. This is controlled by the evapotranspiration (ET) process during dry periods. A better
61
understanding of the moisture content behaviour during dry periods due to ET will have
62
important implications for stormwater management and should lead to the development of
63
more accurate modelling approaches for long-term simulations. Such predictions are
64
necessary to support decision-making in stormwater management; both in terms of projecting
65
green roof performance in response to changing climatic scenarios (Stovin et al., 2013) and
66
for estimating plant stress conditions (and the consequent need for irrigation treatments).
67
Several recent research projects have focused on the measurement of ET from green roof
68
systems, and on the development of appropriate ET modelling tools. In some of the earliest
69
studies undertaken by Köhler at Neubrandenburg, Germany (Köhler, 2004) weighing
70
lysimeters were incorporated within green roof systems to quantify the water balance. More
recently, Berghage et al. (2007), Voyde et al. (2010) and Poë and Stovin (2012) have used
72
load cells to monitor moisture losses from green roof microcosms under controlled climatic
73
conditions. Green roof systems are typically not irrigated, and actual ET rates fall with time
74
following a rainfall event, as the available moisture becomes increasingly restricted.
75
Berghage et al. (2007) and Voyde et al. (2010) identified differences in actual ET between
76
plant species, and both proposed temporal decay relationships to model the observed
77
reductions in ET over time. However, Stovin et al. (2013) have argued that it is the substrate
78
moisture content, rather than time, that directly determines the difference between actual and
79
potential ET rates. Several authors (e.g. Rezaei, 2005; Kasmin et al., 2010) have
80
demonstrated that standard agricultural methods of predicting potential ET are transferable to
81
the prediction of observed ET rates from green roof systems, although crop/system
82
coefficients may be required to account for the non-standard vegetation and substrates.
83
Recently, some authors have used closed atmospheric chambers to quantify ET on full-scale
84
green roof installations (e.g. Coutts et al., 2013). Whilst lysimeter and surface-mounted
85
climate chamber-based experiments provide a direct measurer of total moisture loss due to
86
ET, this includes changes in the moisture content within the vegetation, and does not provide
87
a direct indication of the actual substrate moisture content, or its vertical distribution. Palla et
88
al. (2009) have demonstrated the value of direct substrate moisture content measurements for
89
the development and validation of accurate moisture flux models.
90
The moisture content behaviour during dry periods is influenced by plant species, substrate
91
characteristics and climatic conditions. Studies in the laboratory, under controlled conditions,
92
facilitate the simulation of extreme hydrological conditions that can enhance understanding
93
of key controlling parameters (Yio et al, 2013) and also underpin the development of novel
94
substrate compositions that can be optimized for water retention - for example by using
95
additives (Emilsson et al., 2012; Farrel et al., 2013). However, climatic variables cannot
easily been taken into consideration through laboratory studies. For this reason, the present
97
study focuses on a long-term field monitoring programme which commenced at the
98
University of Sheffield, UK in March 2011.
99
1.1 Objectives 100
The main objective of the research was to utilise new moisture content data from four green
101
roof test beds collected over 29 months continuous field monitoring to understand the
102
hydrological processes occurring within green roof systems during dry periods. In particular,
103
the analysis focused on the vertical moisture content profile and the behaviour of moisture
104
content with respect to time. It was expected that the temporal changes in substrate moisture
105
content would relate to climatic conditions and to the initial moisture content, as well as to
106
the substrate physical characteristics and the presence of vegetation.
107
An additional objective was to investigate the possibility of simulating the temporal changes
108
in moisture content using a hydrologic model based on water balance, an estimate of
109
Potential ET and a soil moisture extraction function. The final objective was to assess
110
whether correction factors would be required to account for the differences between green
111
roof systems and standard reference crops and soils.
112
2 METHODOLOGY
113
2.1 The experimental setup
114
2.1.1 The test beds
115
The research was conducted at the University of Sheffield’s Green Roof Centre. The test site
116
is located on a fifth-floor terrace of the Sir Robert Hadfield building (53.3816, -1.4773) and
117
consists of 9 green roof test beds (TB) which vary systematically in their substrate
118
composition and vegetation options. This experiment was established in summer 2009 and
data have been collected since April 2010 to assess the extent to which substrate type and
120
vegetation treatment affect long-term runoff retention and detention performance (Poë et al,
121
2011). In March 2011, four of these test beds were equipped with water content
122
reflectometers for continuous moisture content measurement. This study is based on the data
123
collected from these four test beds. Each test bed is 3 m long x 1 m wide, installed to a 1.5°
124
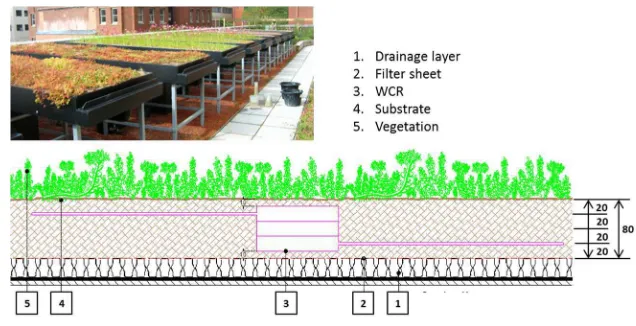
slope. The TBs are located at a height of 1 m above the terrace roof surface (Fig. 1). The TBs
125
consist of an impervious hard plastic tray base, a drainage layer (ZinCo Floradrain FD 25-E),
126
a filter sheet (ZinCo Systemfilter SF), and one of three substrates (80 mm deep). Three test
127
beds are vegetated with Alumasc Blackdown Sedum Mat (TB1, TB2 and TB3) and the fourth
128
test bed has no vegetation (TB41). Sedum was chosen because it is the most commonly
129
adopted plant in green roof applications due to its tolerance to extreme temperatures, high
130
wind speeds and limited water consumption requirements (VanWoert et al., 2005). With the
131
intention of providing universally-applicable findings, two commercially-available substrates
132
manufactured by Alumasc – Heather with Lavender Substrate (HLS) (TB1 and TB4) and
133
Sedum Carpet Substrate (SCS) (TB2) – were considered alongside a bespoke substrate based
134
on the widely used Lightweight Expanded Clay Aggregate (LECA) (TB3).
135
The experimental setup includes a Campbell Scientific weather station that records hourly
136
wind speed, temperature, solar radiation, relative humidity and barometric pressure. Rainfall
137
depth was measured at one minute intervals using three 0.2 mm resolution ARG-100 tipping
138
bucket rain gauges manufactured by Environmental Measures Ltd. Runoff was measured
139
volumetrically through collection tanks equipped with a Druck Inc. PDCR 1830 pressure
140
transducers. The collection tank located under each test bed was designed for increased
141
measurement sensitivity at the beginning of each rainfall event and to avoid direct discharge
142
on the sensor. The pressure transducers were calibrated on site. A solenoid electronic valve
143
empties the tank when maximum capacity is reached and every day at 14:00. Runoff is
144
recorded at 1 minute intervals. Data are recorded through a Campbell Scientific CR3000 data
145
logger.
146
During this monitoring programme the sedum vegetation was well established with good
147
surface coverage.
148
2.1.2 Moisture content measurements
149
Water content reflectometers were located at three different soil depths to measure the soil
150
moisture profile and behaviour in the four test beds. The sensors used were Campbell
151
Scientific CS616 Water Content Reflectometer (Campbell Scientific Inc., 2006). The probes
152
were installed horizontally at the centre of each test bed and the rods were located at 20 mm
153
(bottom), 40 mm (mid) and 60 mm (top) above the drainage layer and filter sheet (as shown
154
in Fig. 1). Considering the proximity of the probes in each test bed, the rods of the mid and
155
top probes were installed at 90° and 180° respectively from the lower one, in order to avoid
156
distortion of the measurement reading taken by the enabled probe. The orientation of each
157
probe was pre-determined to ensure that the wires did not interfere with the accuracy of the
158
measurements from nearby probes. Furthermore, to avoid inter-probe interference, the probes
159
are differentially-enabled, with each of the four sub-scans measuring three probes in different
160
test beds. Moisture content measurements were recorded at 5 minute intervals.
161
Considering the specificity of the substrates used, the 12 sensors were calibrated in the
162
laboratory using the three substrates monitored in the field (Kelleners et al., 2005; Seyfried
163
and Murdock, 2001; Western and Seyfried, 2005). Moisture content during calibration ranged
164
between 0.05 and 0.40 m3m-3. The actual moisture content (θ) at each calibration condition
165
was measured by drying the soil to constant weight (until change in weight was less than
166
0.5%) at 110°C from 24 to 40 hours and multiplying by the measured bulk density. The
temperature in the laboratory was 20°C, and the sensors were also tested at 30, 35 and 40°C.
168
It was confirmed that the effect of temperature change for higher temperatures could be
169
compensated for by applying the correction equation provided by Campbell Scientific and
170
proposed by Western and Seyfried (2005).
171
[Approximate location of Figure 1]
172
2.1.3 Substrate characteristics
173
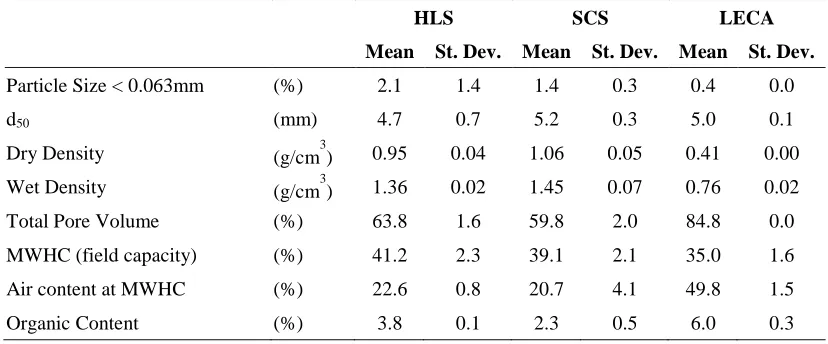
HLS is a semi-intensive commercial substrate which consists of crushed bricks and pumice
174
(ZincolitPlus), enriched with organic matter including compost with fibre and clay materials
175
(Zincohum) (ZinCo GmbH). The SCS Substrate is a typical extensive green roof substrate
176
consisting of crushed bricks (Zincolit), enriched with Zincohum. The organic content in HLS
177
is greater than in SCS. The LECA-based substrate contains 80% LECA, 10% loam (John
178
Innes No. 1) and 10% compost by volume. Laboratory tests of these substrates were carried
179
out according to the Guidelines for the Planning, Construction and Maintenance of Green
180
Roofing of the German Landscape Development and Landscaping Research Society (FLL,
181
2008). The tests performed included Particle Size Distribution (PSD), apparent density (dry
182
condition and at max water capacity), total pore volume, maximum water holding capacity
183
(MWHC), permeability and organic content (Table 1). To address the uncertainty associated
184
with subsampling heterogeneous mixtures, a sample splitter was used and 3-6 replicate
185
samples were tested, depending on the analysis.
186
Soil-moisture release curves for the three substrates were determined using the pressure plate
187
extraction method (Carter, 1993; Soil Moisture Equipment Corp., 2008). The moisture
188
release curve expresses the relationship between the moisture content, θ, and the soil moisture
189
potential, ψ. The principle of this test is to gradually extract water from initially-saturated
190
samples by applying increasing pressures. The resulting curve provides important
information regarding the plant available water, i.e. moisture content values between MWHC
192
(field capacity) and the permanent wilting point. Field capacity defines the condition when
193
the substrate can hold no more moisture under gravity, and corresponds to 0.33 bar suction,
194
whilst the permanent wilting point defines the lower limit to plant available moisture, and
195
corresponds to 15 bar suction (Fassman and Simcock, 2012; Hillel, 1971). A 1600 Pressure
196
Plate Extractor 5 bar and a 1500F1 Pressure Plate Extractor 15 bar manufactured by Soil
197
Moisture Equipment Corporation were used for this purpose. Due to the specific
198
characteristics of the green roof substrates the standard test procedure proposed by the
199
manufacturer was slightly modified. A wet strengthened filter paper (Whatman No. 113) was
200
attached to the bottom of the sample rings to avoid collection of sample residues on the
201
ceramic plate at the end of the test. A mixture of kaolin and water was spread on the ceramic
202
plate to ensure contact between the sample and the ceramic plate.
203
The physical characteristics of the substrates are reported in Table 1, while the PSD and
204
moisture release curve are shown in Fig. 2. To address the uncertainty of testing substrates
205
consisting of heterogeneous mixtures of different materials, tests were conducted using
206
different batches of substrates. It was observed that individual batches of each specific
207
material provided different results. Often the raw materials composing the substrates are
208
sourced by different suppliers, resulting in material characteristics per batch that vary from
209
the nominal expected values. For this reason, the results presented in this paper refer to the
210
specific batches used in the field installation.
211
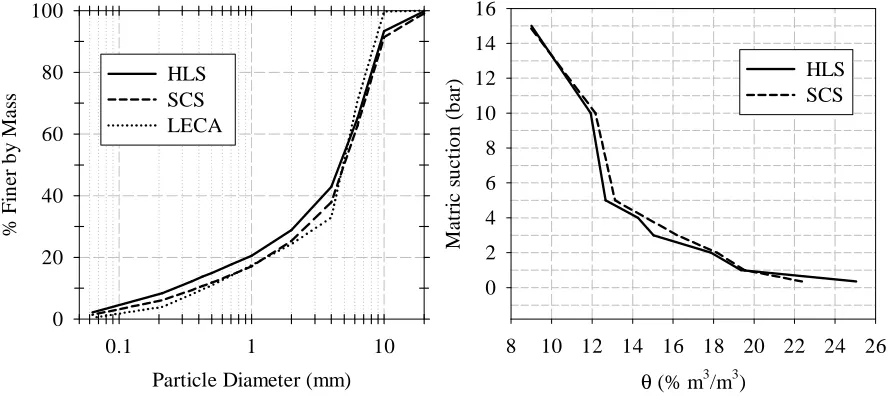
In general the three substrates, although different in composition and material, have similar
212
PSD curves, albeit with HLS characterized by a higher proportion of finer particles. The
213
similarities are not surprising considering that the three substrates were developed according
214
to the FLL guidelines, which restrict the range of permissible granulometric distributions.
215
The MWHC of HLS from the laboratory test is 41.2 %, slightly higher than the SCS and
LECA substrates due to its higher organic content and finer gradation. While HLS and SCS
217
have similar characteristics, the LECA is a lightweight, low density substrate characterized
218
by higher porosity and higher organic content. The moisture release curve obtained through
219
the pressure extraction test did not provide meaningful results for the LECA, as the
220
characteristics of the material proved to be unsuitable for the test. The HLS and SCS
221
substrates have similar moisture release curves, consistent with their soil characteristics. The
222
wilting point is reached at 9.0 and 8.9 % volumetric moisture content respectively for HLS
223
and SCS. A slight deviation in moisture release is shown when the volumetric moisture
224
content falls below 18%, with lower moisture release from the SCS substrate below this
225
datum. When moisture conditions are restricted, below 11% moisture content, the same
226
moisture release behaviour was observed for the two substrates. The MWHC values obtained
227
from this test were lower than the values resulting from FLL tests (25.0 and 22.4 %
228
volumetric moisture content respectively for HLS and SCS). It is possible that the sieving
229
procedure needed for the preparation of the sample affected the test at low pressure (i.e. field
230
capacity). Also, the smaller volume of sample required for this test could lead to errors due to
231
subsampling and/or boundary effects. In this sense the MWHC obtained through the FLL test
232
are more representative of the characteristics of the substrates.
233
[Approximate location of Table 1]
234
[Approximate location of Figure 2]
235
2.2 Data analysis
236
Data from the individual moisture content probes was examined in detail for the month of
237
May 2012. This period was selected due to the presence of several rainfall events (total
238
rainfall = 51.6 mm), and dry periods (including one selected for further analysis) and because
239
the climatic conditions recorded (high temperature and solar radiation) should enhance any
impact associated with the presence of vegetation. This data was used to investigate vertical
241
moisture content profiles and to confirm that the measured moisture content fluctuations were
242
consistent with the expected hydrological processes occurring in response to rainfall and dry
243
periods.
244
Individual storm events were defined as being separated by continuous dry periods of at least
245
6 hours. Five specific Dry Weather Periods (DWP) were selected from the data record for
246
detailed analysis. These were selected to give a representative range of different climatic
247
conditions and initial substrate moisture contents. Depth-averaged moisture content values
248
enabled comparisons between the four TBs to be made.
249
The daily moisture loss, during DWP, was calculated as the difference of the average daily
250
moisture content of two consecutive days. Mean and median daily loss rates were calculated
251
over the full duration of each of the five DWPs, and moisture loss with respect to time was
252
also considered.
253
2.3 Modelling moisture losses during dry periods in green roof systems 254
The water balance equation (Equation 1) was used to simulate the moisture content behaviour
255
during dry periods. Given the present focus on dry weather periods, precipitation (P) and
256
runoff (R) are assumed to be zero, and it is assumed that the moisture loss is solely due to ET:
257
Δθ
Δ = − − (1)
258
ET is calculated using the basic form of the Soil Moisture Extraction Function (SMEF) model
259
(Zhao et al., 2013) that estimates actual ET under conditions of restricted moisture
260
availability. The basic form of the SMEF method (Equation 2) describes ET at a generic time
261
t as a function of potential evapotranspiration (PET) at the time t multiplied by the ratio of
262
actual moisture content (θt) to the moisture content at field capacity (θFC):
= ∙ (2)
264
This method was used by Stovin et al. (2013) to simulate ET in a hydrological flux model
265
developed for long term simulation of green roof systems and was validated against data
266
monitored on a green roof test bed in Sheffield, UK with similar characteristics to the one
267
used in this study. PET refers to the expected ET rate associated with a reference crop under
268
well watered conditions. Oudin et al. (2005) and Zhao et al. (2013) report many PET
269
formulae proposed in the hydrological and agricultural science literature. Two PET models
270
were used in this study: a temperature based equation that requires limited input data, 1985
271
Hargreaves equation (Hargreaves and Samani, 1985) and the energy balance-aerodynamic
272
FAO-56 Penman Monteith equation (Allen et al., 1998). The Hargreaves method estimates
273
daily grass reference PET from climatic conditions (temperature) and extraterrestrial
274
radiation calculated as a function of latitude and day of the year. The method of Hargreaves
275
and Samani best estimated daily ET among empirical models based only on temperature
276
(Allen et al., 1998; Hargreaves and Allen, 2003; Itenfisu et al., 2003; Jensen et al., 1990). The
277
FAO-56 Penman-Monteith model is the model recommended by FAO and the World
278
Meteorological Organization (WMO) to estimate reference PET from a grass surface (Allen
279
et al., 1998). This method has been shown to provide a better prediction amongst other
280
methods for green roofs (Hilten, 2005). These methods and equations are described in Jensen
281
et al. (1990).
282
The model initial moisture conditions (θ0) were set equal to the observed data at the
283
beginning of each dry period for the three vegetated systems. The model has been
284
implemented at an hourly time step. PET was calculated using daily recorded minimum and
285
maximum temperature and relative humidity, mean daily temperature, solar radiation and
286
wind speed. Hourly PET was assumed equal to daily PET/24. It is recognised that this
simplification ignores the diurnal cycle, but total losses over longer periods are correctly
288
represented.
289
The model results were evaluated through graphical techniques and three quantitative
290
statistics: Nash-Sutcliffe efficiency (NSE), percent bias (PBIAS) and the ratio of the root
291
square error to the standard deviation of measured data (RSR) as recommended by Moriasi et
292
al. (2007). NSE is a normalized statistic expressing the relative magnitude of the residual
293
variance compared to the measured data variance (Nash and Sutcliffe, 1970). PBIAS
294
represents the deviation of the simulated data from the observed values, the optimal value
295
being 0.0 and positive and negative values indicating model underestimation or
296
overestimation bias respectively (Gupta et al., 1999). The RSR includes a commonly used
297
error index statistic and it is normalized by a scaling factor that allows comparison with
298
different parameters (Moriasi et al., 2007; Singh et al, 2004). Model simulation can be judged
299
good or very good, respectively if 0.65<NSE≤0.75 or 0.75<NSE≤ 1.00 and 0.50< RSR ≤ 0.60
300
or 0.00<RSR≤0.50 irrespective of the parameter or constituent analysed. A recommendation
301
for PBIAS < ± 10% for very good performance and ±10≤PBIAS<± 15% for good
302
performance is provided for streamflow data. The same model performance ratings were
303
applied here.
304
The same model evaluation method was used to propose green roof system factors (Ks)
305
specific for the configurations tested, as described by equation 3. This coefficient takes into
306
consideration the specificity of green roof substrates and the difference between the tested
307
sedum vegetation and the reference grass crop in the PET models used. When accounting for
308
differences in vegetation, this factor is often referred to as the crop coefficient. Coefficients
309
were derived by using the method of least squares.
310
= ∙ ∙ (3)
3 RESULTS
312
3.1 Characterization of the monitored dry weather periods 313
The 29 months rainfall record contained 641 rainfall events and DWPs. Of these events, 32
314
can be considered significant, being characterized by a return period greater than 1 year
315
(Stovin et al., 2012). The probability density function of the corresponding DWPs showed
316
that 10 % of the DWPs were greater than 4 days. The mean and median DWP values were
317
respectively 39.8 and 20.5 hours, and the maximum value was 18.4 days. The climate in
318
Sheffield is generally temperate with an average 824.7 mm of rain per year (source MET
319
office data series 1971-2000). A detailed analysis of Sheffield’s climate is reported in Stovin
320
et al. (2012).
321
Because the aim of this study was to investigate the moisture content behaviour during dry
322
periods, five DWPs were selected in which no rainfall or runoff was observed for a
323
continuous period of at least ten days. The DWPs were classified as corresponding to either
324
‘cooler’ or ‘warmer’ periods. If compared to the climatic data series 1971-2000 for Sheffield,
325
UK (source Met Office), conditions in the two cooler periods (March and April 2011)
326
correspond to typical conditions in spring with mean temperatures of 8.5 and 12.6°C.
327
Conditions during the three warmer periods (July 2013, May 2012 and July 2012) were
328
comparable to typical summer conditions in Sheffield (mean temperatures between 17.1 and
329
19.8°C).
330
The initial moisture content, θ0, is expected to influence moisture loss rates. For each of the
331
DWPs considered, the absolute values of θ0, and the ratios of θ0:MWHC vary between beds.
332
In TB1 and TB2, for example, a ‘high’ θ0 implies θ0:MWHC > 0.85, medium θ0 implies
333
θ0:MWHC > 0.70 and low θ0 implies θ0:MWHC < 0.6. In the LECA-based substrate the
334
corresponding θ0 and θ0:MWHC are lower. The two cooler periods were characterized by
medium and low θ0 respectively, whilst the three warmer periods corresponded to high,
336
medium and low θ0. The characteristics of the selected DWPs are reported in Table 2.
337
[Approximate location of Table 2]
338
3.2 Moisture content fluctuations during May 2012
339
Fig. 3 shows the temporal variations in moisture content at 20, 40, and 60 mm depth from the
340
substrate surface during the month of May 2012 for the four tested green roof configurations.
341
The rainfall hyetograph and runoff hydrograph are reported in the same figure.
342
In general it may be seen that the substrate moisture content decreases during dry periods,
343
and that moisture levels are restored to their maximum value (i.e. field capacity) during the
344
larger rainfall events, which also result in runoff. Some of the smaller rainfall events result in
345
increases in the substrate moisture content, but are insufficient to restore moisture to field
346
capacity or to generate runoff from the green roof.
347
The data show consistent behaviour during dry and wet periods and provide confidence in the
348
quality of the moisture measurements through calibrated water content reflectometers.
349
Considering the vertical profile, moisture content generally increases with depth, although in
350
all four cases the differences between the top and mid-depth values are small. In the three
351
vegetated beds (TB1, TB2 and TB3), the moisture content near the bed is elevated by 10-20%
352
compared with the upper part of the profile. During rainfall events, this may be expected, due
353
to the high permeability of green roof substrates. Other studies showed that moisture
354
measurement revealed higher moisture content in the deeper layers (Palla et al., 2009).
355
Furthermore, the presence of a vertical gradient may reflect both preferential drying at the
356
surface and the effects of substrate compaction and ageing which can lead to leaching of fines
357
into the lower layers of the substrate (Morbidelli et al., 2011; 2013). However, the
unvegetated bed, TB4, exhibits no significant vertical gradient, suggesting that the presence
359
of vegetation and root systems contributes to the development of the vertical profile. The
360
maximum moisture content in TB1 is also consistently higher than TB4, which suggests that
361
the moisture retention effects of plant roots may have an influence on the effective field
362
capacity of a green roof system.
363
It may be noted that substrate characteristics affect the moisture content vertical profile. The
364
HLS and LECA result in a higher moisture content gradient compared with the SCS,
365
probably due to their higher organic content. The difference between the moisture content in
366
the bottom layer and the layers above is most pronounced for the LECA. This may reflect the
367
LECA’s high proportion of similarly-sized large particles combined with a relatively high
368
proportion of fines. The higher porosity of the LECA also results in more rapid variation of
369
the moisture content during drying and wetting cycles.
370
The data presented in Fig. 3 suggests that, although vertical profiles clearly exist, the
371
temporal changes in moisture content are extremely consistent throughout the substrate depth.
372
For this type of extensive (shallow), green roof system, this justifies the use of a
depth-373
averaged moisture content value for each bed in subsequent analysis.
374
Regular diurnal fluctuations are evident throughout the substrate depth. The daily fluctuation
375
corresponds to temperature variations, with a daily decrease of the moisture content during
376
the central warmer hours of the day reflecting typical ET daily cycles (Poë and Stovin, 2012;
377
Voyde et al., 2010a). There is some evidence of moisture gain during the early hours of the
378
day, which is believed to result from condensation.
379
[Approximate location of Figure 3]
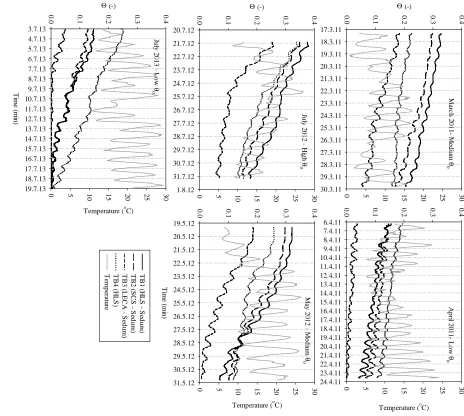
3.3 Moisture content during five selected DWPs 381
In Fig. 4 the depth-averaged moisture content of the four test beds is plotted together with the
382
hourly temperature for the five DWPs characterized by different initial moisture conditions
383
and temperature.
384
As already observed in Fig. 3, it can be clearly seen that the diurnal moisture content
385
variation mirrors the hourly temperature. Between the two cooler periods of March and April
386
2011, 7 minor rainfall events with a total depth of 11.4 mm occurred. These events did not
387
alter the moisture content within the vegetated roofs, but did increase the moisture content in
388
the non-vegetated bed. This can be explained by interception by the well-established plants.
389
The rate of moisture loss is similar for the vegetated beds, while it is lower for the
non-390
vegetated one, thus showing the role of plant transpiration.
391
Irrespective of climatic conditions, changes in moisture content show a consistent influence
392
of substrate moisture content. This is evident when comparing the cooler periods of March
393
and April 2011 with the warmer period of May 2012. Similar behaviour is observed between
394
the vegetated HLS and SCS test beds, as expected considering the similar substrate
395
characteristics. It can be noted that at the volumetric moisture content of approximately 0.15
396
m3m-3 the two curves cross over, indicating lower matric potential in the HLS. This can be
397
explained by its slightly higher porosity. When moisture conditions are restricted (see July
398
2013 in Fig. 4) the same moisture release behaviour was observed for HLS and SCS. This
399
behaviour was observed in the soil-moisture characteristic curves obtained in the pressure
400
plate extraction test (Fig. 2).
401
In the vegetated test beds, it is clear that the soil characteristics influence the initial moisture
402
content, with higher MWHC corresponding to higher θ0 consistently in the order HLS > SCS 403
>> LECA.
[Approximate location of Figure 4]
405
3.4 Daily moisture loss rate 406
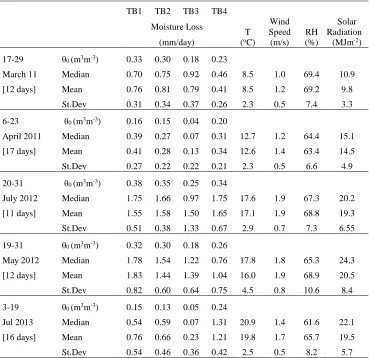
The mean, median and standard deviation of the daily moisture loss and climatic conditions
407
observed for each DWP are reported in Table 2.
408
The DWPs of March 2011 and May 2012 were characterized by similar, medium, θ0 and
409
similar DWP duration. It may be seen that the warmer period had approximately double the
410
moisture loss rate compared with the cooler period. Specifically, mean values of 0.76, 0.81
411
and 0.79 mm/day were observed in March 2011 and 1.83, 1.44, and 1.39 mm/day in May
412
2012 respectively for HLS, SCS and LECA. Comparing the DWP of April 2011 and July
413
2013, both characterized by low θ0 and similar duration, it may be concluded that, even in
414
this case, climatic conditions influenced the moisture loss, with mean values of 0.41, 0.28 and
415
0.13 mm/day in cooler periods and 0.76, 0.66, and 0.23 mm/day in ‘warmer’ periods
416
respectively for HLS, SCS and LECA.
417
Moisture loss data from the three warmer DWPs confirm the strong influence of moisture
418
content on the moisture loss rate. The DWPs are characterized by very similar climatic
419
conditions, but the resulting average moisture loss values - showing July 2012 > May 2012 >
420
July 2013 for the vegetated test beds - depend only on θ0.
421
The DWP of July 2013 lasted 16 days and, as shown by the lower median values of moisture
422
loss especially for LECA, high moisture stress conditions occurred. Plant stress was observed
423
after 11 days in HLS and SCS and after 5 days for LECA. If only the days in which the
424
moisture content was higher than 0.02 m3m-3 are considered, the resulting average moisture
425
loss values were 1.02, 0.84, and 0.79 mm/day, with standard deviation of 0.47, 0.44 and 0.20
426
respectively for HLS, SCS and LECA. These results, if compared with the other DWPs,
consistently confirm the previous conclusions on the influence of climatic conditions and
428
initial moisture content.
429
In Fig. 5 the daily moisture loss rates are plotted together with daily climatic data.
430
It may be seen that the moisture loss rate mirrors the highly varying climatic conditions
431
within these periods. During the March 2011 period, for example, a decrease in temperature
432
and solar radiation and an increase in relative humidity between the 25th and 27th March are
433
reflected in a decrease in moisture across all TBs. This is more apparent in warmer periods
434
where high variability was observed also in the very restricted moisture conditions of July
435
2013.
436
LECA and the non-vegetated HLS generally showed the highest initial moisture loss. This
437
was expected due to the higher porosity of LECA and the lack of vegetation respectively.
438
However, after the first days of the DWPs, the highest moisture losses were recorded in the
439
vegetated HLS and SCS, with the peak rates observed in May 2012 due to the higher
440
temperature, solar radiation and wind speed recorded by the end of month.
441
A decrease in the moisture loss with time was observed in warmer periods or in moisture
442
restricted conditions. However, here the effect of moisture restrictions is largely masked by
443
the variability of climatic conditions and less evident than results from other experimental
444
studies (Berghage et al., 2007; Voyde et al., 2010) and in the laboratory in more controlled
445
conditions (Poë and Stovin, 2012). In the event of March 2011 the daily moisture loss did not
446
show any decrease because the moisture availability remained high and the climate was
447
temperate. It can be noted also that the differences among green roof configurations are more
448
apparent in the warmer periods.
449
[Approximate location of Figure 5]
3.5 Plant transpiration 451
In Fig. 6 the cumulative moisture loss over time is plotted for the five DWPs for TB1 and
452
TB4, which are characterized by the same substrate and respectively with and without
453
vegetation. Similar moisture loss rates were observed at the beginning of each DWP. The
454
effect of plant transpiration is more evident after a few dry days when the level of initial
455
moisture content was medium to low (May 2012 and March 2011). In March 2011, higher
456
moisture losses occurred in TB1 after the 6th dry day due to transpiration, even when
457
temperatures fell (Fig. 5).
458
In non-restricted moisture content conditions, similar moisture losses were observed in both
459
beds at the end of the 10 day DWP in July 2012. Earlier in this DWP, higher moisture loss
460
rates were observed in the unvegetated bed. This suggests that whilst the planted beds may be
461
better at conserving moisture and resisting drought, these beds will have a lower retention
462
capacity for stormwater runoff compared with an unvegetated system.
463
In low initial moisture content conditions, the effect of plant transpiration is not evident and
464
similar moisture loss rates were observed until the plant stressed conditions and wilting point
465
were approached at the 11th day of July 2013 (see Figure 4). In this case, evaporation was
466
higher in TB4 due to the higher initial moisture content (see Table 2).
467
[Approximate location of Figure 6]
468
4 COMPARISON WITH MODELLED DATA
469
The field data presented above has established that, although substrate moisture loss is
470
strongly correlated with temperature, moisture loss rates fall when the moisture available for
471
ET is restricted. In unrestricted moisture conditions, it is reasonable to expect that a standard
472
prediction of Potential ET should provide a useful estimate of the observed moisture loss,
although it is important to appreciate that an ET estimate includes plant moisture losses in
474
addition to substrate moisture losses. It should also be noted that the green roof system
475
components differ in many respects from standard reference crops.
476
Figure 7 clearly shows that the observed daily moisture loss rates are dependent upon the
477
available soil moisture. Rather than show the absolute moisture loss rates, which are strongly
478
influenced by fluctuations in climate, the observed values are plotted relative to the PET
479
value calculated with the 1985 Hargreaves method. Although the data are scattered, there is a
480
clear trend in each case, confirming that moisture loss (and by implication ET) is controlled
481
by moisture availability. The linear relationship confirms that a SMEF in the form of
482
Equation 2 is suitable for this type of data.
483
For TB3 (LECA), the moisture loss in unrestricted conditions is approximately equal to the
484
predicted PET. However, for the HLS and SCS substrates, PET in unrestricted moisture
485
conditions does not provide a good estimate of the daily moisture loss, overestimating the
486
observed values, and the results suggest that it may be appropriate to apply a system-specific
487
correction factor.
488
[Approximate location of Figure 7]
489
4.1 Model implementation
490
Three variants of the moisture loss model (Equations 1 to 3) were applied. Initially Equation
491
1 alone was applied, using both the 1985 Hargreaves and FAO 56 Penman-Monteith methods
492
to predict the relevant daily ET values. Subsequent iterations of the model introduced the
493
SMEF (Equation 2) and finally Equation 2 was substituted with Equation 3 to include Ks, the
494
system-specific correction factor. Appropriate coefficient values were identified using
least-495
squares optimisation. Ks values were determined for each of the vegetated test beds, for the
496
complete set of DWP data combined (Table 3). The optimisation was based on a comparison
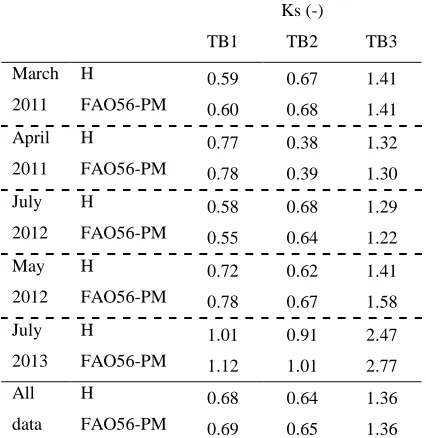
between the measured and modelled moisture content data at each hourly time-step. By using
498
1985 Hargreaves method for PET the obtained Ks values were 0.68, 0.64 and 1.36,
499
respectively for HLS, SCS and LECA. Slightly different values were obtained by using FAO
500
56 Penman-Monteith method: 0.69, 0.65 and 1.36, respectively for HLS, SCS and LECA.
501
Fig. 8 compares the three model implementations with measured data corresponding to two
502
‘warmer’ DWPs, July 2012 and July 2013. These DWPs were characterized by high and low
503
θ0 respectively. Differences between the two PET estimates were not found to be significant;
504
for clarity only the results based on the Hargreaves method are included in the figure.
505
By failing to take into account the effects of moisture restriction on actual ET rates, the
506
simplest model (labelled Hargreaves in Fig. 8), significantly overestimates moisture loss in
507
the green roof substrates. No further analysis of this model is presented. However, it may be
508
seen that the predictions based on Hargreaves + SMEF are considerably better. Model
509
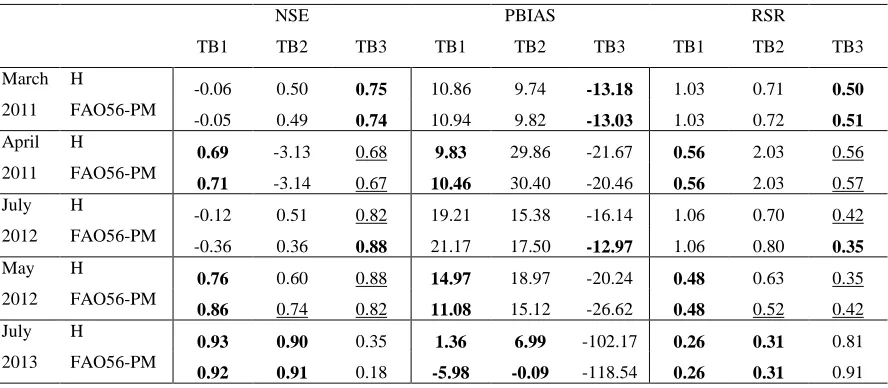
performance statistics for the PET + SMEF model evaluation are reported in Table 4 for all
510
five DWPs and for each vegetated test bed. It may be seen from this that the model predicts
511
the response in the LECA substrate satisfactorily (good to very good NSE and RSR),
512
however PBIAS was only satisfactory. In general the model underestimated the moisture
513
losses in time (PBIAS<0). This is due to the specific characteristics of the LECA, highly
514
porous substrate based on expanded clay. The model did not provide a satisfactory prediction
515
for the July 2013 DWP. This can be explained by highly-restricted moisture conditions that
516
led to the substrate becoming completely dry within 6 days. As might be expected from Fig.
517
7, the models for both HLS and SCS overestimated the moisture losses (PBIAS>0), except
518
for when the moisture content was very low. Of the two PET models, both provided similar
519
accuracy. However, in view of the fact that 1985 Hargreaves requires less input data, this
520
approach is preferable.
[Approximate location of Figure 8]
522
[Approximate location of Table 3]
523
Ks was introduced in the final implementation of the moisture loss model. The single ‘all
524
data’ substrate-specific Ks values have been applied in Fig. 8. The derived Ks values led to
525
significant improvements in the model performance, as shown in Fig. 8 and Table 5. It is
526
therefore proposed to use the 1985 Hargreaves method for PET together with a SMEF
527
function and Ks values of 0.68, 0.64, and 1.36 to estimate moisture losses in green roof
528
characterized by HLS, SCS and LECA substrates respectively and sedum vegetation.
529
Ks values were determined also for individual DWPs (Table 3) and revealed a high level of
530
consistency across all five DWPs. Although noticeably different values were observed for the
531
exceptionally-dry DWP of July 2013, such extreme moisture-stressed conditions are
532
relatively rare, and any uncertainties in their estimation are not critical for stormwater
533
management applications. However, this may suggest that further refinement of the model is
534
required to fully-capture the moisture content behaviour in highly moisture-stressed
535
conditions. The selected DWPs are limited in number and it is not possible to say whether the
536
differences in optimised Ks values for different events on the same test bed reflect real
537
changes in substrate or vegetation or whether they are compensating for errors or
538
uncertainties in the prediction of PET. Nonetheless, the derived system-specific Ks values
539
clearly provide an improvement in the overall performance of the ET predictions.
540
[Approximate location of Table 4]
541
[Approximate location of Table 5]
5 DISCUSSION
543
5.1 Observed substrate characteristics 544
The apparent field capacity observed in the moisture content data should correspond to the
545
MWHC obtained through FLL laboratory tests. Fig. 3 confirms that similar values were
546
obtained, although moisture levels in the unvegetated bed are lower than expected. It has also
547
been observed that in warmer spring and summer periods, when the rainfall event is
548
characterized by a longer previous DWP, the apparent field capacity is reduced relative to
549
MWHC. This can be explained by the fact that the FLL tests are performed on pre-saturated
550
substrate and do not take into consideration the presence of the plant root system that
551
influences the substrate structure or the fact that dry substrates require wetting before their
552
full moisture retention capacity is restored. Compaction of the substrate in the field can also
553
lead to different behaviour during wetting and drying cycles and the possibility of preferential
554
paths for runoff. Furthermore, the organic material is subject to decomposition and probably
555
compaction in time, thus changing the substrate structure and behaviour. Similar issues were
556
discussed by Fassman and Simcock (2012), and further research is required to properly
557
establish the relationships between the FLL-derived MWHC, the pF curve-derived MWHC
558
and actual values of moisture content observed in operational and aging vegetated green roof
559
systems.
560
5.2 Average moisture loss rate 561
The mean values of substrate moisture loss presented in Table 2 provide a useful practical
562
indication of moisture loss rates that might be expected over periods of similar duration to the
563
observed ones (approximately 10 days) as a function of climate and of the substrate's initial
564
moisture content. For example, for the two typical brick-based substrates, loss rates of around
565
1.6 mm/day are associated with high initial moisture content levels and warmer, summer,
conditions. The rate is approximately halved when the initial moisture content is low and in
567
cooler, typical spring, conditions. The lowest rate, around 0.35 mm/day on average, is
568
associated with both cooler conditions and low initial moisture content. It should be noted
569
that these values are only valid for periods of similar duration; if shorter DWPs were of
570
interest, then higher mean loss rates would be expected for the same initial moisture content
571
levels.
572
6 CONCLUSIONS
573
With the purpose of investigating the hydrological processes within green roof systems a
574
comparative long term field monitoring programme has been carried out at the University of
575
Sheffield (UK) since March 2011. This paper focused on the moisture content behaviour in
576
extensive green roofs during dry periods due to evapotranspiration. The study is supported
577
by 29 months continuous monitoring of the moisture content of four green roof test beds
578
characterized by different soil characteristics and with and without vegetation. Water content
579
reflectometers located at three different soil depths were used to measure the soil moisture
580
profile and to record temporal changes in moisture content at a five-minute resolution.
581
The results showed that the moisture content vertical profile varied consistently depending on
582
the substrate characteristics and the presence of vegetation. High temporal resolution data has
583
shown diurnal fluctuations that reflect the daily temperature variations with a daily decrease
584
in the moisture content due to ET during the central warmer hours of the day. Substrate
585
specific average daily moisture loss values were derived for cooler and warmer conditions
586
and for different initial moisture content. The results showed the clear influence of the
587
moisture content on the moisture loss rate due to evapotranspiration, with lower values
588
associated with restricted moisture conditions. The daily moisture loss rate within dry
589
periods mirrored the highly variable climatic conditions, and this masked the expected
exponential decay in the ET rate shown in other studies. The LECA-based green roof showed
591
similar behaviour in daily moisture loss to the non-vegetated roof, with a rapid initial
592
decrease of moisture content. This behaviour may restore the green roof’s retention capacity
593
more rapidly than alternative substrates, but it also increases the occurrence of plant stress
594
conditions. The presence of vegetation resulted in higher daily moisture loss after a few dry
595
days when the initial moisture conditions were medium. The presence of vegetation, if well
596
established and with good surface coverage, not only affected the rate of moisture decrease
597
through transpiration, but also prevented wetting during minor rainfall events. This has
598
important implications for the retention capacity and performance of a green roof.
599
Finally, the observed data have been compared with simulated moisture content using a
600
hydrologic model based on water balance and two Potential ET models (Hargreaves and
601
FAO56 Penman-Monteith) combined with a soil moisture extraction function. The results
602
confirmed the need to apply a soil moisture extraction function. Further improvements in
603
model performance were achieved through the application of configuration-specific
604
correction factors derived from the observed data. These factors account for differences
605
between green roof system substrate characteristics and standard reference crops. The two
606
PET models used did not show significant difference, thus suggesting that 1985 Hargreaves
607
method is preferable due to its more limited data input requirements.
608
LIST OF TABLES AND FIGURES
609
Table 1. Substrate characteristics according to FLL testing method.
610
Table 2. Selected DWPs climatic characteristics and initial moisture content conditions (θ0)
611
together with mean, median and standard deviation of the daily moisture loss measured in
612
each TB.
Table 3. System-specific correction factor (Ks) derived from the observed and simulated data
614
through hydrological model using 1985 Hargreaves (H) and FAO 56 Penman-Monteith
615
(FAO56-PM). Results are reported for the three vegetated test beds and for the five selected
616
DWPs together with the values derived by using the complete set of DWP data.
617
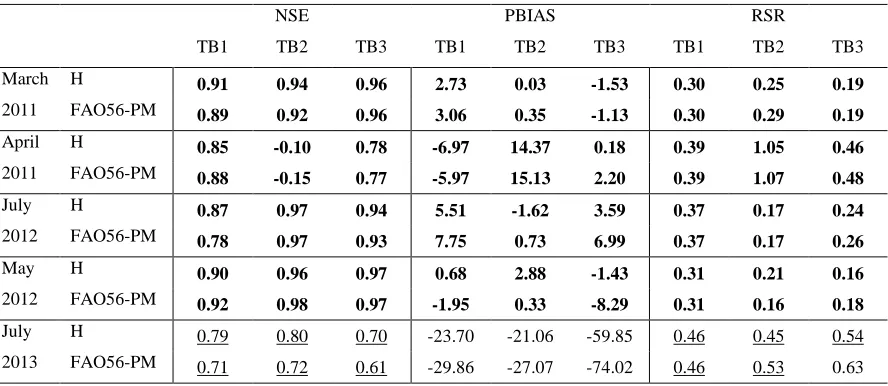
Table 4. Quantitative statistics used for the evaluation of the hydrological model using 1985
618
Hargreaves (H) and FAO 56 Penman-Monteith (FAO56-PM). Results are reported for the
619
three vegetated test beds characterized by different substrates and for the five selected DWPs.
620
The simulations that showed good to very good performance are highlighted in bold, while
621
the underlined values represent the single good to very good statistic.
622
Table 5. Quantitative statistics used for the evaluation of the hydrological model using 1985
623
Hargreaves (H) and FAO 56 Penman-Monteith (FAO56-PM) and applying the
system-624
specific factor (Ks) derived by using the whole set of data. The simulations that showed good
625
to very good performance are highlighted in bold, while the underlined values represent the
626
single good to very good statistic.
627
Figure 1. The experimental site at the University of Sheffield, UK and section view of the
628
green roof test bed with the water content reflectometers (WCR) location within the substrate.
629
Figure 2. Particle size distribution (PSD) of the three tested substrates and moisture release
630
curves resulting from the pressure plate extraction test.
631
Figure 3. Hydrograph, hyetograph and measured moisture content (θ) at 20 (top), 40 (mid),
632
and 60 mm (bottom) from the surface of the tested green roof systems for the month of May
633
2012.
634
Figure 4. Moisture content and temperature behaviour for the four tested green roof
635
configurations and the selected DWPs.
Figure 5. Moisture loss daily rate due to evapotranspiration and evaporation (TB4) in the
637
selected DWPs for the tested green roof systems and observed climatic characteristics: daily
638
temperature (T), wind speed (WS), relative humidity (RH) and solar radiation (SR).
639
Figure 6. Cumulative moisture loss due to evapotranspiration (TB1 – HLS vegetated) and
640
evaporation (TB4 – HLS non-vegetated) for the selected DWPs in Sheffield, UK.
641
Figure 7. Correlation between moisture content (θ) and the daily moisture loss rate divided by
642
the daily PET calculated through 1985 Hargreaves method for the three vegetated systems.
643
The plots include all daily values from the five DWPs.
644
Figure 8. Measured and modelled moisture losses for the three vegetated configurations (TB1
645
–TB2 – TB3) and for the DWPs of July 2012 and 2013 which were characterized by high and
646
low θ0 respectively. Measured data are reported hourly and daily.
647
ACKNOWLEDGMENTS
648
This research was carried out within the Project GREEN ROOF SYSTEMS - Collaborative
649
Research and Development of Green Roof Systems Technologies (Project no. 230636)
650
funded within the EU FP7 Marie Curie Industry-Academia Partnerships and Pathways
651
(IAPP). The authors would like to acknowledge the personnel of ZinCo, industrial partner of
652
the project and in particular, Ralf Walker, Jörg Werdin and Ruzica Mohorko. The authors
653
would like to acknowledge also Dr. Ros Schwarz and Dr. Zoe Dunsiger for their contribution
654
in establishing the monitoring programme.
655
REFERENCES
656
Allen, R. G., Pereira, L. S., Raes, D., and Smith, M., 1998. Crop Eapotranspiration:
657
Guidelines for Computing Crop Water Requirements. Irrigation and Drainage Paper 56,
658
United Nations Food and Agriculture Organization, Rome.
660
Campell Scientific, Inc., 2006. CS616 & CS625 Water Content Reflectometers User Guide.
661
2002-2003, issued Aug 2006.
662
663
Carter, M.R., 1993. Soil Sampling and Methods of Analysis (Lewis Publishers, CRC Press,
664
1993.
665
666
Coutts, A.M., Daly, E., Beringera, J. and Tappera, N.J., 2013. Assessing practical measures
667
to reduce urban heat: Green and cool roofs, Build. Environ. 70, 266–276.
668
669
Berghage, R. D., Jarrett, A. R., Beattie, D. J., Kelley, K., Husain, S., Rezaei, F., Long, B.,
670
Negassi, A., Cameron, R., Hunt, W. F., 2007. Quantifying Evaporation and Transpirational
671
Water Losses from Green Roofs and Green Roof Media Capacity for Neutralizing Acid Rain.
672
National Decentralized Water Resources Capacity Development Project. University Park,
673
Pennsylvania: Penn State University.
674
675
Dunnett N and Kingsbury N, 2004, Planting Green Roofs and living Walls, Timber Press,
676
Cambridge, UK.
677
678
Emilsson, T., Berretta, C., Walker, R., Stovin, V., Dunnett, N. 2012. Water in Greenroof
679
Substrates – Linking Physical Measurements to Plant Performance. Proceedings of the World
680
Green Roof Congress, 18-21 September 2012, Copenhagen, Denmark
681
682
Farrell, C., Ang1, X. Q., Rayner J.P., 2013. Water-retention Additives Increase Plant
683
Available Water in Green Roof Substrates. Ecol. Eng. 52 (2013) 112–118.
685
Fassman, E., Simcock, R., 2012. Moisture Measurements as Performance Criteria for
686
Extensive Living Roof Substrates. J. Environ. Eng. 138 (8), 841-851.
687
688
FLL (Forschungsgesellschaft Landschaftsentwicklung Landschaftsbau), 2008. Guidelines for
689
the Planning, Construction and Maintenance of Green Roofing. Bonn, Germany:
690
Forschungsgesellschaft Landschaftsentwicklung Landschaftsbau e.V.
691
692
Gupta, H.V., Sorooshian, S., Yapo, P.O., 1999. Status of Automatic Calibration for
693
Hydrologic Models: Comparison with Multilevel Expert Calibration. J. Hydrol. Eng. 4 (2),
694
135-143
695
696
Hargreaves, G.H., Allen, R.G., 2003. History and Evaluation of Hargreaves
697
Evapotranspiration Equation. J. Irrig. Drain Eng. 129, 53-63.
698
699
Hargreaves, G.L., Samani, Z.A., 1985. Reference Crop Evapotranspiration from
700
Temperature. Appl. Eng. Agric., 1~2, 96–99.
701
702
Hillel D., 1971. Soil and water: physical principles and processes, Academic Press, London.
703
704
Hilten, R.N., 2005. An analysis of the energetics and stormwater mediation potential of
705
greenroofs. Master of Science Masters, University of Georgia.
706