This is a repository copy of
Joint optimization of power, electricity cost and delay in IP over
WDM networks
.
White Rose Research Online URL for this paper:
http://eprints.whiterose.ac.uk/82552/
Proceedings Paper:
Dong, X, Elgorashi, TEH and Elmirghani, JMH (2013) Joint optimization of power,
electricity cost and delay in IP over WDM networks. In: 2013 IEEE International
Conference on Communications. ICC 2013 - 2013 IEEE International Conference on
Communications, 9-13 June 2013, Budapest, Hungary. IEEE , 2370 - 2375.
https://doi.org/10.1109/ICC.2013.6654885
[email protected] https://eprints.whiterose.ac.uk/ Reuse
Unless indicated otherwise, fulltext items are protected by copyright with all rights reserved. The copyright exception in section 29 of the Copyright, Designs and Patents Act 1988 allows the making of a single copy solely for the purpose of non-commercial research or private study within the limits of fair dealing. The publisher or other rights-holder may allow further reproduction and re-use of this version - refer to the White Rose Research Online record for this item. Where records identify the publisher as the copyright holder, users can verify any specific terms of use on the publisher’s website.
Takedown
If you consider content in White Rose Research Online to be in breach of UK law, please notify us by
1"
Joint Optimization of Power, Electricity Cost and Delay in
IP over WDM networks
Xiaowen Dong1, Taisir E. H. El-Gorashi1 and Jaafar M. H. Elmirghani1,2
School of Electronic and Electrical Engineering, University of Leeds, LS2 9JT, United Kingdom1
Department of Electrical and Computer Engineering, King Abdulaziz University, Jeddah, Kingdom of Saudi Arabia2
AbstractÑIn this paper, we investigate the joint optimization of
power, electricity cost and propagation delay in IP over WDM networks employing renewable energy. We develop a mixed integer linear programming (MILP) model to jointly minimize the three parameters and compare its results to the results of optimizing these parameters individually. The models results show that the joint optimization maintains the power consumption and electricity cost savings obtained by the non-renewable power-minimized and the electricity cost-power-minimized models while hardly affecting the propagation delay. Compared to the delay-minimized model, the joint optimization model achieves power consumption and electricity cost savings of 73% and 74%, respectively under the non-bypass approach considering a unicasting traffic profile. The power and cost savings under an anycasting traffic profile increases to 82%.
I. INTRODUCTION
The energy consumption and CO2 emissions associated with information and communication technology (ICT) networks are increasing rapidly as a result of the network expansion in bandwidth and reach.
Today the energy consumption of networks is a significant contributor to the total energy demand in many developed countries; for example, in 2005 the energy consumption of the Telecom Italia network was more than 2TWh which is about 1% of the total Italian energy demand [1]. In the winter of 2007, British Telecom became the largest single power consumer in the UK accounting for 0.7% of the total UKÕs energy consumption [2].
Given the ecological and economic drivers, significant research efforts are increasingly being focused on reducing the energy consumption of ICT networks. A significant literature body exists on power-awareness in mobile ad-hoc and wireless networks [3], and computer architecture [4]. However, many challenges need to be addressed to develop and deploy energy
efficient wired networks. In 2003 Gupta et al. [5] introduced
the concept of Ògreening the internetÓ. In our previous work, we have studied different energy efficiency approaches in optical networks. In [6], we have investigated reducing the CO2 emission of backbone IP over WDM networks by introducing renewable energy sources. In [7], we have studied the power consumption of IP over WDM networks with data centres and have investigated the problem of whether to locate data centres next to renewable energy or to transmit renewable energy to data centres. In [8], we have investigated energy-efficient physical topologies in IP over WDM networks considering different IP over WDM approaches, nodal degree constraints, traffic symmetry and renewable energy availability. We have also reconsidered the physical topology design optimization
taking into account the embodied energy of the network devices [9].
In [10], the authors investigated the benefit of making use of the difference in electricity price at different time intervals of the day for networks covering different time-zones. They showed that up to 13 % savings in the electricity bill can be achieved compared to conventional routing. In [11] an end-to-end delay problem in overlay networks is investigated for multicast services by using a Tabu search heuristic. In [12], the authors proposed a new algorithm to minimize the maximum delay for individual flows while meeting demand requirements
for multiple source-sink pairs.
However, to the best of our knowledge, no work in the literature has considered jointly minimizing energy, electricity cost and propagation delay. In this paper, we investigate the impact of optimizing each of the three parameters individually on the others and show how jointly minimizing them compares to individual minimization.
The remainder of the paper is organized as follows: In Section II, the joint optimization MILP model for hybrid-power IP over WDM network is introduced. Section III presents and analyzes the results. Finally, the paper is concluded in Section IV.
II. POWER-PRICE-DELAY MILP MODEL FOR IP
OVER WDM NETORKS
IP over WDM networks consist of two layers, the IP layer and the optical layer. In [6] we explained the detailed architecture of IP over WDM networks. Two approaches are used to implement IP over WDM networks: lightpath non-bypass and non-bypass [13]. With lightpath non-non-bypass, all the lightpaths passing by an intermediate node are terminated, processed and forwarded by IP routers. On the other hand, under the bypass approach intermediate nodes allow all the lightpaths that are not destined to them, to be directly bypassed via a cut-through. Therefore the total number of IP router ports, the major power consuming systems in an IP over WDM network, is significantly decreased under the bypass approach and consequently the power consumption of IP over WDM networks is reduced.
2"
over WDM network.
In this paper, we build a MILP model to jointly minimize the non-renewable power consumption, electricity cost and delay in hybrid-power IP over WDM networks. We consider similar assumption to those in [6] where we assumed that the renewable energy is available to power IP router ports and transponder in a limited number of nodes in the network. We also assume that the nodes with access to renewable energy can also be powered by non-renewable energy to guarantee QoS when the renewable energy output becomes low.
To keep the model linear, the delay is represented as a function of the length of the lightpaths the traffic demands travel through instead of the length of the physical links. Therefore, we assume that traffic demands are not allowed to split.
The model defines the following parameters:
T Set of time points
N Set of nodes
!"! Set of neighbouring nodes of node i in the optical layer
i and j Denote end points of a virtual link in the IP layer
s and d Denote source and destination of a traffic demand
m and n Denote end points of a physical link in the optical layer
!!" The length of the link between nodes m and n
S Distance between neighbouring EDFAs
W The number of wavelengths in a fibre
B The capacity of a wavelength
!!"# Traffic demand between source s and destination d at time t
!"!" The number of EDFAs on physical link (m,n).
Typically !"!"! !!"!! ! ! ! !![6]
PR Power consumption of a router port
PT Power consumption of a transponder
PE Power consumption of an EDFA
!"!" The maximum output power of the renewable energy source in node i at time t.
!"#$%!" The price of electricity in node i at time t
The following variables are also defined:
!
!"# The number of wavelength channels in the virtual
link (i, j) at time t in the IP layer which use non-renewable energy
!"!"# The number of wavelength channels in the virtual
link (i, j) at time t in the IP layer which use renewable energy
!!"# The number of wavelength channels on physical link (m, n) at time t in the optical layer which use non-renewable energy
!"!"# The number of wavelength channels on physical link (m, n) at time t in the optical layer which use renewable energy
!!"#!" The number of wavelength channels in the virtual
link (i, j)that traverse physical link (m, n)at time t !
!"#
!" !
!"#
!"
=1 if traffic flow from node s to node d traverses the virtual link (i, j) at time t, otherwise !!"#!"=0
!!" The number of fibres on physical link (m,n)
As mentioned above the MILP model objective function jointly minimizes the non-renewable power consumption, electricity cost and delay. Under the lightpath bypass approach these parameters are defined as:
1) The non-renewable power consumption of the network at
time t (!"#!):
!"#!! !"! !!"#
!!!!!!! !!!
! !"! !!"#
!!!"! !!!
! !"!!"!"! !!"
!!!"! !!!
(1)
2) The electricity cost at time t (!"!):
!"!! !"#$%!"!!"! !!"#
!!!!!!! !!!
! !"#$%!"!!"! !!"#
!!!"! !!!
! !"#$%!"!!"!!"!"
!!!"! !!!
! !!"
(2)
3) The delay given as the total lightpath length of the network
at time t !!"!):
!"!! !!"#
!"
! !!" !!!!!!!
!!! !!!!!!! !!!
(3)
The MILP model is defined as follows:
Objective: minimize
! ! !"#! !!!
!! ! !"!
!!!
! ! ! !"!
!!!
(4)
We introduce the factors α, β and γ to scale the three parameters
to reflect their importance in the design. Note that while
parameter ! is unitless, parameter ! and ! have units of Watt/$ and
Watt/s. Subject to: ! !"# !" !!!!!!! ! ! !"# !" !!!!!!! !
! !"!! ! !
!! !"!! !!
! !"!!"#$%!
!!!! ! !! !!!! !! ! ! !! ! ! !
(5)
!!!"#!"
!!!!!!! !!!
! !!"#! ! !!!"#!!"!"#! ! !
!!!! ! !! !!!! ! ! !! ! ! ! (6) ! !"# !" !!!"! ! ! !"# !" !!!"! !
!!"#!!"!"# !"!! ! !
!!!"#!!"!"# !"!! ! ! ! !"!!"#$%!
!!!!!!!!
!!!!!! ! !! !!!! !! ! ! !!!! ! !
3" !"!!"!"#
!!!!!!!
! !"!!"!"#
!!!"!
!!"!"
!!!! ! !! !!! ! !
(8)
!!"#!"
!!!!!!! !!!
! ! ! !!"!!!!!
!!!! ! !! !!!! ! !! ! !!"!
(9)
!!"#!" !
!!!!!!! !!!
!!"#!!"!"#!
!!!!!! ! !! !!!! ! !! ! !!"!!!!!!!!
(10)
Constraint (5) represents the flow conservation constraint in the IP layer. It ensures that in all nodes the outgoing traffic is equal to the incoming traffic except for the source and the destination nodes. It also ensures that a traffic flow is transmitted through a single route (traffic flows are not allowed to split). Constraint (6) ensures that the summation of all traffic flows through a virtual link does not exceed its capacity. Constraint (7) represents the flow conservation constraint in the optical layer. It represents the fact that in all nodes the total outgoing wavelengths of a virtual link should be equal to the total incoming wavelengths except for the source and the destination nodes of the virtual link. Constraint (8) ensures that at each node the renewable power consumption of router ports and transponders does not exceed the maximum output power of the renewable energy source. Constraints (9) and (10) represent the physical link capacity constraints. Constraint (9) ensures that the total number of wavelength channels in virtual links traversing a physical link does not exceeded the maximum capacity of fibres in the physical link. Constraint (10) ensures that the number of wavelength channels in virtual links traversing a physical link is equal to the number of wavelengths in that physical link.
The model can be extended to represent the non-bypass approach by redefining the non-renewable power consumption
of IP ports at time t as follows:
!"! !!"#
!!!"! !!!
Therefore the network non-renewable power consumption at
time t (Equation (1)) and the electricity price at time t (equation
(2)) become:
!"#!! !"! !!"#
!!!"! !!!
! !"! !!"#
!!!"! !!!
!
! !"!!"!"! !!"
!!!"! !!!
(11)
!"!! !"#$%!"!!"! !!"#
!!!"! !!!
! !"#$%!"!!"! !!"#
!!!"! !!!
! !"#$%!"!!"!!"!"
!!!"! !!!
! !!"
(12)
and constraint (8) is replaced by:
!"!!"!"#
!!!"! !!!
! !"!!"!"#
!!!"!
!!"!"
!!!! ! !! !!! ! ! (13)
III. RESULTS AND ANALYSIS
The NSFNET network, depicted in Fig. 1, is considered as an example of a real world network to evaluate the optimization models of the IP over WDM networks. As the NSFNET covers the US, different parts of the network fall into different time zones, i.e. nodes experience different traffic demands at any given point in time. The US is covered by four time zones: Eastern Standard Time (EST), Central Standard Time (CST), Mountain Standard Time (MST) and Pacific Standard Time (PST). There is an hour time difference between each time zone and the next; we use EST as the reference time.
The average traffic demand between each node pair in the NSFNET on different time zones [6][14], shown in Fig. 2(a), ranges from 20 Gb/s to 120 Gb/s and the peak occurs at 22:00. We assume that the traffic demand between each node pair in the same time zone is random with a uniform distribution and no lower than 10 Gb/s.
1 2
6 5
10 4
3
7
8 9
11
12
14
13
Pacific Standard Time (PST)
Mountain Standard Time
(MST)
Central Standard Time (CST)
Eastern Standard Time (EST)
Fig.1. The NSFNET network with time zones
Fig.2(a). Average traffic demand in different time zones
4"
Similar to [6], we consider solar energy as the renewable energy source. We consider the maximum output power of
solar energy cells to be 120 kW. A solar panel area of 375 m2
[17] is needed to generate such a value. Solar panels with such a surface area can be practically built in a typical core routing node location. Due to the high cost of manufacturing and installing the solar panels, we assume the solar energy is available only at 5 nodes. The optimal locations of these nodes are given as nodes 4, 5, 6, 7 and 9 [6]. Fig. 2(b) gives the output power of the solar energy source.
Table I shows the input parameters in terms of number of wavelengths, wavelength capacity, distance between two neighbouring EDFAs, and the power consumption of different components in the network. The power consumption values are derived from Cisco 8-slot CRS-1 data sheets [15], and others are derived from [6] and Cisco ONS 15454 data sheets [16].
As in [9], we consider the electricity price to vary throughout the day. The day is divided into three tiers. In Tier 1 (22:00-6:00), the price is half of the base price, in Tier 2 (6:00-18:00) the price is the base price and in Tier 3 (18:00-22:00) the price is 1.75 times of the base price. The electricity price for different nodes of NSFNET is given in [18]. Table II gives the details of the electricity price of different node in the NSFNET at different times of day.
Note that because of the high cost of solar panels, the cost of electricity produced by solar panels is relatively high (0.38 $/kWh [19]) compared to electricity from non-renewable sources. However, we do not consider this cost in the optimization problem as we assume that the solar cells are already installed so using electricity produced by them will not create extra cost. An interesting extension of this work will be to consider the cost of electricity produced by renewable energy sources by optimizing the number and location of nodes deploying renewable energy sources.
To solve the MILP model, we use the AMPL/CPLEX software on a Core2 2.8GHz PC with 4GB memory.
In the following results we consider four optimization scenarios. We optimize the routing over IP over WDM networks to individually minimize the non-renewable power
consumption, electricity cost and delay by setting (! ! !! ! !
!,!! ! !), (! ! !! ! ! !,! ! !) and delay (! ! !! ! ! !,! !
!), respectively. We compare the results of the individual
optimization scenarios with the case when we jointly optimize the three parameters.
TABLE I
INPUT PARAMETERS FOR MILP MODEL
Distance between two neighboring EDFAs (S) 80 (km)
Capacity of each wavelength (B) 40 (Gb/s)
Energy consumption of a router port (PR) 1000 (W) Energy consumption of a transponder (PT) 73 (W) Energy consumption of an EDFA (PE) 8 (W)
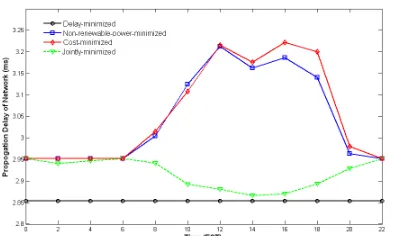
Fig. 3 gives the non-renewable power consumption, electricity cost and propagation delay of the NSFNET network under the different optimization scenarios considering the bypass approach. In Fig. 3(a) and Fig. 3(b), the non-renewable power consumption and electricity cost show similar trends for the different optimization scenarios. Compared to optimizing
[image:5.612.330.545.203.524.2]delay only, the other optimization scenarios achieve power consumption and electricity cost savings up to 66% and 55%, respectively. In Fig. 3(c), the non-renewable power-minimized and the electricity cost-minimized models have increased the propagation delay average by 7% compared to the delay-minimized model. However, the joint optimization of the three parameters has limited the increase in the propagation delay to 2% while, as seen in Fig.3(a) and Fig.3(b), it has maintained the non-renewable power consumption and the electricity cost achieved by the power-minimized and the cost-minimized models, respectively.
TABLE II
ELECTRICITY PRICE IN DIFFERENT NODES OF NSFNET AT DIFFERENT TIMES OF DAY (Cent/kWh)
Time
Node Tier 1 Tier 2 Tier 3
1 6.5 22.8 13
2 3.8 13.3 7.6
3 6.5 22.8 13
4 3.5 12.2 7
5 4.6 16 9.2
6 4.9 17 9.7
7 3.8 13.2 7.6
8 3.9 13.4 7.7
9 3.9 13.5 7.7
10 4.7 16.4 9.4 11 8.2 28.8 16.5 12 7.4 25.7 14.7 13 5.3 18.6 10.6 14 4.4 15.2 8.7
Fig.3(a) The non-renewable power consumption under different optimization scenarios with the bypass approach
[image:5.612.38.297.590.648.2]5"
Fig.3(c) The propagation delay under different optimization scenarios with the bypass approach
Fig.4(a) The non-renewable power consumption under different optimization scenarios with the non-bypass approach
Fig.4(b) The electricity cost under different optimization scenarios with the non-bypass
Fig.4(c) The propagation delay under different optimization scenarios with the non- bypass approach
Fig. 4 gives the results under the different optimization scenarios considering the non-bypass approach. Similar trends to those in Fig. 3 are observed. Compared to the delay-minimized model the power consumption and electricity cost
savings achieved by the joint optimization increase to 73% and 74% respectively, while hardly affecting the delay.
The above results are obtained under a unicasting traffic scenario. In the following results we investigate the energy savings achieved by jointly minimizing the three parameters under an anycasting scenario where a number of data centres with replicated content exist in the network and nodes can download data from any of them. We extend the MILP model in Section II to support an anycasting scenario. In addition to the parameters in Section II, the following parameters are introduced:
NN Set of regular node
D Set of data centres
In addition to the variables in Section II, we define the following variable:
!!"#$ !!"#! ! if regular node ! downloads data from
data centre ! instead of data centre ! at time t,
otherwise !!"#$! !
and the variable !!"#!" in Section II is replaced by:
!
!"# !"#
!
!"# !"#
! ! if regular node ! downloads data from
data centre ! instead of data centre ! and the
traffic demand traverses the virtual link (i, j) at
time t, , otherwise !
!"# !"#
! !
The extended model has the same objective function and constraints as the model in Section II except that Constraint (5) is replaced by:
! !"# !"#
!!!!!!!
! !
!"# !"#
!!!!!!!
!
!!!!"# !"
!! ! !
!!!"#$ !"!! !!
! !"!!"#$%!
!!!! ! !! !!! ! !!! ! ! !
(14)
and a new constraint is added: !!"#$
!!!
! !
!!!! ! !! !!! ! !!! ! ! !
(15)
Constraint (15) implies that a regular node can only download from one data centre.
We consider the NSFNET network to evaluate the optimization problem under the anycasting traffic profile. We only consider the download traffic between regular node and data centre node. The traffic demand between data centres and nodes is assumed to be 1.5 of the regular traffic demand in
Fig.2(a).We assume data centres are located in nodes 3, 5, 8,
10 and 12.
[image:6.612.76.273.55.173.2] [image:6.612.55.285.151.664.2]6"
Fig.5(a) The non-renewable power consumption under different optimization scenarios with the non-bypass approach considering
anycasting traffic profile
Fig.5(b) The electricity cost under different optimization scenarios with the non-bypass considering anycasting traffic profile
Fig.5(c) The propagation delay under different optimization scenarios with the non- bypass approach considering anycasting traffic profile
IV. CONCLUSION
This paper has studied the joint optimization of power, electricity cost and propagation delay in hybrid-power IP over WDM networks. A MILP model is developed to jointly minimize the three parameters considering unicasting and anycasting traffic profiles. The results show that considering a unicasting traffic profile, the joint optimization model achieves power consumption and electricity cost savings of 73% and 74%, respectively compared to the delay-minimized model under the non-bypass approach while hardly affecting the delay. Similar trends are obtained under the anycasting traffic profile with power and cost savings up to 82%.
ACKNOWLEDGMENT
The authors would like to thank the EPSRC for funding this work. They also would like to thank their collaborators at the University of Cambridge, Cambridge, U.K., for useful discussions.
REFERENCE
[1] Telecom Italia Website, ÒThe EnvironmentÓ
[2] BT Press, ÒBT announces major wind power plans,Ó Oct. 2007
[3] C. Jones, M. Sivalingam, P. Agrawal, and J. Chen, ÒA Survey of Energy Efficient Network Protocols for Wireless Networks ,Ó Wireless Networks, vol. 7, no. 4, pp. 343Ð358, July 2001.
[4] T. Pering, T. Burd, and R. Bordersen, ÒThe Simulation and Evaluation of Dynamic Voltage Scaling Algorithms,Ó in Proceedings of the International Symposium on Low Power Electronics and Design, Monterey, CA, pp. 76-81, August 1998.
[5] M. Gupta and S. Singh, ÒGreening of the Internet,Ó in Proc.ACM SIGCOMM, Aug. 2003.
[6] Xiaowen Dong, Taisir El-Gorashi and Jaafar M. H. Elmirghani ÒIP Over WDM Networks Employing Renewable Energy Sources,Ó IEEE/OSA Journal of Lightwave Technology, vol. 29, No. 1, pp. 3-14, 2011. [7] X. Dong, T. El-Gorashi, J.M.H Elmirghani, ÒGreen IP Over WDM
Networks With Data CentersÓ, IEEE/OSA Journal of Lightwave Technology vol. 29 , Issue: 12, pp. 1861 Ð 1880.
[8] X. Dong, T. El-Gorashi, J.M.H Elmirghani, ÒOn the Energy Efficiency of Physical Topology Design for IP over WDM NetworksÓ, IEEE/OSA Journal of Lightwave Technology vol. 30, Issue 5, 2012.
[9] X. Dong, A. Q. Lawey, T. El-Gorashi, J.M.H Elmirghani,, ÒEnergy-Efficient Core NetworksÓ Proc. 16th IEEE Optical Network Design and
Modelling conference (ONDMÕ12), Colchester, UK, 17-20 April 2012, invited paper.
[10]Cavdar, Cicek, Yayimli, Aysegul and Wosinska, Lena, ÒHow to cut the electric bill in optical WDM networks with time-zones and time-of-use prices,Ó Optical Communication (ECOC), 2011.
[11]Lee, C.Y., Hyo Jung Park and Jin woo Baek, ÒAn Overlay Multicast to Minimize End-to-end Delay in IP Networks,Ó Communication Technology, ICCT '06, 2006.
[12]Fabrizio Devetak_, Junghwan Shiny, Tricha Anjali and Sanjiv Kapoory, ÒMinimizing Path Delay in Multipath Networks,Ó IEEE ICC, 2011. [13]G. Shen and R. S. Tucker, ÒEnergy-Minimized Design for IP Over WDM
Networks,Ó Optical Communication and Networking, vol.1, pp. 176-186, 2009.
[14]Y. Chen and C. Chou, ÒTraffic Modeling of A Sub-network by using ARIMA,Ó Info-tech and Info-net, Proceedings, ICII-2001. Vol. 2, pp. 730-735.
[15]Data sheet of CRS-1 16 slots chassis power systems. [16]CiscoÕs ONS 15454 data sheets.
[17]J. Zhao, A. Wang, P. P. Altermatt S. R. Wenham and M. A. Green, Ò24% Efficient Silicon Solar Cells,Ó Photovoltaic Energy Conversion, Twenty Fourth. IEEE Photovoltaic Specialists Conference, vol. 2, pp. 1477-1480, 1994
[18]Average Retail Price of Electricity to Ultimate Customers by End-use Sector, by State, EIA - US Energy Information Administration