11111111111111111
I
III
I
!I
-~
I
l
COMMISSION OF THE EUROPEAN COMMUNITIES
Brussels, 22 October 1979
FARM ACCOUNTANCY
DATA NETWORK
FOR THE
EEC
RESULTS
«1977»
Directorate-General for agriculture - Directorate : General matters
.
" .. :• I ,
I ,' ,. , l
' ,·
' . .t· ' .. 1 ~
. 'J~ '
·'
·
....
'•.'•
•• · o ( · . '
' • . '
I I \ :
II' l ··~· ...
''·, '.· .·''· .... '·'
..
i··'
. FADN
~:-RESULTS ~1~77".~:
CORRIGENDUM ·
' ..! ..
\Page
37
Line
.IV
Pigs
and·
poul.try, Belgian sample Lab. inc./ALU CEUA)
"1976"
"1977"
,\1976"•,100
1
1
8041. ·· 10.818
I
139
.I
P~ge
46
Li·ne
440 Engl•nd. Ea•t Region·, Colull)n ·1, 5
~
10
cows per holding.
The figure
7'792
shoul~
be
corr~ct~d
to
3 792
·
Page
.47
Footno.tes ·
.
d) Farm have been classified·
.
by "1977"
c1racteristtcs~·
' '
I
Page
50
Lin~
5
Gross·production/ha
I
"1973-"1975"
~
100
Column
1,
~
10
~
20
ha, the figure
165
should be corrected to
115.
.
.
'II
t·
l'
,·
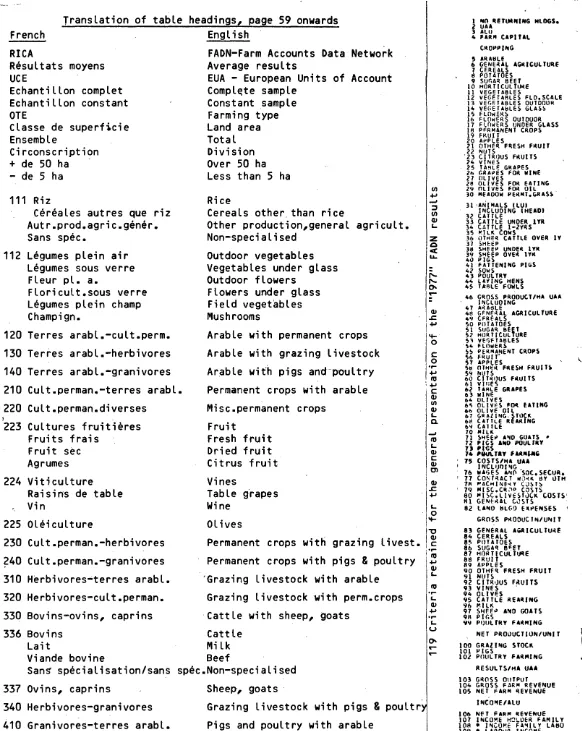
[image:3.599.7.587.21.838.2]French
Translati9n of table headings, page 59 onwards
English
RICA
Resultats moyens
UCE
Echantillon complet
Echantillon constant
OTE
Classe de superficie
Ensemble
Circonscription
+
de 50 ha
·
- de
5
ha
111 Riz
Cereales autres que riz
Autr.prod.agric.gener.
Sans spec.
112 Legumes plein air
Legumes sous verre
Fleur pl. a.
Floricult.sous verre
Legumes plein champ
Champign.
120 Terres arabl.-cult.perm.
130 Terres arabl.-herbivores
140 Terres arabl.-granivores
210 Cult.perman.-terres arabl.
220 Cult.perman.diverses
~
223 Cultures fruitieres
Fruits frais
Fruit sec
Agrumes
224 Viticulture
Raisins de table
Vin
225 Oleiculture
230 Cult.perman.-herbivores
240 Cult.perman.-granivores
310 Herbivores•terres arabl.
320 Herbivores-cult.perman.
330 Bovins-ovins, caprins
336 Bovins
Lait
Viande bovine
FADN-Farm Accounts Data Network
Average results
EUA - European Units of Account
Compl~te
sample
Constant sample
Farming type
Land area
Total
Division
Over 50 ha
Less than 5 ha
Rice
Cereals other. than rice
Other production,general agricult.
Non-specialised
Outdoor vegetables
Vegetables under glass
Outdoor flowers
Flowers under glass
Field vegetables
Mushrooms
Arable with permanent crops
Arable with grazing livestock
Ar_able wit'h pigs and .... poultry
Permanent crops with arable
Misc.permanent crops
Fruit
Fresh fruit
Dried fruit
Citrus fruit
Vines
Table grapes
Wine
Olives
Permanent crops with grazing livest.
Permanent crops with pigs
&
poultry
'Grazing livestock with arable
Grazing livestock
~ithperm.crops
·Cattle with sheep, goats
Cattle
Milk
Beef
San~
specialisation/sans spec.Non-specialised
337
340
410
Ovins, caprins
Herbivores-granivores
Granivores-terres arabl.
Sheep·, goats
Grazing livestock with pigs
&
poultr
Pigs and poultry with arable
z
Q
ct
LL.
CIJ
.s::.
+'
'+-0
c
0.,..
.f-1
"'
+'
·c
CIJ
U)
CIJ
'-c.
....I"'
L. CIJ
c
CIJ Cl CIJ
.s::.
.f-1
'-0
'+-l
-gc
1"::0
.f-1CIJ
'-.,..
L. CIJ
.f-1
.,..
L.
u
430. Granivores-herbivores
Pigs and poultry with grazing livest.
448 Porcins
Pigs
Elevage
Bree_ding
Engraissement/engrais
Feeding
Sans specialisation/sans spec.Non-specialised
'449 Volailles
Poultry
·sso
Orientation
diversifi~
No predominant farming type
I ~0 ~ET~NING HlOGSe
2 UAA l ALII
4 FARI'I CAPITAL tROPPlr.G 5 ARAHlf
6 G€NE~AL AGMICULTU~f
1 CF.RE4LS It POTATOES
9 sur.A~ BEET
10 HOR T I CUL TUitE 11 VEGETABLES
12 VEGf.TARLES FLO.SCALE 13 VEGETABLES OUTDOOR 14 VEGETAbLE§ GLAS~
1'> fLOWER§ lb FLOWERS OUTDOOR
17 FLOWERS UNDER GlASS 18 PFRMANENT CROPS
19 fi>.UI T
20 Ai'PLES
21 OTHE~ FRESH FRUIT
22 NUTS
"23 tlTROUS FRUITS
24 VINES
25 TA~LE GMAPES
2h GRAPES FOR WINE
~J 8tl~~~
FOR EATING29 OLIVES FO~ OIL
30 MEADOW
PE~MT.GRASS-31 •ANIMALS CLUJ
INCLUDING CHElDl 32 CATTLE
33 CATTLE UNDER lYM 34 CATTLE l-2YRS
35 ~ILK COWS
3b ulMER CATTLE OYER IY
37 SHHP
38 SHEEP UNDER lYR
39 SHEEP OVER lYR
40 PIGS
41 FATTENING PIGS
42 sows
43 POULTRY
44 LAYING HENS
45 TARLE FOWI.S
46 GROSS PRODUC.T/HA UAA INCLUDING
47 A~A~LE
4~ GFNE~AL AGRICULTURE
4'1 C.FREALS
~0 POTATOES
. Sl SUGA~ bEET
S2 HORTICULTURE
Sl VEfJFTAbLES ·~4 FLOWERS
S~ PERMANENT CROPS
5b FRuiT·
57 APPLeS
S~ OTHE~ FKES~ FRUIT~
5'1 ~UTS
bO CJTROUS fKUITS 61 vtr:ES
6l l AKLE GRAPES
63 WINE
b4 OLIVES
6~ OLIVtS f~ EATING
6b OL (VE Oil
b1 GRAZING-SJOCK
b8 CATTLE REA~ING
6'1 C. A TTI.E
10 MILK
71 SHHI' A~O GOATS •
72 PIGS INO POULJRY
U f'IGS
74 fi~TAY FA·N~'
' 75 COSTS/HA UAI
INCLIJOI~G ..
76 WAGES ANn SOt.SECURe
' 77 CONf~ACT WJ~K ~y UTH
1R ~AC~INf~Y C~~J~
' 79 MISC.CR~P COSTS
80 ~ISC.LIVtSTuCK COSTS'
~~ GENF.~AL C~STS
82 lA~O bLG~ E~t~EN~ES '
GROSS P~OOUCTN/UNIT
83 GENERAL A~ICULTU~E
84 CEREALS
85 POU TOES
8b SUGAq B,::H
87 HOIH I CUlTIJI\E
118 FRUIT
89 APPLES
90 OTHF~ FRESH FRUIT
~~ NUTS
9Z CITR~US F~UITS
93 VINES .
94 OLIYF.S
95 CATTLE REA~ING
9h ~ILK
91 SHfE~ AND GOATS
9R PIGS
~~ PQULTRY FA~MING
NET PROOUtTION/UNIT
100 GRAZING STOCK
101 PIGS
102 POULTRY FARMING
RESULTS/HI UAA 103 GRClSS OIITPUT
104 G~OSS FAR~ REVE~UE
105 NET FARM ~EYENUE
I"CO,.E/AlU
106 NFT FARM ~EYE~UE
107 INCO~E H~~OER FAMILY
lOA • INCO~E FA~ILY LA~O
109 • lABOUR INCOME
OISTRIB OF HOLDINGS
BY LAB I~C I ALU '110 lESS THA~ -ZOOO fUR
Ill -ZOOO TO 0 EUK
'112 0 TO 2000 EUR
11l 2000 TO 4000 fUR
'114 4000 TO b)vJ EUR
115 6000 TO PJJJ EUK
'llb 8000 TO 1~~00 EUR 117 10000 TO 12UCO ~U~
118 12000 TO 1~000 EUR ·119 14000 EU~ A~D OVE~
[image:5.602.15.597.17.748.2],111111111111
COMMISSION OF THE EUROPEAN COMMUNITIES
Brussels, 22 October 1979
FARM ACCOUNTANCY
DATA NETWORK
FOR THE
EEC
RESULTS
«
1977»
Directorate-General for agriculture - Directorate : General matters
Division : Analysis of the situation of agricultural holdings - agricultural information
.. ''1111111111111111111111
Summary
Results "1977"
-
1-Summary
Main initials or abbreviations used in this report
I Criterias of presentation of results
- Map shoking the divisions of the Farm Accountancy Data Network
- Presentation of main farm production and farm income measures
- Classification of farm holdings - type of farming
- Classification of farm holdings - area
- Exchange rates
II Accounting 5ample "1977"
- Definitions
1 - 2
3
4
5
6
7
8
9 -
10
11 - 15
- Diagram showing the structure of the farm accounting sample "1977"
17
- Breakdown of returning holdings by division "1977"
- Breakdown of "1977" returning holdings by type of farming
and by country
III Results
Breakdown
(%)
by division of returning holdings categorized
according to the level of labour income per ALU (total sample)
Breakdown
.00
of returning holdings according to the level of
labour income per ALU and according to category of holding
(total sample)
Breakdown
(%)
of cattle holdings by reference to the specialised
category according to the level of labour income (total sample)
Breakdown, structural characteristics and average income of
returning holdings by type of farm according to UAA category
and level of labour income per ALU (total sample)
Regional distribution of labour income per ALU for categories
of returning holdings represented by at least 10 holdings
-in ten or more divisions
18
19
21
22 - 23
24
25 - 30
Regional distribution of labour income per ALU for cattle
holdings according to their specialised category
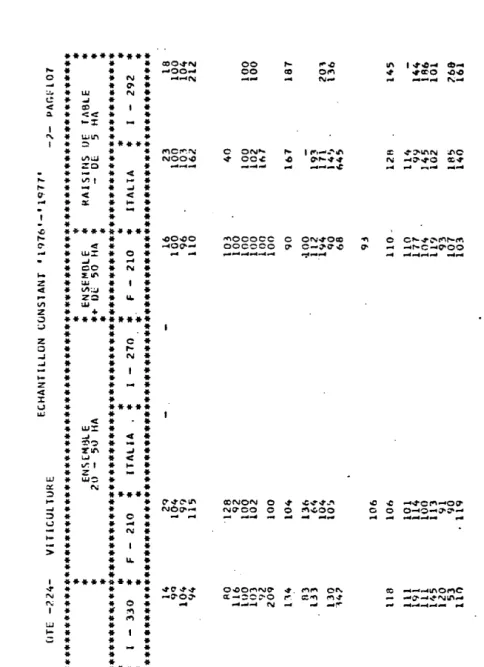
Trend in labour income per ALU in groups of returning
holdings specializing in cattle between "1976" and "1977"
(constant sample)
Trend in labour income per ALU between "1976" and "1977
11by
farm
typ~and by country (constant sample
111976
11-"1977
11)
Gross production per hectare of certain crops in 1977 for
groups of holdings specializing in "General Agricultures ..
(category 111>
Characteristics and incomes of the main groups of returning
holdings for "1977" falling within the permanent
111973-1977"
sample
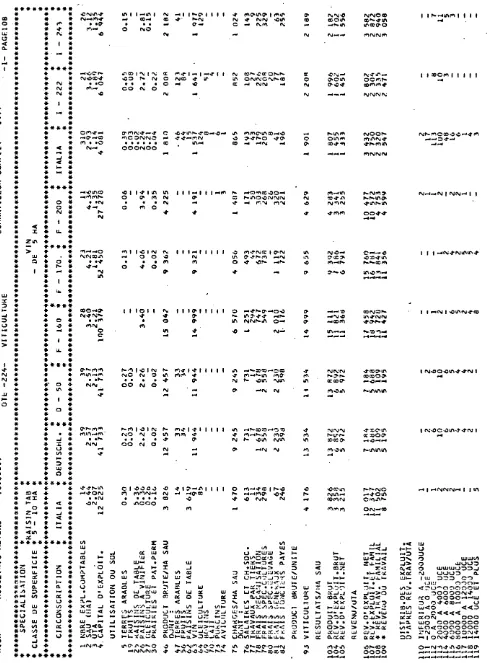
III "1977" results by group of holdings
- Criteria retained for the general presentation of the
"1977" FADN r·esults
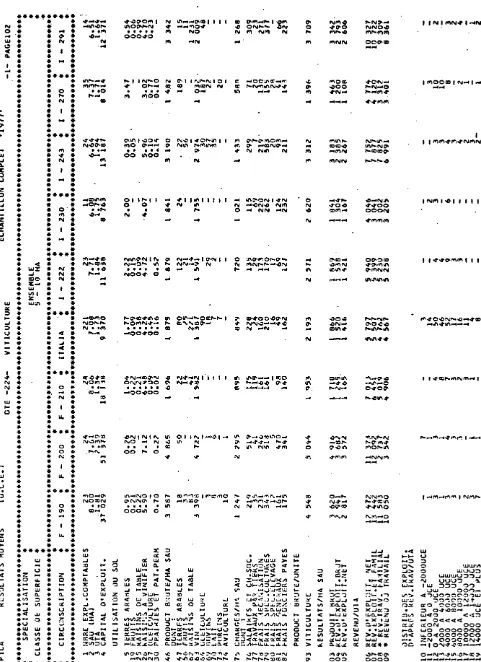
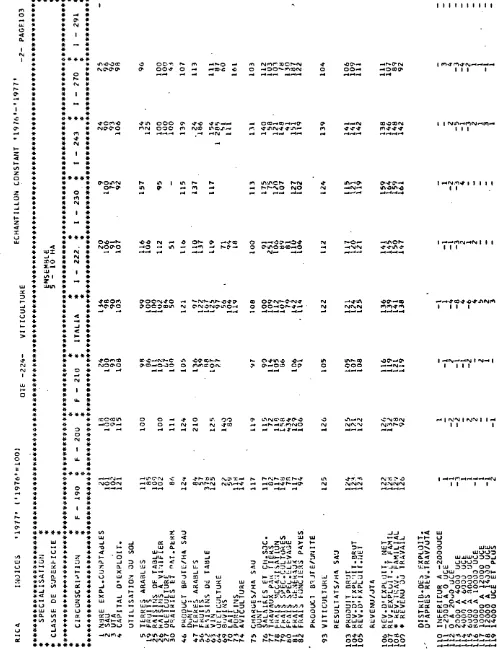
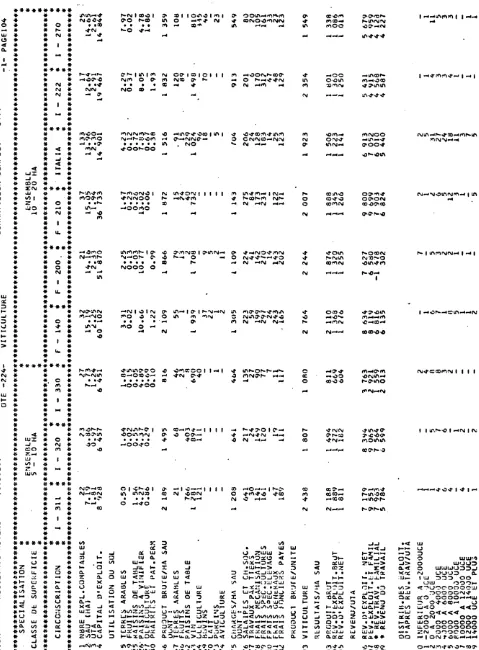
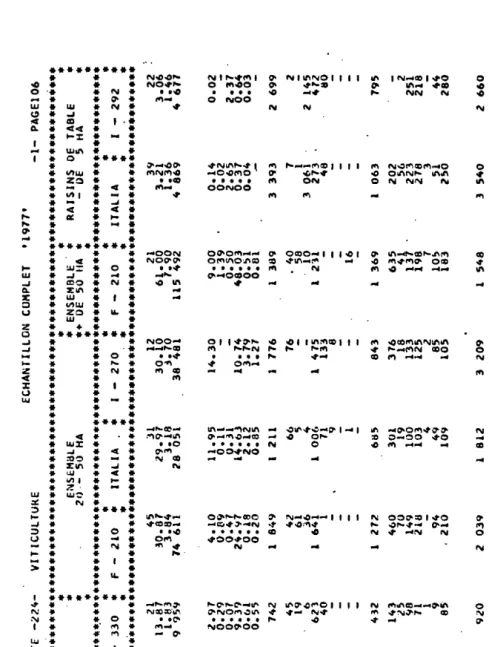
- Tables of results
- Average results (EUA>
total sample
- Indices of evolution (1976=100) constant sample
*
Pagination indicated to the right of table headings.
34
35
36 - 39
40 - 46
47 - 55
56 - 57
58 and
following
-3-"1977" F A D N
RESULTS
This document is a statistical collection of the re$ults of
the EEC's farm
~ccountancydata network (FADN>, on the basis
of the accountancy data for the "1977" accounting year, in the
~ourse
of which nearly 20.000 accountancy holdings were studied.
MAIN nliTIALS OR ABBREVIATIONS USED IN THIS REPORT
FADN~
Farm Accountancy Data Network of the EEC.
"1976": FADN accounting year 1977 (1977/78):
The
FADN
accounting year is a 12-month period which begins between
1
January and 1 July. The dates differ from one Member State to
another and in some of' the Member States according to the type of
farming.
In
all cases the accounting year corresponds to the same
harvest
(e.g.
"1977"
relates to the harvest for
1977).
UAA:
Utilized agricultural area:
Area or the holding used for agricultural production (arable land,
pe:r.ma.nent
pasture,
land under permanent crops).
·
OTEc
Type
of farming:
System of production on the holding determined from the composition
of the holding's standard gross production.
A
distinction is
made
between main types of farming, specific types of farming and
specialized activities (e.g. main types: grazing stock: specific
type:
oattleJ specialized production: milk).
"Category
of
holding". All holdings practising the
same
type of farming
and belonging to the same size categor.y.
"Group of holdings": All holdings belonging to a
given
category of
holding
in a given region or country.
EUA:
Europea~
unit of account (see .Annex
IV
Cl)
LI:
Labour income:
Balance remaining after deduction from the value of production
of all inputs (including financing costs
which
have been
calcu-lated as well as rent
an~or
rental value) but excluding labour
inputs.
LI
corresponds to the remuneration of' the labour factor
(s~e
Annex
IV,
diagram D).
ULA:
Annual labour
1lni
t:
Unit corresponding to labour of a person world.ng on a. holding at
least
280
days· or
2
380
hours
per
year. One person equals at
most 1 ALU.
LI/ALU& Labour income per annual labour unit.
Accounting sample (total sample) : All the returning holdings which have
duly completed a farm return for the year in question.
Complete sample: All the holdings in the accounting sample_belonging to
~oups
or at least ten returning holdings, at national level
{national basis) or regional level (regional basis).
Constant sample: All the holdings appearing in the accounting samples for
two successive years.
-5-MAP SHOWING THE DIVISIONS OF THE FARM ACCOUNTANCY DATA NETWORK
6,110
tEyTSCIII.AP\0
010 Schleswt;1•1f0Utein
OZO Nieders.cnsen
OlO Norelrrtti,-westfaltn
040 . . .
050 Alttirnand·Ptal:
*
laden•lolurtte.,trt071f' •• , ... ,
010 Surland
090 Halllburg
100 ... 110 eerlln fRANCE
120 Nord I Picardie
130 tasse•r...-r•andit I Hhtt-Nor•endtt
140 ertt~nt 1 Pays dt La Loirt I Poitou-,lleret~tt
150 ttntrt I -~ion Plris.itnnt
160 Francltt•CO'Itt.l Cll-agnt 18ourgoqne
170 Lorratnt I Als.ct
180 L i110u1 in I Auvtrgnt
190 AIIOnt• Alpes
200 A~itaint I llidi•P)'rinits
ZlO L~t~guedoc I l'rovtnct-Cott d'Aiwr I Corw
!!!!:.!!.
221 Vallt d' AOStl
222 PlOOI'tt
230 Lllllllardiil
241 Trtntino
242 Al to-Adige
243 v ... eto
244 Friult-V-Zil Gtulil
250 L igurla
260 E•l lla-•ooo~·"•
210 TOSCitll
211 lllarcl'tt
212 Umt•·d
Z91 Lazio
Z92 Abruzzi
301 IIIOUst
30i!
c-.,.;•
:$03 Calal!nil
311 PIIIJLia
312 auHiuta
3ZO SicH•a
330 sardt<jne
lli.GlQUE/9ELGiE I.IIXE'IIJOUIG
~ ~
~
liiUTEO KINGDQIII
!~!!,·'··~
England 'IOt'tll lltgion
WaLts .
EngL-lltst llftton
lliAGUIIIIAflC
PRISB'II'fAifi(If
OP
lAD
P.d!
PROlXJOfi(W
An
PAl!!
l!9C!I
!IIS!JIIS
(LeUon
lllld.
tipna
ill
lanabta
nter
to
eatriea
•
tbt
.cr....,_
8n11ft)
OROSI
PIODUC-riO.
(•
100/8
to
•
100/ll
+
-./100/15
+
•
100/16-•
100/5
+
0
22/6
to
0
22/11
+
0
U/13-0
22/2-0
22/l)
I
Pai'IIU..
I
Gross
f>roduct
(B
9/5
w
B
11/5
+
B
13/5)
:
It---,..-r----rt-
---_ ...
Cbal'cealtlo
1
JI'M4,
SMcl
aDd.
i
OU.r
Suppli..
1
GROSS
PAR•
••-r
,.,
..
Uaa
ot
ID80h1Ml7
._.
I
nut•
Pvoh.uecl
1
ud
SerYioea
1
(B
Z/4)
I
(B
9/4
to
B
11/4
+
1
Puobued
(•)
I
I
B
13/4)
1
I
Deprecia-f,
--_j
____
~---_L_--~---j
aDd.
oqui~
4
Cood8
ud
Se:wloea
Pvohued
~---~---~----~~~&~~
4
1
(B5/4toBU/4)
v ....
,
Salarioa
aDd
:
!
DCOD
OP
BOLDBR
All)
r•ILT
Social
S.ouri
v
charp3
Rent
Pai~
Paid(-)
lnterea'\
hid
I
(B
26
/ 4
)
•
(H
'Zf/4)
Other
lud
and
I
j
lNildiDc
ez:peuu{B
23/4j
1
to
B
25/4)
1-,...~o--
---
~--_.1
Rea'tal
Vallae
I
(C
1/1
x
B
30/3);
I
LABOUR
DeCilE
5ot10Dal
IDtoreat
j
on
PU"'I
c.pua1
( ·-)
1
1---r---..i.r
-
--
-.-J.
-Vapa,
Salarioa
1
FAr.!ILT
UBOUll
D~
aDd.
Social
So~
it7
~·
Paidl
(**)
I
'--'·-
---_
_J
{•)
B
5/4+
B
7/4t>B
8/4+8
12/4+B
14/4
to
H
10/4
+
822/4
(-)
B
1/4+8
3/4
-D2/9
__
Dl/9
(oxol'Ud1Dc
Operator'•
aal.U7
vblre
not
a
..-.rot
Bolder'•
t.U17)
(•••)
"ot
I
4/2
to
1
9/2
+
I
4/4
to
I
9/f
I.
Arable
(
uolucliug
:to
rap
Ol'OP*)
CLASSIF.ICAT_ION
OF
FARM
HOLDINGS
11·.
aci:orCiit:~Q
to
type
of
farming
SPECIFIC
TrPE
SPECIAL!
SATIOlf
not
aubdivi~d~oe
general
agriculture
(A)
other
cereals
I
subdivided
other
products
of
pn.
aar'•
not
specialised
concentratiug
--===========t
subdivided
on
~
llll&l'ket
gardeniug
outdoor
horticulture
(B)
market
gardeniug
under
glus
---subdivided
floriculture
outdoor
floriculture
under
glu•
veptables
as
a
field
crop
llrllilhrooJu not
specialised
pneral
acri.oulture
ud
horticulture
(A)
ud
(B)
manent
crops
ibined
graziDg
stock
1fi
th
pip
aDd
poal.
tl7
not
aubdi
vided
:trai.
t
(
c}
dried
trui.
t
---f:tresh
fruit
I
-=---subdivided
cit:ru
fruit.
not
subdivided.
COncentratinc
not
apecialiaed
---~
[table
grapes
<
on
~inea
(»),...:::=---,
vine
o:t
controled.
vintap
II.
-·
...,.
oli
...
(B)
•'bdi-.1
...
::.~.:::....
p:rocluotion
two
or
110re
of
then
apecitic
••
(c,
D,
or
B)
coabined.
arable
cropping
:w1
tb
~~iDe
stock
pip
111111
poal.
tl7
______
.JJOt
aubdivided
cattle
(1')1--=========---aubdivid.ed.
f:!:
/
not
specialiaed.
concent~eep
aDd.
F&ta
(a)
<:
:Ung
on-cattle,
sheep
allll
aoata
(P
and.
a)
1-~le
cropping
coabi
pemanent
crops
with
pip
aa4
pnl
tl"T
not
nbdi
vided
pip
(H)!.--==========---IIUbdivicled.
tatteni.Dc
---[bre~
IV.,
Pip
111111
poal'tr7
~='Z:!:\poultr,r
(IC)
~t
aubdivid:t
specialilled.
{
lqiDg
b-___
subdivicled
broilers non-epecialilled.
pip
aDd
poultr,r
(H
81111
lC)
ooabined~ble
croppiDc
With
"'~ent
crops
-psiDg
stock
~·
Io
pnllolli.DUt
type
CODE
•
!
::.l
iii~
b
1112
c
1113 11J}
l
d~
ig~
e
1122
f
112.3
c
1124
h
1129
J
112~
112:,) 1100 120C' 1.3CC L~OC 22.30!
j)
2231
!:)
2232
1)
223.:. 223:J ~240
!
Mll
2241
::l
2242
0
22.l.3 2245 22)0
CHARACTERISTICS
OF
CA'I!:GORIES
~
1il
~i
••ni
....
~,Ill
c.
111
Ja,llli
ni
A,
ni
B>i'
-~
~
~II<II<I;
IVcii
1/3<~
II<III<I;
XV~III
II<
IV
<I;
Iu.aY
}
c>i'{
~~t
.
•
;:
j,
a1
k,
a1
1>i-I'I>2/'J
}
D)·f~~t
.1.:?.,
ni
n,
n1
o)i'
E)• n1
C,
n1
D,
ni
E>
i'
\~Il
<
I(II;
IV<I
l/XII(2/l
ti(III<II;
IV(III
I(I'.'(II
;
III(IV
III)2/1F>i'
f~i
~·nip,
n1
q>i'
0>
.
-niP,
ni
f:>i' I<
~
I<
III;
IV<I
1/l(Ir:r(2/
I<II(III;
IV<II
<IV<III;
IJCIY
T11'L~r
~~:
t
6--lj-i;•
r,
Jll
•>
i'
i
t~t
J:>i
u) ni
t,
ni
u)i'
~
R,
ni,>::>i'
i<I<IV;fi
III('I
1/3<~2/l
I<II<IV;
III.CII
T~m(IV;
IIUII
a1
I.
a1
II,
a1
m,
111
rl)l/l
UAA
<
5
ha
Code
1
CLASSIFICATION
OF
FARM
HOLDINGS
2.
according
to
area
(utilised
agricultural
area)
5-10
ha
2
10-20
ha
3
20--so
ha
4
~50
ha
4
Example:
the
class
coded
3361.4
corresponds
to
dairy
holdings
of
20
to
50
-9-EUROPEAN UNIT OF ACCOUNT (EUA)
The FADN statistical data
~re
expressed in European Units of Account (EUA).
The EUA is made up of a "basket" of specific amounts of the nine national
currencies of the Community. Its value is published daily in the Official
Journal of the European Communi ties.
For the purpose of the FADN, the annual average rates used for converting
into EUA the accounting data originally expressed in national currency
have been adjusted to take account of the period covered by the different
national accounting years. For each individual memeber country, a single
conversion rate has been used even where, as a result of different
accounting years differing average rates ought, in actual fact, to have
been applied. In such cases, the accounting year on which calculation of
the con'Jeroion rates was based 1-ras the one regarded as being cha.racterstic
of all the reporting holdings in the country concerned, i.e. the accounting
year used by the majority of them.
The following characteristic accounting years and the following average
rates for converting national currencies into EUA were applied for "1977".
Cha.raeteriatic
Annual average
Country
accounting year
conversion rate
~
... -
=-=---~:;.---=------f---~-~~---~---~--•
117119n-
3016/1978
D
2,59551
DM
F
1/1
I 191.7 - 31
f
·121 1977
5,60608
FF
I
1/1/1977- 31/121 1977
1906,79
LIT
B
1/51 1977- 30/4/ 1978
40,48360
BFR
l
1151
'1977- 30/41 1978
40,48360
LFR
N
1/51 1977-
30141
1978
2,78275
HFL
Dk
1
I 7 I 19'!7 - 30/6/ 1978
7,01327
DKR
IRL
1/1/ 1977 - 31/12t 1977
0,653701
IRL
Price index of gross domestic product at market prices
(deflators used for tables pages
46 -
55)
(1973
=
100)
1973
1974
1975
1976
D
100.0
106.9
141.1
11·7 .9
f
100.0
111.1
125.8
138.3
I.
100.0
118.3
138.6
163.9
NL
100.0
108.7
121.1
131.3
8
100.0
112.1
126.2
135.6
L
100.0
116.2
118.6
127.3
UK
100.0
115.4
146~9168.8
IRL
100.0
107.0.
123.3
157.6
DK
100.0
110 .. 4
124.2
134.9
Exchange rates in EUA for 1973
1 EUA
=
3.11227
DM
5.46916
FF
715.049
Lit
47.5276
FB
4.7.5276
Flux
3.34210
F-l
7 .34594 Jk.r
0.501544
IRL
0. 507732
J(
UK
Sources:Deflators: EUROSTAT, National Accounts ESA 1960-1977
Exchange rates: DG VI EEC Commission
1977
122.1
150.5
193.8
141.0
144.9
135.0
191.3
178.9
-
11-lie DEFINITIONS AND METHOD OF CALCULATION OF THE 119 CRITERIA USED
IN PRESENTING THE ACCOUNTANCY RESULTS BY GROUP OF HOLDINGS
The definition or definitions of each of the
119
criteria employed are
as follows, together with details on the method of calculation.
Many
of
these
defi~itionsrefer to the definitions and instructions relating to
the farm return( 1) as adopted by the Commission.
L:I:7
Number of returning holdings
NUmber of holdings for which the Commission holdsa properly
com-pleted farm return
t:
which fall within the group of holdings
under consideration
sr~upsof
10
or more returning holdings for
the complete sample
2)_/•
CfJUAA
Utilized agricultural area: all arable land, meadows and permanent
past~e
and permanent crops (the farmer' s 'kitchen garden is not
included); thia area is expressed in hectares.
The UAA is calculated by taking the total UAA of the holdings in a
group and dividing it by the number of holdings.
CJJ
ALU
The Annual Labour Unit (ALU) is the activity of a person who works
at least 280 days or 2.380 hours on the holding.
One person is regarded as one annual labour unit at most. The
num-ber of ALU on a holding is determined as follows:
Persons who work 280 days (or 2.380 hours) or more on the holding
are regarded as one unit. Persons who work 1 ess than 280 days
(or 2.380 hours) are converted into ALU by dividing the number
of working days by 280 or the number of hours by 2.380.
The ALU average is calculated taking the total AW of all the
holdings in a group and dividing it by the number of holdings
in that group •
.
LIJ
Farm Capital
The farm capital is the value of the livestock, equipment and
working capital (stock and other working capital) as assessed at
the beginning and end of the accounting year.
The value of the farm capital is the
aver~of the book values
at the beginning and
end
of the year; this average is calculated
by dividing the total farm capital of all holdings in a group
by the number of holdings in that group.
(1) See Annex
II
to Commission Regulation No
118/66/EEC
of
29
July
1966.
OJ No
148
(see FADN booklet, 2nd edition, pages
41
et seq.;
No 8396, Office for Official Publications of the European Communities).
/ 5
to
30/
Criteria of
land
use
Land use is measured by the area expressed in hectares assigned
to the production of the various main crops.
The area indicated is obta.ined by di riding the total area assigned
to a given crop in all the holdings in a group by the number of
holdings in that group.
The following description includes only the headings
r~quiringa special mention• With regard to the other headings the reader
is asked to refer to the
FADN
booklet (1) which provides details
on the produots listed under each of the different headings.
5•
Arable land: Land assigend to "General Agriculture" and/or
"HortlcUlture" and/or "Fruit".
18.
Permanent cropsi Crops other
than
permanent pasture and not
forming part or a system of rotation, which remain in the
ground for a number of years, yielding harvests each year.
30.
Meadow and permanent pasture: La.nd forming part of the
utii-lzed agricUltural area, not rotated by permanently
assigned {for
5
years or more) to the production of green
forage crops, whether sown or wild, and generally maintained
with fertilizers.
/31
to
45/
Animals
Animals are generally represented by livestock units (LU) and per
animal when considered in detail.
Livestock-Unit(LU): a Livestock Unit represents one animal
present on the holding foi' the whole year with a feed requirement
of 3.000 fodder units. The various categories of animals are
converted into LU multiplying the number (number of head)
by
the coefficient given below.
One head of 1 i vestock corresponds to the presence of 1 animal
on the holding for
365
days or 12 months.
The livestock number {number of animals) is determined by adding
the entire number of animals on the holdings falling within a
group of holdings and dividing the total thus obtained by the
number of holdings in that group.
The animal species taken into consideration under each of the
headings 32 to
45
are those lis/ted/in the instructions annexed
to Commission Regulation No 118
66
EEC {part F).
-
13-Conversion coefficients to be applied
in determining the number of animals in LU
Draught horses
o,8
Other horses
0,5
Mules, hinnies, asses
0,4
Cattle under 1 year old
o,4
Heifers
0 7
5
Cows exclusively for milking
1
1
0
Milk and draught cows
o,8
Other cattle for work
0,9
Cattle for fattening
1
1
0
Bullocks and bulls
0,1
Buffaloes, (of.all ages)
o,s
Sheep {of all ages)
0
1
1
Goats {of all ages)
Orl
Boars
0,4
Breeding sows
0,5
Piglets of under 20 kg live weight
2
,
7
{per 100 head)
Pigs for fattening and other pigs
0
,
3
of 20 kg and over 1 i ve weight
Cockerels and table fowl (per 100 head)
Or1
Laying hens (per 100 head)
1,4
Other poultry (ducks, turkeys, geese
and guinea fowl per 100 head)
3,0
(46
to
74/
Gross production per ha UAA
Gross production is all the produce obtained in the accounting
year. It includes the products sold, provided in kind, consumed or
otherwise used on the farm and stored.
The components of gross production appear on the farm return.
These products are listed under Nos
47
to
74
and must be given
in the results according to the type of holding under consideration.
The gross average production per hectare UAA for a given group of
holdings is obtained by di;viding the total of the groups gross
production by the total number
of
hectares of the holdings in the
f15
to
82/
Input per ha UAA
All the farm input for the accounting year, including the, means
of production and services "consumed" to obtain the production
of the year, whether bought or produced by the holding {farm
use). Inputs also include expenditure on land and buildings and
interest
p~yments.The amount of the input is determined by dividing the total input
of all' the holdings in a group by the total number of ha UAA of
those holdings.
The total input cannot be given for countries {Belgium, Luxembourg,
Netherlands, Ireland, United Ki.agdom) where it is optional to
oom~
plete heading No
27
on the farm return (bank interest and charges
on borrowings}.
·
Criteria
76
to 82 correspond to tpe nomenclature appearing in
Annex II to Regulation No
118/66/EEC.
The headings listed below
have been regrouped:
78.
Mechanisation costs: All depreciation and current maintenance
of machinery and equipment
and
cost of fuels and lubricant••
79.
Specific crop costs: All seeds and seedlings, fertilizers and
soil &meliorators, water
f~r i~igation,crop protection
costs, JDi:scellaneous crop costs (especially costs of heating
~lasshouses)
•
80.
Specific livestock costs: All feed for horses, cattle, sheep
and goats, pigs, poultry and other small livestock,
miscellaneous livestock costs.
81.
Overheads: All he:Jdings: current upkeep of farm buildings,
structures and lr.nd improvements; electricity, fuel, water;
insurance {other than that covering labour, crops
and
1 i ve.:.
stGek); taxes and dues chargeable to the business (other
than land taxes); miscellaneous.
82. Outgoings for land and buildings: All headings: depreciation
of f·ixed equipment, structures, land improvements
and
plantings;
taxes on land and buildings and related charges; fire insurance
on fram buildings, rent.
/83
to
99/
Gross production per unit
Criteria Nos
83
to
99
indicate the amount of gross production per
production unit; with regard to crops; production unit means a
hectare under main crops and, in the case of livestock, the
livestock unit already defined (see heading 31).
Gross production per unit is calculated by dividing the total
gross production of
a
group of holdings by all the production
-
15-/100 to-foy Net product ion per unit
Net production per unit is given only for "grazing stock", "pigs"
and "poultry" (criteria 100 to 102).
It is obtained by deducting the total of the livestock feed costs
(including farm use) from the gross production of one of these three
headings.
·
The
net production per unit is obtained by dividing the total
net production of all holdings in a group by the total number of
livestock units in those holdings.
/103 to 105/*Results per hectare UAA
103. Gross product: All the production sold, provided in kind,
home-consumed and stored. It is thus the gross production
less farm use.
**
104. Gross farm income: Balance after deducting from the gross
product all purchases of goods and services required for
production purposes during the year.
**
105. Net farm income: Balance remaining after deducting
depreciation of machinery and equipment from the farm
income.
All the results expressed per hectare UAA are obtained by dividing
the total amount for all the holdings in a group by the total
number of hectares of UAA of those holdings.
/106 to 109}#Income per ALU
The following diagram gives the method of calculating the criteria
of income. It is necessary to use non-survey data to determine
the two incomes marked with an asterisk (national return on
owner-managed farm capital).
The net farm income and the labour income expressed per ALU result
from dividing the total sum of the corresponding income for the
totality of the holdings in a group by the number of ALU of these
holdings.
The income of the farmer and his family and the family labour
income expressed per family ALU resulting from the division of the
total sum of the corresponding income for the totality of holdings
in a group by the number of family ALU of the holdings.
/_l_l_O_t_o __
l_l_9_~Breakdown
of holdings an the basis of earned income per ALU
Criteria 110 to 119 each correspond to an earned income category
per ALU. The category scale is in steps of 2.000 EUA.
The number of returning holdings is given for each income category.
The second part of the table giving the indices of ohage relates
these criteria not to indices but to the numbers of holdings. Plus
or minus numbers show an increase or decrease in the numbers of the
corresponding class between "1974" a.nd "1975"•
• Criteria numbers
46
to 119 are expressed in values excluding VAT. With.
regard to holdings which opted for the flat rate VAT scheme for farmers
and for which VAT "neutrality" is not provided each year, criteria 103 to
119 are expressed in values including VAT so as to determine the real
results of these holdings for an aocounting year.
-
17-DIAGRAM SHOWING THE STRUCTURE OF THE FADH ACCOUNTING SAMPLE
Default
ing
(3.700)
KEY :
-"1977"
Returning holdings selected (
2 3 . 4 4 7 ) - - - •
Regional groups
~10holdings
( 16.801)
New holdings
Constant sample
(3.734)
(13.067)
+---
Complete sample: regional basis
{16.810.)---~
..
c~---
Complete sample: national basis
(19.001. ) - - - •
Total sample
(19.747'.) - - - •
I
ftTttttfiSelected returning holdings which ceased to
~eep
accounts during
..
_ ....
~
... _the year or for whi'ch the farm return was not properly completed.
f'Z/. /. /..
JHoldings falling within categories represented both at regional
VZZ'l~
(divisions) and national levels by less than 10 returning holdings.
Holdings falling within categories represented at regional level
(divisions) by groups of less than 10 returning holdings and at
...
~...,.national level by groups of at least 10 returning holdings.
~---~IHoldings
falling within groups of at least 10 returning holdings
---r
appearing in the
''1977"
sample for the first time.
UIIHP~Holdings
falling within groups of at least 10 returning
holdin~
~-m&mumam~lwhich
already appeared in the
"1976"
sample.
(
) Number of returning holdings in a category.
Category of holding: All holdings engaged in
the
same_
·tyPe
ot·
farming
and falling within the same UAA size category.
Group of holding
: All the holdings falling within the same
cat~.~ry
in a given division (regional group) or in a given country
(national
group~PWhere
no other details are given, the term
BREAKDOWN OF RETURNIN~ HOLDINGS BY DIVISION "1977"
Nu111ber of re-turning holdings
D i v i s i o n s
Regu-lation Selection
~1/66/EEC
010 Schleswig-Holstein 260 309
020 Niedersachsen 535 646
030 Nordrhein-Westfalen 435 512
040 Hessen 270 311
050 Rheinland-Pfalz 285 342
060 Baden-Wurttemberg 420 503
070 Bayern 855 973
080 Saarland 65 73
DEUTSCHLAND 3 125 3 669
120 Nord, Picardie 220 240
130 Basse-Normandie,Haute Normandie 216 217
140 Bretagne, Pays de La Loir, 813 858
Poitou-Charente
150 Centre, Region parisienne 264 295
160 Franche-Comte, Champagne, Bourgogne 3$4 371
170 Lorraine, Alsace 152 167
180 Limousin, Auvergne 290 319
190 Rhone-Alpes 256 273
200 Aquitaine, Midi-Pyrenees 571 640
210 Languedoc, Provence-Cote d'Azur 309 364
Corse
FRANCE 3 445 3 744
221 Valle d' Aosta 35 35
222 Piemonte 940 940
230 Lombardia 580 580
241 Trentino 100 110
242 Alto Adige 100 90
243 Veneto 750 750
244 Friuli-Venezia Giulia 170 170
250 Liguria 350 350
260 Emilia Romagna 650 650
270 Toscana 650 672
281 Marche 400 450
282 Umbria 300 337
291 Lazio 300 334
292 Abruzzi 400 527
301 Molise 160 160
302 Campania 700 700
303 Calabria 400 315
311 Puglia 500 534
312 Basil i cat a 200 201
320 Sicilia 550 660
330 Sardegna 370 470
IT ALIA 8 605 9 035
340 BELGIQUE/BELGIE 780 900
350 LUXEMBOURG 110 113
360 NEDERLAND 1 400 1 601
370 DANMARK 1 555 1 678
380 IRELAND 670 796
390 Northern Ireland 200 240
400 Scotland 250 300
410 England North Region 245 294
420 Wales 200 240
430 England West Region 305 326
440 England East Region 430 511
UNITED KINGDOM 1 630 1 911
Number of correctly completed returns
Constant
Total Groups sample
~ 10
265 239 151
588 556 441
474 434 287
287 266 191
315 279 -201
496 464 410
895 858 623
58 42 35
3 378 3 138 2 339
234 215 179
203 165 164
810 748 633
292 2-53 257
361 354 303
165 153 112
309 291 215
247 232 196
592 511 420
339 312 257
3 552 3 234 2 736
28 0 16
710 659 514
208 174 118
75 24 22
80 47 59
619 538 521
105 40 68
273 228 60
512 391 258
546 391 336
400 299 138
288 122 104
272 1n 155
424 305 239
157 60 136
216 105 139
272 139 79
345 260 69
169 66 66
433 312 156
273 131 132
6 405 4 467 3 376
843 752 613
100 91 72
1 471 1 373 1 090
1 549 1 493 1 229
758 707 354
208 169 172
265 249 201
281 272 1&1
207 194 1S3
291 263 202
439 408 349
1 691 1 555 1 258
-
19-BREAKDOWN OF "1977" RETURNING HOLDINGS
BY TYPE OF FARMING AND BY COUNTRY
Main type of farming
D
F
I
B
L
NL
DK
Gen.agric.- Horticult. 110
1
1·1
80
4
4
2
. General agriculture 111
162
321
808
38
281
150
Horticulture
112
1
127 442
95
325
5
Arable-permanent crops120'
1
17 280
4
1
I
Arable-grazing stock
130 161
276 456
40
25
45
Arable-pigs and poult.140
61
5
58
11
4
74
Perman. crops-arable
210
1
4S 262
2
2
i
Miscel.perm.crops
220
'
72
31
Fruit
223
2
157 587
35
46
1
Vines
224
69
316 738
Olives
225
260
Cattle
336 959 1309 1064 276
62
401
306
Milk
3361
520
731
630 182
27
380 148
Meat
3362
49
37S 167
20
8
8
Non spec. cattle
3365 390
197 267
74
35
13 150
Perman.crops-pigf&
240
1
30
1
1
pou try
Grazing stock-arable 310 550
518 545
69
8
24 131
Grazing stock-perm.
320
2
46 252
2
1
1
crops
Cattle,sheep & goats 330
1
23
18
1
4
1
Perm.crops-grazing st.230
45 199
1
Sheep, goats
337
25
60
2
Graz.stock-pigs&poult.340 596
141
34
95
16
75
270
Pigs&poultry-graz.st. 410 163
11
48
16
8
131
Pigs&poultry-perm.cro~420
23
1
2
Pigs
&
poultry-graz. 430
stock
403
56
14
78
14
59 160
Pigs and poultry
440
1
1
4
4
Pigs
448 241
66
32
74
128 246
Poultry
449
2
28
9
5
40
19
No dominant main type 550
1
3
34
1
of farming
- ·
---·
...-.··--~·-Number 3378 3552 6405
(43
100 1471 1549
Total
X
11,1
17,9 32,4 4,2
0,5 7,4 7,8
IRL
UK
EEC
~umber
%
7
109
0,6
2
240
2002 10,,
I
44
1039
5,3
303
1,5
6
84
1093
5,5
1
11
225
1,1
312
1,6
107
0,5
828
4,2
1123
5,.7
260
1,3
680
940 . 5998 30,4
269
475
3368 17,1)
335
355
1317 (6, 7)
76
111
1313
(6,6)
33
0 ')
,
...1221
26
1993 10,,
I
304
1,5
8
15
70
0,4
246
1,?.
22
127
236
1,2
9
30
1266
6,4
19
396
2,0
26
0,1
3
19
806
4,1
1
11
0,1
1
26
814
4,1
5
107
0,5
39
0,2
~~~~~~
758 1691
19747
-
21-BREAKDOWN (%) BY DIVISION OF RETURNING HOLDINGS CATEGORIZED ACCORDING TO THE LEVEL OF LABOU~ INCOME PER ALU
(TOTAL SAMPLE)
Categories of labour income (EUA/ALU) D i v i s i o n s
~ -2000 0- 2000- 4000- 6000- 8000- 10 000 12 000 14 000
- 2000
a.o
2000 4000 6000 8000 10 000 12 000 14 000 16 000-
---010 Schleswi~Holstein 7,2 7,5 9,4 16,2 15,1 14,0 10,9 6,0 5,3 2,3
020 Niedersachsen 2,6 4,1 10,4 14,6 16,8 17,9 12,1 6,6 5,1 3,6
030 Nordrhein-Westfalen 2,5 3,2 7,0 19,4 23,4 15,0 12,9 5,7 5 .. 3 2,3
040 Hessen 0,7 8,0 17,1 23,7 19,5 17,4 8,0 3,1 1,0 0,7
050 Rheinland-Pfalz 1,6 2,5 10,5 18,1 22,9 16,2 12,7 6,3 4,1 2,2
060 Baden-WUrttemberg 0,0 3,0 12,3 19,4 22,0 17,5 9,7 5,4 5,2 1,8
070 Bayem 1,3 3,2 9,7 17,9 21,3 15,6 11,6 6,9 4,1 2,8
080 Saarland 1,7 1,7 6,9 13,8 17,2 27;6 8,6 10,3 3,4 5,2
- - ---
----
--~--DmTSCHLAND 2,0 4,0 10,3 18,1 20,4 16,5 11,3 6,1 4,4 2,5
120 Nord, Picardie 0,4 1,7 7,3 16,7 22,7 14,5 15,0 7,7 4,3 3,4
130 Basse-Normandie, Haute-Normandie 1,5 3,4 5,9 22,2 23,6 18,2 11,3 6,9 4,4 1,0
1.40 Bretagne, Pays de la Loire, 0,7 1,4 10,2 21,0
Poitou-Charente 22,8 17,9 11,1 6,7 4,3 1,6
150 Centre, R~gion parisienne 1,0 3,4 7,5 13,7 15,8 18,2 13,0 7,5 6,8 3,8
160 Pranche-Comt&, Champagne, Bourgogne 0,6 2,8 9,4 16,9 18,3 15,5 10,0 8,6 5,8 3,6
170 Lorraine, A1 sace 0,6 1,2 7,3 17,0 19,4 19,4 13,9 6,7 9,1 0,6
180 Limousine, Auvergne 0,3 0,6 24,6 32,7 23,3 11,7 4,9 1,3 0,0 0,3
190 RMne....A.lpes 0,0 2,4 11,3 26,7 26,7 14,6 6,9 4,5 2,8 2,4
200 Aquitaine, Midi-Pyrf.n&es 4,7 5,2 26,2 30,1 18,1 7,4 4,4 2,7 0,7 0,0
210 Languedoc, Provence-tate d'Azur-Corse 1,8 2,4 10,0 23,0 15,9 17,4 12,1 6,2 3,8 3,0
- - - - ·-·
li'RAHCE 1,4 2,6 I 13,3 22,7 20,5 15,0 9,7 5,7 3,8 1,8
I
\
221 Valle d'Aosta 0,0 0,0 i 28,6 53,6 14,3 0,0 3,6
I
0,0 0,0 0,0
222 Piemonte 1,1 3,4 20,0 20,6 16,5 12,8
I
7,9 4,9 3,7 2,3230 Lombardi& 0,0 2,9 11,5 17,8 17,8 19,2 10,6 9,6 4,8 2,9
241 Trentino 0,0 9,3 18,7 40,0 14,7 2,7 1,3 4,0 1,3 5,3
242 Alto Adige 1,3 2,5 13,8 17,5 20,0 6,3 ·8,8 3,8 1,3 8,8
243 Veneto 0,0 8,1 12,6 27,8 22,6 14,1 . 8,6 5,8 3,1 1,6
244 Friuli-Vene?.i& Giulia 0,0 9,5
I
10,5 32,4 25,7 19,0 6,7 2,9 1,0 1,0250 Liguria 2,2 5,9 52,0 25,6 8,1 1,8 2,9 0,0 1,1 0,0
260 Emilia-Romagna 0,2 3,5 112,3 21,3 21,3 15,6 9,4 6,1 3,5 1,0
~0 Toscan& 1,6 6,6 24,9 26,4 17,0 9,0 ~,2 3,5 1,6 1,1
1 Marche 0,8 2,5 I 40,8 31,3 15,0 6,3 1,3 1,8 0,5 0,0
282 Umbria 0,3 4,5 . 55,9 24,0 11,8 3,1 0,0 0,3 0,0 0,0
291 La:do 5,5 8,5 j 21,3 21,3 18,4 9,6 6,6 2,2 2,9 1,5
292 Abru?.zi 7,8 5,4 31,4 32,3 13,6 4,2 2,4 .1 ,9 0,2 0,5
301 Molil'le 0,6 14,0 : 46,5 23,6
I
7,.
4,5 2,5 0,6 0,0 0,0302 Campania 0,0 I 2,8 I 43,1 31,9 11,1 6,5 2,3 1,4 0,0 0,0
I
303 Calabria 5,5 21,0
I
31,6 20,0 3,7 7,0 2,6 2,2 1,5 2,2311. Puglia 6,4 I 11,0 I 20,9 22,6 16,2 10,1 3,2 4,6 8,7
I
1,2312 Bazilicata 1,1 : 7,1 1 42,6 31,4 1 9,5 4,1
I
3,6 0,0 0,0 ' 0,0320 Sicilia 7,4 10,6 . 21,2 22,9 I 16,9 6,7
I
5,1 2,8 1,61 2,8330 Sardegna 2,9 I 9,2 1 28,6 28,2 15,4 8,4 2,9 1,5 1,8 0,7
l I
2,5
I
6,1 I 26,7 25,4 15,8 I9,2
I
5,2 ;3,3 1,8 I 1,3 IT ALIA
340 BELGIQUE - BELGIE 0,8 1,4 3,3 7,5 12,1 16,4 : 14,2 10,7 10,3 7,8
350 LUXDIBOURG 0,0
r
-3,0 4,0 r---9,0 17,0 16,0 22,0 15,0 6,0 5,0
r----
---
---r---;-0-,0 1
OR•---360 NEDERLAND 2,6 1,8 4,1 7,0 8,4 11,6 11,6 10,8 6,8
370 DANMARK 1,8 I 1,0 3,3 3,4 5,3 8,1 11,6 110,4 11,2 : 11,0
I
------
---- I380 IRELAND 0,4 0,7 12,7 26,0 21,2 14,2 8,6 5,7 2,8 2,5
---+--~
--
>-·-390 Northern Ireland 1',0 I 4,8 16,8 23,1 13,5 11,5 i 10,6 5,8 6,7 1,4
400 Scotland 0,4
i
1,9 3,8 10,9 19,6 11,7 ' 17,0 15,1 7,1 4,9410 England North Region 0,0
!
0,7 3,2 6,8 15,7 18,9 21,4 9,3 8,2 5,0420 Wales 1,0 2,9 6,8 15,9 '23,7 15,0 13,0 7,7 5,3 4,8
430 England West Region 1,4 0,3 4,8 13,1 22,7 19,6 15,8 i 12,4 2,7 4,5
440 England East Region 1,1 1,6 4,8 11,2 15,9 18,0 16,6 111,8 6,6 4,6
- - ·
1 ;-0,8 -·
----UNITED KINGDOM 0,8 1,8 6,1 12,8 18,3 16,3
i
16,1 6,2 4,3TOTAL EEC 1,8
i
3,6i
14,6 18,7 16,3 12,7 I9,6
I
6,4 4,8I
3,4I
16 000 ~ Total 18 000 18 000
--
-~-1,9 4,2 265
2,4 3,4 588
2,1 12,7 474 .
0,3 0,3 287
1,6 1,3 315
1,0 2,6 496
1,9 3,9 895
1,7 1,7 58
- - -
---·--1,7 2,8 3.378
3,4 3,0 234
0,0 1,5 203
1,0 1,2 810
4,1 5,1 292
2,5 6,1 361
2,4 2,4 165
0,0 0,3 309
0,4 1,2 247
o,o
0,5 592I
1,8 2,7 3391,4 2,2 3.552
0,0 0,0 28
2,7 4,2 710
0,5 2,4 208
0,0 2,7 75
5,0 11,3 80
9,7 2,1 619
0,0 0,0 105
0,4 0,0 273
0,8 5,1 512
5,5 1,5 546
0,0 0,0 400
o,o
0,0 2880,7 1,5 272
0,2 0,2 424
0,0 0,0 157
0,0 0,9 216
1,8 1,1 272
1,2 1,7 345
0,6 0,0 169
i
0,5 2,8 4H.
0,0 0,4 273
!
I
0,8 1,9 6.4055,5 10,0 843
1,0 2,0 100
·-·
·---6,4 19,0 1.471
9,0 23,8 1.549
- ·
--
~2,0 3,3 758
1,0 3,8 208
3,8 3,8 265
4,6 6,4 281
1,0 2,9 207
1,0 1,7 291
2,5 5,2 439
2,4 4,1 1.691