THE EFFECT OF FREQUENCY ON FLOW AND HEAT
TRANSFER OF A HEAT EXCHANGER IN AN
OSCILLATORY FLOW CONDITION
SYAHRULNIZAM BIN MOKHTARUDDIN
B041110048
BMCA
Email: syahrulsn11@gmail.com
Draft Final Report
Projek Sarjana Muda II
Supervisor: Dr. FATIMAH AL-ZAHRAH MOHD SA’AT
Faculty of Mechanical Engineering
Universiti Teknikal Malaysia Melaka
ii
SUPERVISOR DECLARATION
“I hereby declare that I have read this thesis and in my opinion this report is sufficient in terms of scope and quality for award of the degree of
Bachelor of Mechanical Engineering (Material & Structure)”
Signature: ………
Supervisor: Dr. FATIMAH AL-ZAHRAH MOHD SA’AT
iii
DECLARATION
“I hereby declare that the work in this report is my own except for summaries and quatations which have been duly acknowledged.”
Signature: ………
Author: ………
iv
v
ACKNOWLEDGEMENT
I would like to express my thanks and appreciation to all who provide and help me to complete this report. A special gratitude I give to my final year project supervisor, Dr. Fatimah Al-Zahrah binti Mohd Sa’at, whose contribution in stimulating suggestions and encouragement, helped me to coordinate my work especially in writing this report.
I am extremely thankful and pay my gratitude to my Faculty of Mechanical’s member of staff for giving their valuable guidance and support on completion of this project. I would also like to thank the Universiti Teknikal Malaysia Melaka for giving me the opportunity to perform this project. Moreover to all my friends that together involved in the project throughout solving problems.
Last but not leastmy special gratidude to Allah S.W.T for give me a good health during completing this project, my parents and family for their constant encouragement which without them, this project would not be possible.
vi
ABSTRAK
Projek ini bertujuan untuk menyediakan dan membangunkan model
vii
ABSTRACT
viii
TABLE OF CONTENT
CHAPTER TOPIC PAGES
DECLARATION ii
DEDICATION iii
ACKNOWLEDGEMENT iv
ABSTRAK v
ABSTRACT vi
TABLE OF CONTENT vvi
LIST OF TABLE ix
LIST OF FIGURE x
LIST OF SYMBOL xiii
LIST OF APPENDIX xv
CHAPTER I INTRODUCTION 1
1.1 Background 1
1.2 Problem Statement 2
1.3 Motivation of Study 2
1.4 Objective 2
1.5 Scope 3
CHAPTER II LITERATURE REVIEW 5
2.1 Fundamental of Flow and Heat 5
2.2 Heat exchanger 7
2.3 Oscillatory Flow Condition 9
2.5 Thermoacoustics 13
ix
CHAPTER III METHODOLOGY 27
3.1 Introduction 27
3.2 Domain Selection 29
3.3 Pre-Process 30
3.3.1 Drawing the Computational Domain 30
3.3.2 Meshing the Computational Domain 31
3.3.3 Wall Selection 31
3.4 Solver Setting 32
3.4.1 Solver Type 34
3.4.2 Velocity Formulation 35
3.4.3 Time Selection 35
3.4.4 Gravity Effect 35
3.4.5 Models Panel Setting 35
3.4.6 Materials Selection 36
3.4.7 Boundary Conditions 37
3.4.8 Surface Monitor 40
3.4.7 Run Calculation 41
CHAPTER IV RESULT AND DISCUSSION 43
4.1 Case 1 (Validation) 43
4.2 Case 2 47
4.3 Case 3 49
4.4 Case 4 51
CHAPTER V CONCLUSION AND RECOMMENDATION 53
5.1 Conclusion 53
5.2 Recommendation 54
REFFERENCE 55
x
LIST OF TABLE
NO. TIITLE PAGE
2.1 Comparison of velocity amplitude between numerical models. 11
(Source: Mohd Saat and Jaworski, 2013)
2.2 Operating condition used in the numerical simulation. 20
(Source: Yu et al. 2014)
2.3 Modes of thermoacoustic instability in Rijke-Type Combustor 23
(Source: Guoneng et al., 2010)
3.1 Properties of materials setting. 37
3.2 The specification of boundaries type and thermal condition. 38
3.3 Value of frequency, heat exchanger length, andt time steps in 42
each case.
3.4 Properties comparison between nitrogen and helium gas. 42
4.1 Properties of Nitrogen at constant mean pressure at 1 bar. 42
4.2 Properties of Helium at constant mean pressure at 1 bar 47
with frequency, f = 20 Hz.
4.3 Properties of Helium at constant mean pressure at 1 bar 49
with frequency, f = 30 Hz.
4.4 Properties of Helium at constant mean pressure at 1 bar 51
xi
LIST OF FIGURE
NO. TIITLE PAGES
2.1 Illustration of laminar, transition and turbulent flow.
(Source: Flowcontrolnetwork.com, 2010) 6
2.2 Different flow regimes and assiociated temperature profile in
double pipe exchangers with (a) parallel-flow (b) counter-flow.
(Source: Cengel and Ghajar, 2011) 7
2.3 Heat exchanger measurement configurations: (a) a heat
exchanger tested under steady-flow conditions, (b) a single heat exchanger in oscillating flow, (c) a heat exchanger adjacent to a thermoacoustic.
stack, (d) two heat exchangers at different temperatures in oscillating flow.
(Source: Wakeland and Keolian, 2003) 9
2.4 Schematic diagram of the experimental setup and the selected
computational domain (top), meshed area of the computational domain (middle), enlarged view of the area for plotting
velocity profiles and vorticity contour (bottom).
(Source: Mohd Saat and Jaworski, 2013) 10
2.5 Vorticity contour from (a) Experiment, (b) Laminar model
and (c) SST k- ω model between the heat exchanger’s plate at 0.83% drive ratio.
(Source: Mohd Saat and Jaworski, 2013) 11
2.6 Time dependent temperature fields in the test channel.
xii
2.7 A standing wave in a thermoacoustic resonator with pressure
node and antinode.
(Source: Ghazali, 2004) 14
2.8 Set of parallel plates configuration a thermoacoustic system.
(Source: Huelsz and Ramos, 1998) 14
2.9 Sketch of a thermoacoustic refrigerator.
(Source: Marx et al., 2005) 15
2.10 Low amplitude and high amplitude experimental results.
(Source: Marx et al., 2005) 15
2.11 (a) Schematic illustration of the experimental apparatus
with PLIF system deployed and (b) Close up of test channel formed by a pair of “hot” and “cold” plates within the heat exchangers.
(Source: Yu et al. 2014) 19
2.12 Cross-sectional temperature profiles for ten selected phase
(x = 5.0 mm) at (a) different oscillation amplitudes (f = 13.1 Hz) and (b) different operating frequencies.
(Source: Yu et al. 2014) 20
2.13 Schematic diagram of experiment system.
(Source: Guoneng et al., 2010) 22
2.14 Pressure waveforms (a) Case 1 (b) Case 2
(Source: Guoneng et al., 2010) 23
2.15 Schematic drawing of (a) The 300 Hz standing-wave TAHE
(b) Acoustic power output measurement, P1, P2, and P3 are pressure sensors.
(Source: Yu et al., 2013) 24
2.16 The schematic diagram of the experimental setup.
(Source: Kim et al., 2004) 25
2.17 Temperatures of the heating and cooling points for the the
first 15 minutes operation of the thermoacoustic refrigerator.
(Source: Kim et al., 2004) 26
2.18 The dependence of temperature decrease on (a) the stack
porosity and (b) the plate spacing,
xiii
3.1 Flow chart of this project. 28
3.2 Dimension of the computational model. 29
3.3 Geometry created using Workbench. 30
3.4 Meshing generation results. 31
3.5 Name selection of the domain. 32
3.6 Meshing Quality check 33
3.7 Solver Setup window. 34
3.8 Models setup. 36
3.9 Material Setup. 37
3.10 Type of zone used. 38
3.11 Wall boundary condition: (a) Thermal condition setup
(b) Momentum of mass flow inlet setup (c) Momentum
of pressure inlet setup. 38
3.12 Surface monitor setting 41
4.1 Comparison of X-velocity at point m between simulation result
and theoritical calculation. 45
4.2 Vortosity contour. 46
4.3 Graph of X-velocity at point m within 20 phase at f=20 Hz. 48
4.4 Vortosity contour at f = 20Hz. 48
4.5 Graph of X-velocity at point m within 20 phase at f=30 Hz. 50
4.6 Vortosity contour at f = 30Hz. 50
4.7 Graph of X-velocity at point m within 20 phase at f=50 Hz. 52
xiv
LIST OF SYMBOL
= Angular frequency, rad/s
o = Degrees angle
= Density, kg/m3
D = Diameter, m
d = Distance, m
r
D = Drive ratio, %
f = Frequency, Hz
c
Q = Quantity of heat, J
h
Q = Excess heat, J
p
C = Isobaric specific heat, J/gK
= Kinematic viscosity, m2/s
m = mass flow rate, kg/s
2
m = mass flux, kgs-1m
-m = metre
mm = milimeter
= Pi
ac
W = Acoustical power, kW
P = Pressure, kPa
a
P = Oscillating pressure, kPa
k = Thermal conductivity, W/mK
= Theta
T = Temperature, K
k
= Thermal penetration depth
Re = Reynold’s number
xv
avg
V = Average velocity, m/s
v = Velocity, m/s
= Dynamic viscosity, kg/ms
= Wavelength, m
a
k = Wave number
e
V = Variation of the voltage amplitude, V
xvi
LIST OF APPENDIX
NO. TITLE PAGE
A Simulation Coding 61
B Ghannt chart for PSM 1 62
1
CHAPTER I
INTRODUCTION
1.1 BACKGROUND
Heat transfer processes in the presence of oscillatory flow has received a lots of research interest in the past few decades. The heat transfer enhancement due to the oscillatory flow may lead to a large variety of possible application. Thus, a large number of experimental and numerical works have been carried out and analysed. A variety of the devices may be related to this process such as Stirling engines or coolers, thermoacoustic devices and pulse tube coolers. These devices employ the oscillatory gas flow as the working fluid as a means of energy transfer. Therefore, the design of heat exchangers, stack or regenerators and thermal buffer tube in such devices requires the understanding of the heat transfer process between the solid boundary and oscillatory gas flow.
Understanding of heat transfer process between a solid boundary and a flowing fluid is important for the design of internal components such as heat exchangers, regenerators and thermal buffer tubes in thermoacoustic and Stirling thermodynamics machines where the flow oscillations are parts of the power production or transfer process.
2
mixing and this is controlled by varying the frequency and amplitude of the oscillation.
A sound wave commonly consist of coupled pressure and motion oscillations. However, for devices that produce energy, temperature oscillations are constantly present. When the sound travels in small channels, oscillating heat also flows to and from the channel walls. The combination of all such oscillations produces a rich variety of "thermoacoustic" effects. Thermoacoustics research began with curiosity about the oscillating heat transfer between gas sound waves and solid boundaries. These interactions are too small to be obvious in the sound in air with which we communicate every day. Nevertheless, in intense sound waves and pressurized gases, thermoacoustics can be harnessed to produce powerful engines, refrigerators, pulsating combustion, heat pumps, and mixture separators. Therefore, a lot thermoacoustics research in the immediate past is motivated by the desire to create new technology for the energy industry that is as simple and reliable as sound waves themselves.
In this paper the study and analysis about the effect of frequency on heat transfer of an oscillatory flow. What will happen with the oscillatory flow and the heat transfer if the frequency changes? Theoretically, the frequency can affect many element in the system of heat transfer. Thus, the relationship between those need to be find out.
1.2 PROBLEM STATEMENT
3
flow and heat transfer within a heat exchanger. However, most studies are related to a steady flow. Studies related to oscillatory flow conditions are therefore necessary.
1.3 MOTIVATION OF STUDY
The oscillatory flows mechanisms and impact on heat transfer performance of devices are not well understood. This effect may bring negative or positive impact to the system. For a thermoacoustic devices, the detail understanding of the behaviour of oscillatory flow within the device is vital as it may assist in improving the efficiency and performance of the system. Devices utilising thermoacoustic principles are attractive because they involve simple mechanisms and use environmentally friendly gas as the working medium. These qualities encourage lots of research works within the field with hopes that this attractive technology will soon enough have its own place in the industry.
1.4 OBJECTIVE
1. To study the theory of heat transfer and of an oscillatory flow condition.
2. To setup and develop suitable Computational Fluid Dynamics (CFD) model.
3. To validate the result obtained with the existing theoretical calculation result.
4. To study and understand the heat transfer process between a solid boundary and
oscillatory fluid flow due to the change of frequency.
1.5 SCOPE
4
5
CHAPTER II
LITERATURE REVIEW
2.1 FUNDAMENTAL OF FLOW AND HEAT
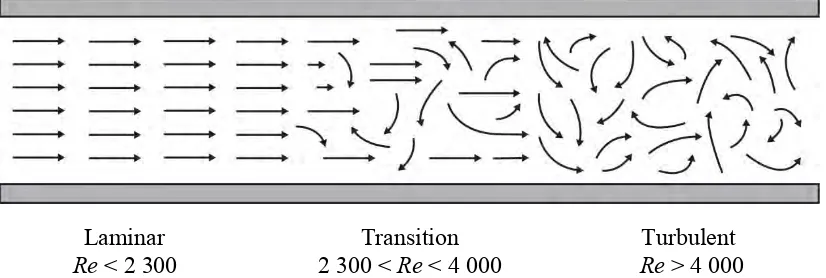
Subramaniam (2003) explain about the introduction of heat transfer with the principal differences between heat transfer in laminar flow and in turbulent flow. The value of Reynolds number, Re, defined in equation (2.1) permits us to determine wether the flow is laminar or turbulent.
Re 4 / 2 D m D D V v D
Vavg avg
(2.1)
In equation (2.1), the term D is the inside diameter of the tube (or pipe), V is
the average velocity of the fluid, is the density of the fluid and is its dynamic
viscosity. It is sometimes useful to use kinematic viscosity v/in defining the
Reynolds number. Another common form involves using the mass flow rate, m ,
instead of the average velocity. The mass flow rate is related to the volumetric flow rate via m Q, and can be written as Q D2V /4. Therefore, the Reynolds number can also be defined as :
Re μD m 4 (2.2)
6
turbulent. Under most practical condition, the flow in a tube is laminar for Re < 2300, fully turbulent for Re > 10000, and transitional in between. But it should keep in mind that in many cases the flow becomes fully turbulent for Re > 4000. (Cengel, 2011)
Laminar Transition Turbulent
[image:22.595.114.527.169.308.2]Re < 2 300 2 300 < Re < 4 000 Re > 4 000
Figure 2.1: Illustration of laminar, transition and turbulent flow. (Source: Flowcontrolnetwork.com, ( 2010))
Xia et al. (2014) studied about the effects of different geometric structure on fluid flow and heat transfer performance in microchannel heat sinks. The numerical investigation has been performed to study the effects of the inlet and outlet locations, header shapes and microchannel shapes on fluid flow and heat transfer, and the optimal geometric parameters were obtained.
7
2.2 HEAT EXCHANGER
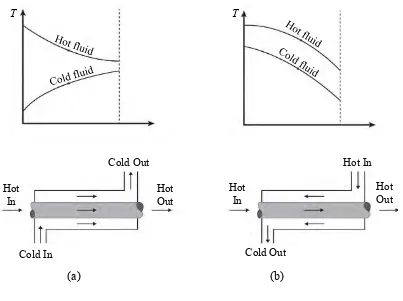
Heat exchangers are devices that are used to transfer heat between two or more fluid at different temperatures. They are used in a wide variety of applications such as refrigeration and air-conditioning system, power engineering and other thermal processing plants. In general, the enhancement of heat transfer techniques can be divided into two types, active and passive. The active techniques required external forces such as electric field, acoustic, and surface vibration. Meanwhile the passive techniques required special surface geometries or fluid additives. Naphon and Wongwises (2006). The simplest heat exchanger is one for which the hot and cold fluids move in the same or opposite directions in a concentric tube (or double-pipe) construction. In the parallel-flow arrangement of Figure 2.2 (a) the hot and cold fluids enter at the same exit, flow in the same direction, and leave at the same end. In the counterflow arrangement, the fluids enter at opposite entrance points, flow in opposite directions, and leave at opposite exit point.
(a) (b)
Figure 2.2: Different flow regimes and assiociated temperature profile in double pipe exchangers with (a) parallel-flow and (b) counter-flow. (Cengel and Ghajar, 2011)
Cold In
Hot In
Cold Out Cold Out
Hot
In Hot Out Hot In Hot Out
[image:23.595.118.521.392.693.2]8
Fakheri, A. (2014) studied about the efficiency analysis of heat exchanger and heat exchanger networks. He found that the heat exchanger efficiency was a convenient approach for heat exchanger analysis, and can be used to solve ratio and sizing problems, as well as network of heat exchangers without the need for charts, or complicated performance expression. The efficiency of all heat exchangers were determined from a single algebraic expression. A new expression for direct solution of the sizing problem was presented. A closed form expression for determining the required minimum number of heat exchangers was derived. This paper also presents a new methodology for analysing network of heat exchangers connected in series which allows the direct determination of the size of individual heat exchanger, and rate of heat transfer in them, which shows that the heat transfer rate in consecutive heat exchangers connected in series increases geometrically.
Haris et al. (2002) has fabricated and tested two types of micro-cross-flow heat exchangers. Analytical and numerical models were developed and the models were found to accurately predict the performance of the heat exchangers. The models incorporate, to first order, the prediction that heat transfer or gas channel volume is inversely proportional to scale. The scale of heat exchangers that were fabricated was approximately one order smaller than conventional scale heat exchangers and heat transfer or volume was between 3-7 times greater. One of the suspected reasons for heat transfer or volume ratio which does not strictly follow the scaling prediction was that porosity in conventional scale heat exchangers is higher than micro-heat exchangers. In addition, the scaling law is based only on the volume occupied by the through-plane channels. Nevertheless, relative to a conventional scale heat exchangers, the fabricated heat exchangers provide extremely high rates of heat transfer or volume and relatively high ratio heat transfer for given pressure drops.